 Open Access Article
N-type thermoelectric Ag8SnSe6 with extremely low lattice thermal conductivity by replacing Ag with Cu†
Chao Yang ab,
Yong Luo
 *a,
Xie Lib and
Jiaolin Cui
 *b
*b
aSchool of Chemical Engineering & Technology, China University of Mining and Technology, Xuzhou, 221116, China
bSchool of Material & Chemical Engineering, Ningbo University of Technology, Ningbo, 315016, China. E-mail: cuijiaolin@163.com
First published on 19th January 2021
Abstract
Argyrodite family compounds inherently possess low lattice thermal conductivity (κL) due to the liquid-like behavior of cations and the intimate interplay among mobile ions. Hence, they have become the focus of discussion in thermoelectrics recently. However, the major bottleneck for further improvement of their thermoelectric (TE) performance is their low carrier concentration. In this work, we take an advantage of the unique structure of Ag8SnSe6, in an attempt to further reduce the lattice part (κL) while at the same time improve their electrical property. The results show that the κL value reduces from 0.17 W K−1 m−1 to 0.12 W K−1 m−1 when Ag is substituted for Cu through induced point defects and lattice distortion and that the power factor (PF) increases from 4.1 μW cm−1 K−2 to 4.4 μW cm−1 K−2 at 645 K after enhancing the Seebeck coefficients. Finally, the maximum ZT value of ∼0.85 is attainted for Ag7.95Cu0.05SnSe6 at 645 K, an increase by a factor of 1.3 compared to that of the pristine Ag8SnSe6. This result demonstrates that the replacement of Ag by Cu in Ag8SnSe6 is an effective way to improve its TE performance.
1 Introduction
A growing number of researchers direct their attention to thermoelectric (TE) applications as the TE materials can directly convert heat to electricity without moving parts or emitting greenhouse gases.1–4 The TE performance can generally be characterized by the dimensionless figure of merit ZT (ZT = Tα2σ/κ), where T, α, σ and κ are the absolute temperature, Seebeck coefficient, electrical conductivity, and total thermal conductivity which is the sum of lattice (κL) and electronic (κe) parts mainly. In order to enhance the ZT value, one should boost α2σ called the power factor (PF), which is associated with electrical transport properties, and reduce κ simultaneously. However, it is still challenging to improve the TE performance significantly because of the interdependency among the three parameters (α, σ and κe).In the past two decades, many strategies have been developed, such as the band engineering near the Fermi level5–12 and nanomicrostructure engineering.13–15 The former aims at optimizing the electronic structure and the latter strengthening phonon scattering by introducing lattice distortion and nanostructures. Additionally, some materials with very low intrinsic thermal conductivity has been attracting much attention, due to either resonant bonding,16,17 the loosely bonded atoms in atomic voids with rattling18 or “liquid-like behavior”.19,20 The aforementioned strategies can generally be realized by off-stoichiometry in composition and element doping.6,13 Although the carrier concentration can slightly be tuned via composition engineering21 due to the presence of thermodynamic equilibrium state of the material, it is found that isoelectronic substitution seems more effective in reducing the lattice part κL and modulating the carrier concentration simultaneously for semiconductors with weak chemical bonds.22,23 For example, the substitution of Cu on Ag in Ag9GaSe6 or Ag for Cu in Cu8GeSe6 can decrease κL without degrading the electrical property.24,25 Because of the different features between the Cu–Se and Ag–Se chemical bonds26 (see Fig. S1†), the carrier concentrations of Cu-contained binary chalcogenides are usually about one order higher in magnitude than those of Ag-contained counterparts,26–31 and the same situation applies to the ternary argyrodite family compounds.24,32–35 This gives us inspirations that the carrier concentration can be enhanced by isoelectronic substitution of elements in terms of their chemical bonds.
In addition, guided by the “phonon–liquid electron–crystal (PLEC)” concept proposed by Liu et al.,36 argyrodite-type compounds has drawn significant attention in thermoelectrics in recent years. This material has a general formula A(12−n)/mm+Bn+X62− (Am+ = Li+, Cu+, or Ag+, Bn+ = Ga3+, Si4+, Ge4+, Sn4+, p5+, or As5+, and X = S, Se, or Te). Due to their complex crystal structures and weakly bonded Ag or Cu atoms, the argyrodite-type compounds exhibit intrinsically low κL. For example, Lin et al. reported that the acoustic phonons of argyrodite Ag9GaSe6 has an extremely low cutoff frequency (only ∼0.5 THz), which makes its κL as low as ∼0.15 W m−1 K−1 in the entire temperature range. As a result, a peak figure of merit ZT (ZT ∼ 1.5) is attained at 850 K.34 Another similar compound Cu8GeSe6 has a low κL value of 0.2 W m−1 K−1 and ZT value as high as 1.0.24 For the Ag8SnS6 compound, it is reported that lattice part κL is 0.31–0.61 W m−1 K−1,37 much higher than those observed in Ag9GaSe6 and Cu8GeSe6 and that the recorded ZT value is only 0.8. Therefore, it is highly likely to improve the TE performance of Ag8SnS6 if its κL value can be further reduced.
In this work, we replace Ag with Cu in Ag8SnSe6, in an attempt to tune the carrier concentration and reduce the lattice part κL by introducing point defects. It is found that there are two diverse effects on κL: the first one is the increased point defects and lattice distortion upon the replacement of Ag by Cu, which, as a result, strengthens the phonon scattering; the second one is that this replacement weakens the “liquid-like behavior”. Due to the higher bond energy of Cu–Se (255 kJ mol−1) than that of Ag–Se (210 kJ mol−1) (Fig. S1†) in chalcogenide glasses,38 the thermal conductivities increases. Consequently, we observed a low lattice part (κL ∼ 0.12 W m−1 K−1) at 645 K. This κL value, which is lower than those of Nb-doped and extra Sn-added Ag8SnSe6,23,39 is mainly responsible for the improvement in TE performance with the highest ZT value of 0.85. This work proves that the substitution of Cu on Ag in Ag8SnSe6 can effectively improve its TE performance.
2 Experimental
2.1 Sample preparation
The four high-purity elements (with the purity > 99.999%, Emei Semicon. Mater. Co., Ltd. Sichuan, CN) were weighted in stoichiometric ratio and sealed in evacuated quartz ampoules to synthesize polycrystalline samples of Ag8−xCuxSnSe6 (x = 0, 0.025, 0.05, 0.075 and 0.1). The mixtures of the four elements were melted at 1273 K for 48 h and quenched in cold water. Subsequently, the ingots were annealed at 527 K for 72 h and then cooled down to room temperature (RT) in furnace.The ingots were then ball milled for 5 h at a rotation rate of 350 rpm in stainless steel bowls that contain benzinum before drying. The dried powders were loaded into graphite dies and sintered using the spark plasma sintering apparatus (SPS-1030) at 600 K under a pressure of 55 MPa. The obtained pellets have a density about 98% of the theoretical one.
The obtained samples were ground into square-crossed long bars with in sizes of about 2 × 3 × 10 mm3 and 2 × 2 × 7 mm3 for electrical property and Hall coefficients measurements respectively and coin-shaped disks of φ10 × 1.5 mm2 for thermal diffusivity measurement.
2.2 Physical property measurements
The electrical transport properties including Seebeck coefficient (α) and electrical conductivity (σ), and the thermal diffusivity (D) at a temperature ranging from ∼RT to ∼650 K were measured by using ZEM-3 (ULVAC-RIKO, Japan) and TC-1200RH (ULVAC-RIKO, Japan). The thermal conductivities (κ) were calculated from the formula κ = ρCpD, where ρ is the density of pellet measured by the Archimedes method and Cp is the estimated heat capacity presented by Li et al.40 The electronic contributions (κe) is expressed by the Wiedemann–Franz (W–F) relation, κe = LoσT, where Lo is the Lorenz number, estimated using the formula Lo = 1.5 + exp(−|α|/116)24 (where Lo is in 10−8 W Ω K−2 and |α| in μV K−1).Hall coefficients (RH) were measured by using a four-probe configuration in a system (PPMS, Model-9) with a magnetic field up to ±5 T. The Hall mobility (μ) and carrier concentration (nH) were calculated according to the formulae μ = |RH|σ and nH = 1/(eRH) respectively, where e is the electron charge.
The TE figure of merits (ZTs) were calculated by the three parameters mentioned above with a total uncertainty of ∼18.0%.
2.3 Compositions and structural analyses
The X-ray diffraction (XRD) patterns of Ag8−xCuxSnSe6 (x = 0, 0.025, 0.05, 0.075 and 0.1) were obtained on an X-ray diffractometer (XRD, D8 Advance) instrument operated at 50 kV and 40 mA (Cu Kα radiation, λ = 0.15406 nm) in the 2θ range from 10° to 110° with a step size of 0.02°, and the XRD patterns were refined by utilizing a X'Pert Pro, PANalytical code. The lattice constants a, b and c were directly attained from the Rietveld refinement on the XRD patterns with an error less than 0.3–0.4%. A high-resolution transmission electron microscopy (HRTEM; JEM-2010F) operated at 200 kV was employed to observe the microstructures of Ag7.95Cu0.05SnSe6.The absorption coefficient measurements and UV absorption spectra analyses for the powders were carried out using a PerkinElmer Lambda 950 UV-VIS-NIR spectrophotometer.
The phase transition was studied by a differential scanning calorimeter (DSC), which was conducted in a Netzch STA 449 F3 Jupiter equipped with a TASC414/4 controller with a heating rate of 5 K min−1 under an argon atmosphere.
3 Result and discussion
3.1 Compositions and structures
The scanning electron microscopy (SEM) image of the surface-polished sample Ag7.95Cu0.05SnSe6 was observed, and only a few pores can be seen, as shown in Fig. S2a (ESI).† From the EDS patterns and mappings of the elements (Fig. S2b–f†), there are slight segregations of the elements (Ag, Cu, Sn and Se) within the grains, indicating that the elements are not distributed uniformly.The X-ray diffraction patterns of Ag8−xCuxSnSe6 (x = 0, 0.025, 0.05, 0.075 and 0.1) are summarized in Fig. 1a. The diffraction peaks of all the samples can be well indexed to the low-temperature β-phase (space group: Pmn21, ICSD #95093) with no impurities identified. Besides, the main diffraction peaks shift to the high angle site as the Cu content increases (Fig. 1b), indicating a shrinking in the crystal structure. This is due to the smaller ionic radius of Cu+ (0.77 Å) than that of Ag+ (1.15 Å) and can be further verified by the decreased lattice parameters (a, b, c), as shown in Fig. 1c. The parameter c reduces remarkably while a and b exhibit only a slight decreasing tendency. Besides, they all decrease linearly, conforming to Vegard's law. This suggests that element Cu is fully incorporated into the Ag8SnSe6 matrix.
In order to check the phase transition in the measured temperature range, the XRD analysis to the sample Ag8SnSe6 at various temperatures (300 K, 373 K, 450 K and 600 K) is carried out. The results are presented in Fig. 2a. It is noted that the material undergoes a phase transition from the orthorhombic β-phase (ICSD #95093) to the cubic γ-phase (PDF #19-1133) at ∼370 K. The low-temperature β-phase is widely considered as a non-superionic phase while the high-temperature γ-phase is a superionic one with highly mobile silver ions. At 450 K, all of the Ag8−xCuxSnSe6 (x = 0, 0.025, 0.05 and 0.075) materials are indexed to cubic γ-Ag8SnSe6 (PDF #19-1133) without any impurities identified (see Fig. 2a and b).
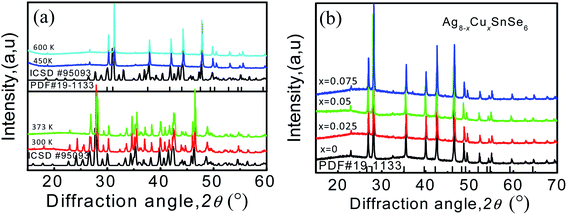 | ||
| Fig. 2 (a) PXRD patterns of Ag8SnSe6 at 300 K, 373 K, 450 K and 600 K; (b) PXRD patterns of Ag8−xCuxSnSe6 (x = 0, 0.025, 0.05, 0.075) at 450 K. | ||
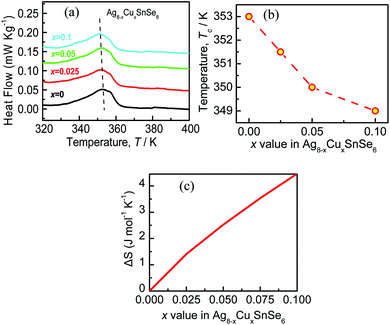
Generally, phase transition is unfriendly to practical application for thermoelectric devices because of the thermal expansion stress created between different phases.23,41 Therefore, it is necessary to reduce the phase transition temperature (Tc) and extend the temperature range in application. In this work, it is observed that Tc decreases with an increase in the content of Cu, as shown in Fig. 3a, and the detailed relation of Tc to the x value is summarized in Fig. 3b. The depression of Tc can be ascribed to the increase in the configurational entropy (ΔS) upon the incorporation of Cu into Ag8−xCuxSnSe6,42 which can be determined by the following formula:43,44
 | (1) |

It is observed that, the calculated configurational entropy (ΔS) of Ag8−xCuxSnSe6 gradually increases with the x value rising, as manifested in Fig. 3c. This indicates that the increased ΔS is mainly responsible for the depression of Tc. Such a phenomenon has been reported in many works.45–47 For example, the incorporation of AgSbSe2 in GeSe increases the configurational entropy (ΔS) and promotes the formation of a high symmetry phase, thus improving the TE performance.48 Besides, the highly tunable entropy caused by atomic substitutions can strongly scatter phonons and reduce the lattice thermal conductivities.33
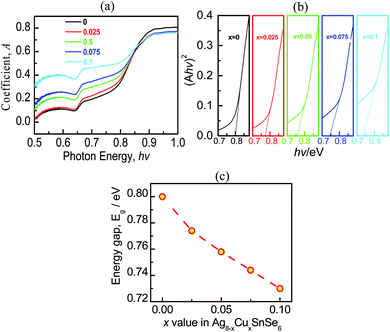
The absorption coefficient (A) as a function of photon energy (hv) is presented in Fig. 4a, and the experimentally determined bandgap (Eg) using a full spectra (Ahν)2 (hν) is shown in Fig. 4b. It is observed that the optical band gap (Eg) of intrinsic Ag8SnSe6 is ∼0.8 eV, agreeing well with the previously reported values.11,39 After Cu is added to the Ag8SnSe6, Eg decreases from 0.8 at x = 0 to 0.73 at x = 0.1, as shown in Fig. 4c, indicating a narrowing in the bandgap. This is critical because the drop in Eg allows the thermal excitation of electrons to the conduction bands to be easier, thus increasing the carrier concentration, and improving the transport properties.39 The presence of the another peak with an energy of 0.65 eV in absorption coefficient might be related to the intravalence-band transition (split-off band to heavy- or light hole band).49
3.2 Transport properties and TE performance
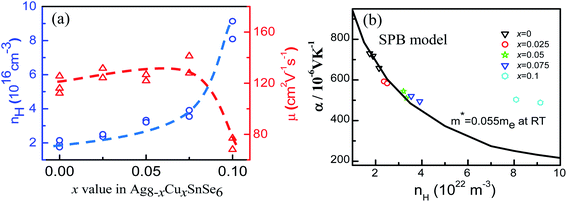
In order to have a deep understanding of the electronic transport properties upon doping, the Hall coefficients (RH) at room temperature (RT) are measured, and the Hall carrier concentration (nH) and mobility (μ) are calculated (Fig. 5a). It is observed that the nH value enhances from 1.93 × 1016 cm−3 at x = 0 to 8.61 × 1016 cm−3 at x = 0.1, comparable to that reported by Acharya et al.50 Usually, the mobility μ decreases because of ionized impurity and carrier scattering.51–53 However, the mobility μ in the present work is laying in the range of 1.17 × 102 cm2 V−1 s−1 and 1.34 × 102 cm2 V−1 s−1 when x value increases from 0 to 0.075 and remains almost unchanged, and then it drops as the x value exceeds 0.075. Such a phenomenon, which is also observed in the Zn1−xAlxO system,54 is attributed to a novel micro/nano-structure that provides a favorable crystalline framework for rapid electron transfer. In this work, we speculate that the almost unchanged mobility at x ≤ 0.075 is due to the limited change of the effective mass (m*), as shown in Fig. 5b, as all the Seebeck coefficients at RT follow the Pisarenko relation when m* = 0.055me, determined by the eqn (2), assuming that the present materials are degenerate semiconductors (single parabolic band, energy-independent scattering approximation).55 Only the α values at x = 0.1 are much high above the Pisarenko relation line.
 | (2) |
The drop of μ in x = 0.1 is probably attributed to the increased effective mass and the introduced point defects that play a dominant role in impeding the carrier mobility.56
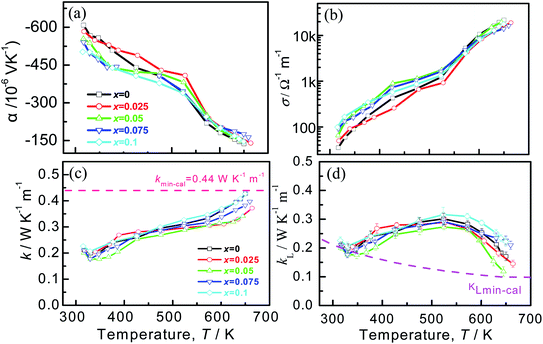
The temperature-dependent electrical transport properties are depicted in Fig. 6, where the Seebeck coefficients (α) are demonstrated in Fig. 6a. The Seebeck coefficients of all the samples are negative throughout the entire temperature range, indicative of the n-type conduction behavior. The systematic decrease in |α| with x values increasing below 353 K (phase transition temperature) is in line with the increased carrier concentration, as was observed in Cu7PSe6 compound.45 On the other hand, the composition dependence of the |α| for the samples doped with Cu becomes complicated. A similar appearance also happens to the electrical conductivities, as shown in Fig. 6b, in which the electrical conductivities of doped Ag8SnSe6 are higher at a low temperature but lower at the elevated temperatures. This may be related to the structural transformation from Pmn21 to F![[4 with combining macron]](https://www.rsc.org/images/entities/char_0034_0304.gif) 3m. Finally, the highest power factor of 4.35 μW cm−1 K−2 is attainted at 645 K in Ag7.95Cu0.05SnSe6, slightly higher than that of the pristine Ag8SnSe6 (4.11 μW cm−1 K−2).
3m. Finally, the highest power factor of 4.35 μW cm−1 K−2 is attainted at 645 K in Ag7.95Cu0.05SnSe6, slightly higher than that of the pristine Ag8SnSe6 (4.11 μW cm−1 K−2).
The temperature dependent of the total thermal conductivities (κ) and the lattice thermal conductivities (κL) are displayed in Fig. 6c and d. The κ value decreases until the phase transition temperature (Tc), and then increases with the temperature increasing, similar to those reported in ref. 57–60. Over the entire temperature range, the total thermal conductivities (κ) are very low, within the scale of 0.15–0.45 W K−1 m−1. This value approaches the amorphous limit, based on the Cahill model described below:
 | (3) |
 | (4) |
In addition, most of the samples gives lower thermal conductivities than that of the pristine sample at high temperatures. In addition to that, the κ value at high temperatures reduces with the x value increasing until at x = 0.05, after which it enhances continuously. The minimum κmin value is 0.34 W K−1 m−1 at ∼650 K for the sample at x = 0.05. It is considered that the reduction of κ at elevated temperatures arises mainly from two parts: one is the degraded electrical conductivity (κe) with an elevating temperature, as shown in Fig. 6d, and the other is the reduction of lattice part κL resulting from strongly intensified phonon scattering by point defects. The κL is attained by subtracting the κe from κ, where κe can be calculated via the Wiedemann–Franz law κe = LoTσ, and Lorenz factor (Lo) is estimated by the measured Seebeck coefficients.
Generally, the temperature dependence of the lattice part (κL) is quite different from that of the total κ, as the κL value increases with temperature at T < 550 K and drops at high temperatures. This presence can be seen in many other Ag8SnSe6 compounds,23,39 but its nature is hard to unravel yet at the moment. One of the possible explanation is that above 550 K the electrical conductivities (σ) have a sharp increase (Fig. 6b), which implies that the carrier concentration increases significantly, thus enhancing the phonon scattering of the carriers and reducing the κL. The another reason is the creation of the point defect CuAg upon Cu substitution on Ag, thus enhancing the phonon scattering at high temperatures. On the other hand, the κL above Tc first decreases until at x = 0.05 and then increases with an increase of the x value, indicating the presence of other scattering mechanisms, in addition to the scattering on the points defects. Since the highly mobile silver or copper ions in the argyrodite compounds are distributed in disorder at elevated temperatures due to relatively weak chemical bonding between Ag–Se or Cu–Se,65 the superionic argyrodites generally have inherent ultra-low lattice thermal conductivity because of liquid-like behavior of cations in a relatively larger unit cell. On the other hand, the Cu–Se bond is stronger compared to Ag–Se in most compounds (see Fig. S1†), as mentioned above. The stronger the bonding is, the higher the sound velocity.23,66 In this regard, there is a dual effect that regulates κL: one is point defects formed by cation substitution, which reduces the lattice part κL,37 and the other is the introduction of stronger Cu–Se bond than Ag–Se, which increases the κL value. That is why we observed the minimum κL ∼ 0.12 W K−1 m−1 at x = 0.05 and 645 K.
In order to elucidate the ultra-low lattice part in the high temperatures at x = 0.05, we estimate the κL by using the Slack and Morelli model67,68 given below, where the interactions among the phonons themselves via anharmonic Umklapp processes are only concerned.
 | (5) |
 | (6) |
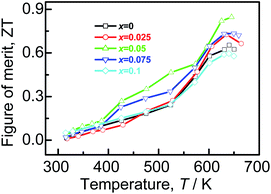
Combined with the three parameters (α, σ, κ), we estimate the ZT values that are shown in Fig. 7. The highest ZT value of ∼0.85 is achieved for Ag7.95Cu0.05SnSe6 at 645 K, which is about 30% higher than that of the pristine Ag8SnSe6. It is noted that the reported ZT value (above unity) by other researchers is attained at 800 K or even higher.11,23,39,40 If we compare the TE performance at 645 K, the present ZT value is comparable to or a little higher than those from others. Since above 645 K the samples failed holding their shapes during the electrical property measurement in our work, we have no results above 645 K.
4 Conclusions
In this work, a series of argyrodite type compounds Ag8−xCuxSnSe6 (x = 0.025, 0.05, 0.075 and 0.1) have been prepared and their TE performance examined. The results reveal that the lattice thermal conductivities reduces significantly without degradation of the electronic transport properties. The minimum κL ∼ 0.12 W K−1 m−1 is attained at x = 0.05 at 645 K, in a good agreement with that (0.1 W K−1 m−1 at 645 K) estimated by using the Slack and Morelli model. Consequently, the maximum ZT value of ∼0.85 is achieved for Ag7.95Cu0.05SnSe6 at 645 K, comparable to or a little higher than those in the other Ag8SnSe6 samples at the corresponding temperature.Conflicts of interest
There are no conflicts of interest to declare.Acknowledgements
This work is supported by the National Natural Science Foundation of China (51671109, 51171084).References
- L. E. Bell, Cooling, Science, 2008, 321, 1457–1461 CrossRef CAS.
- I. Petsagkourakis, K. Tybrandt, X. Crispin, I. Ohkubo, N. Satoh and T. Mori, Sci. Technol. Adv. Mater., 2018, 19, 837–862 CrossRef.
- M. T. Dunham, T. J. Hendricks and K. E. Goodson, Adv. Heat Transfer, 2019, 51, 299–350 Search PubMed.
- N. Nandihalli, C. Liu and T. Mori, Nano Energy, 2020, 78, 105186 CrossRef CAS.
- V. Dinnocenzo, A. R. S. Kandada, M. D. Bastiani, M. Gandini and A. Petrozza, J. Am. Chem. Soc., 2014, 136, 17730 CrossRef CAS.
- R. A. Orabi, N. Mecholsky, J. Hwang and W. Kim, Chem. Mater., 2016, 28, 5b04365 Search PubMed.
- A. Topp, J. M. Lippmann, A. Varykhalov, V. Duppel, B. V. Lotsh, C. R. Ast and L. M. Schoop, New J. Phys., 2016, 18, 125014 CrossRef.
- G. Tan, F. Shi, S. Hao, C. Hang, L. D. Zhao, C. Uher, C. Wolverton, V. P. Dravid and M. G. Kanatzidis, J. Am. Chem. Soc., 2015, 137, 5100 CrossRef CAS.
- Z. W. Chen, Z. Z. Jian, W. Li, Y. J. Chang, B. H. Ge, R. Hanus, J. Yang, Y. Chen, M. X. Huang, G. J. Snyder and Y. Z. Pei, Adv. Mater., 2017, 29, 1606768 CrossRef.
- S. Y. Wang, Y. X. Sun, J. Yang, B. Duan, L. H. Wu, W. Q. Zhang and J. H. Yang, Energy Environ. Sci., 2016, 9, 3436 RSC.
- M. Jin, S. Q. Lin, W. Li, Z. W. Chen, R. B. Li, X. H. Wang, Y. X. Chen and Y. Z. Pei, Chem. Mater., 2019, 31, 2603 CrossRef CAS.
- H. Wang, Y. Z. Pei, A. D. Lalonde and G. J. Snyder, Thermoelectric Nanomaterials, 2013, vol. 182, pp. 3–32 Search PubMed.
- S. Gorsse, P. B. Pereira, R. Decourt and E. Sellier, Chem. Mater., 2010, 22, 988 CrossRef CAS.
- S. J. Hong and B. S. Chun, Mater. Res. Bull., 2003, 38, 599 CrossRef CAS.
- T. H. An, S. M. Choi, W. S. Seo, C. Park, I. H. Kim and S. U. Kim, Jpn. J. Appl. Phys., 2013, 52, 10MC11 CrossRef.
- S. Lee, K. Esfarjani, T. Luo, J. Zhou, Z. Tian and G. Chen, Nat. Commun., 2014, 5, 4525 CrossRef.
- W. Zhang, N. Sato, K. Tobita, K. Kimura and T. Mori, Chem. Mater., 2020, 32, 5335–5342 CrossRef CAS.
- G. A. Slack, CRC Handbook of Thermoelectric, 1995, p. 407 Search PubMed.
- Z. X. Zhang, K. P. Zhao, T. Wei, P. F. Qiu, L. D. Chen and X. Shi, Energy Environ. Sci., 2020, 13, 3307–3329 RSC.
- T. Mao, P. F. Qiu, J. Liu, X. L. Du, P. Hu, K. P. Zhao, D. D. Ren, X. Shi and L. D. Chen, Phys. Chem. Chem. Phys., 2020, 22, 7374–7380 RSC.
- S. Lee, J. A. Bock, S. T. Mckinstry and C. A. Randall, J. Eur. Ceram. Soc., 2012, 32, 3971 CrossRef CAS.
- P. Ying, X. Li, Y. Wang and J. Yang, Adv. Funct. Mater., 2017, 27, 1604145 CrossRef.
- W. Li, S. Q. Lin, B. H. Ge, J. Yang, W. Q. Zhang and Y. Z. Pei, Adv. Sci., 2016, 3, 1600196 CrossRef.
- B. B. Jiang, P. F. Qiu, E. Eikeland, H. Y. Chen, Q. F. Song, D. D. Ren, T. S. Zhang, J. Yang, B. B. Iversen, X. Shi and L. D. Chen, J. Mater. Chem. C, 2017, 5, 943 RSC.
- X. Y. Qi, J. Chen, K. Guo, S. Y. He, J. Yang, Z. L. Li, J. J. Xing, J. F. Hu, H. J. Luo, W. Q. Zhang and J. Luo, Chem. Eng. J., 2019, 374, 494 CrossRef CAS.
- K. Zhao, A. B. Blichfeld, H. Chen, Q. F. Song, T. S. Zhang, C. X. Zhu, D. D. Ren, R. Hanus, P. F. Qiu, B. B. Iversen, F. F. Xu, G. F. Snyder, X. Shi and L. D. Chen, Chem. Mater., 2017, 29, 6367 CrossRef CAS.
- Y. He, T. Day, T. Zhang, H. L. Liu, X. Shi, L. D. Chen and G. J. Snyder, Adv. Mater., 2014, 26, 00515 Search PubMed.
- T. Wang, H. Y. Chen, P. F. Qiu, X. Shi and L. D. Chen, J. Phys., 2019, 68, 18 Search PubMed.
- D. Li, J. H. Zhang, J. M. Li, J. Zhang and X. Y. Qin, Mater. Chem. Front., 2020, 4, 875 RSC.
- S. Ballikaya, H. Chi, J. R. Salvador and C. Uher, J. Mater. Chem. A, 2013, 1, 12478 RSC.
- Y. Z. Pei, N. A. Heinz and G. J. Snyder, J. Mater. Chem., 2011, 21, 18256 RSC.
- X. C. Shen, C. C. Yang, Y. M. Liu, G. W. Wang, H. Tan, Y. H. Tung, G. Y. Wang, X. Lu, J. He and X. Y. Zhou, ACS Appl. Mater. Interfaces, 2019, 11, 2168 CrossRef CAS.
- S. Lin, W. Li, Z. Bu, B. Gao, J. Li and Y. Pei, Mater. Today Phys., 2018, 6, 60 CrossRef.
- S. Q. Lin, W. Li, S. S. Li, X. Y. Zhang, Z. W. Chen, Y. D. Xu, Y. Chen and Y. Z. Pei, Joule, 2017, 1, 1 CrossRef.
- S. Q. Lin, W. Li, Z. L. Bu, B. Shan and Y. Z. Pei, ACS Appl. Energy Mater., 2020, 3, 1892 CrossRef CAS.
- H. L. Liu, X. Shi, F. F. Xu, L. L. Zhang, W. Q. Zhang, L. D. Chen, Q. Li, C. Uher, T. Day and G. J. Snyder, Nat. Mater., 2012, 11, 422–425 CrossRef CAS.
- X. C. Shen, Y. Xia, C. C. Yang, Z. Zhang, S. L. Li, Y. H. Tung, A. Benton, X. Zhang, X. Lu, G. Y. Wang, J. He and X. Y. Zhou, Adv. Funct. Mater., 2020, 30, 2000526 CrossRef CAS.
- O. I. Shpotyuk, M. M. Vakiv, M. V. Shpotyuk and S. A. Kozyukhin, Semicond. Phys., Quantum Electron. Optoelectron., 2017, 20, 26 CrossRef CAS.
- X. X. Wang, C. Y. Liu, J. L. Chen, L. Miao, S. H. Wu, X. Y. Wang, Z. C. Xie, W. J. Xu and Q. F. Chen, CrystEngComm, 2020, 22, 248 RSC.
- L. Li, Y. Liu, J. Y. Dai, A. J. Hong, M. Zeng, Z. B. Yan, J. Xu, D. Zhang, D. Shan, S. l. Liu, Z. F. Ren and J. M. Liu, J. Mater. Chem. C, 2016, 4, 24 Search PubMed.
- Y. T. Qiu, J. Yang, D. Y. Wang, M. J. Guan, W. K. He, S. Peng, R. H. Liu, X. Gao and L. D. Zhao, J. Mater. Chem. A, 2019, 7, 26393 RSC.
- H. W. Deng, Z. M. Xie, M. M. Wang, Y. Chen, R. Liu, J. F. Wang, T. Zhang, X. P. Wang, Q. F. Fang, C. S. Liu and Y. Xiong, Mater. Sci. Eng., A, 2020, 774, 138925 CrossRef CAS.
- R. H. Liu, H. Y. Chen, K. P. Zhao, Y. T. Qin, B. B. Jiang, T. S. Zhang, G. Sha, X. Shi, C. Uher, W. Q. Zhang and L. D. Chen, Adv. Mater., 2017, 2, 712 Search PubMed.
- C. M. Rost, E. Sachet, T. Borman, A. Moballegh, E. C. Dickey, D. Hou, J. L. Jones, S. Curtarolo and J. Maria, Nat. Commun., 2015, 6, 8485 CrossRef CAS.
- R. Chen, P. F. Qiu, B. B. Jiang, P. Hu, Y. M. Zhang, J. Yang, D. D. Ren, X. Shi and L. D. Chen, J. Mater. Chem. A, 2018, 6, 6493 RSC.
- B. Jiang, P. Qiu, H. Chen, J. Huang, T. Mao, Y. Wang, Q. Song, D. Ren, X. Shi and L. Chen, Mater. Today Phys., 2018, 5, 20 CrossRef.
- G. D. Tang, F. Xu, Y. He, L. Y. Wang, L. Qiu and Z. H. Wang, Phys. Status Solidi B, 2013, 7, 1327 CrossRef.
- Z. W. Huang, S. A. Miller, B. H. Ge, M. T. Yan, S. Anand, T. Wu, P. F. Nan, Y. H. Zhu, W. Zhuang, G. J. Snyder, P. Jiang and X. H. Bao, Angew. Chem., 2017, 8, 134 Search PubMed.
- L. J. Lin, J. H. Wernick, N. Tabatabaie, G. W. Hull and B. Meagher, Appl. Phys. Lett., 1987, 51, 2051 CrossRef CAS.
- S. Acharya, J. Pandey and A. Soni, ACS Appl. Energy Mater., 2018, 2, 1 Search PubMed.
- J. L. Cui, Y. F. Lu, S. P. Chen, X. L. Liu and Z. L. Du, RSC Adv., 2018, 8, 9574 RSC.
- M. Li, Y. Luo, G. M. Cai, X. Li, X. Y. Li, Z. K. Han, X. Y. Lin, D. Sarker and J. L. Cui, J. Mater. Chem. A, 2019, 7, 2360 RSC.
- X. Yan, G. Joshi, W. Liu, Y. Lan, H. Wang, S. Lee, J. W. Simonson, S. J. Poon, T. M. Tritt, G. Chen and Z. F. Ren, Nano Lett., 2011, 11, 556 CrossRef CAS.
- D. B. Zhang, H. Z. Li, B. P. Zhang, D. D. Liang and M. Xia, RSC Adv., 2017, 7, 10855 RSC.
- G. J. Snyder and E. S. Toberer, Nat. Mater., 2008, 7, 105 CrossRef CAS.
- Z. H. Hou, Y. Xiao and L. D. Zhao, Nanoscale, 2020, 12, 026498 Search PubMed.
- W. Li, S. Q. Lin, M. Weiss, Z. W. Chen, J. Li, Y. D. Xu, W. G. Zeier and Y. Z. Pei, Adv. Energy Mater., 2018, 8, 1800030 CrossRef.
- T. J. Zhu, S. N. Zhang, S. H. Yang and X. B. Zhao, Phys. Status Solidi RRL, 2010, 11, 317 CrossRef.
- K. Kurosaki, A. Kosuga, H. Muta, M. Uno and S. Yamanaka, Appl. Phys. Lett., 2005, 87, 061919 CrossRef.
- A. Charoenphakdee, K. Kurosaki, H. Muta, M. Uno and S. Yamanaka, Phys. Status Solidi RRL, 2008, 2, 65 CrossRef CAS.
- F. Reissig, B. Heep, M. Panthfer, M. Wood, S. Anand, G. J. Snyder and W. Tremel, Dalton Trans., 2019, 48, 15822 RSC.
- S. Ballikaya, H. Chi, J. R. Salvador and C. Uher, J. Mater. Chem. A, 2013, 1, 12478 RSC.
- H. Liu, X. Yuan, P. Lu, X. Shi, F. F. Xu, Y. He, Y. S. Tang, S. Q. Bai, W. Q. Zhang, L. D. Chen, Y. Lin, L. Shi, H. Lin, X. Y. Gao, X. M. Zhang, H. Chi and C. Uher, Adv. Mater., 2013, 25, 6607 CrossRef CAS.
- Z. X. Ye, J. Y. Cho, M. M. Tessema, J. R. Salvador, R. A. Waldo, H. Wang and W. Cai, J. Solid State Chem., 2013, 201, 262 CrossRef CAS.
- I. S. Osypyshyn, N. V. Chekailo and V. I. Vsesoyuzn, Physics and Technical Applications of Chalcogenides, 1988, vol. 3, p. 282 Search PubMed.
- A. Yusufu, K. Kurosaki, Y. Ohishi, H. Muta and S. Yamanaka, Jpn. J. Appl. Phys., 2013, 52, 81801 CrossRef.
- D. T. Morelli and G. A. Slack, High Therm. Conduct. Mater., 2006, 2, 37 Search PubMed.
- J. Krez, J. Schmitt, G. J. Snyder, C. Felser, W. Hermes and M. Schwind, J. Mater. Chem. A, 2014, 2, 13513 RSC.
Footnote |
| † Electronic supplementary information (ESI) available. See DOI: 10.1039/d0ra10454j |
| This journal is © The Royal Society of Chemistry 2021 |


