 Open Access Article
Fluorescence quenching mediated detection of hydrogen peroxide using tungsten incorporated graphitic carbon nitride nanoflakes
Aftab Ahmed ab,
Akhtar Hayata,
Mian Hasnain Nawaza,
Aqif Anwar Chaudhrya,
Peter John*b and
Muhammad Nasir
 *a
*a
aInterdisciplinary Research Centre in Biomedical Materials (IRCBM), COMSATS University Islamabad, Lahore Campus, 1.5 km Defence Road, Off Raiwind Road, Lahore, Punjab 54000, Pakistan. E-mail: muhammadnasir@cuilahore.edu.pk; Fax: +92-42-5321090; Tel: +92-42-111-001-007 ext. 828, 829
bGovernment College University Lahore, Katchery Road, Anarkali, Lahore, Punjab 54000, Pakistan. E-mail: peterjohn@gcu.edu.pk
First published on 15th February 2021
Abstract
A reliable, non-enzymatic detection for H2O2 with high sensitivity and accuracy is of profound importance and getting considerable interest due to its usefulness in biological systems. Therefore, this work was aimed to develop a sensitive method for the detection of H2O2 using rhodamine B as a fluorescence system and tungsten doped graphitic carbon nitride (W/GCN) as catalysts. Fluorescence quenching and colorimetric properties of the chromogenic-dye probe were used as a detection strategy of H2O2. The enhanced catalytic property of nanoflakes of W/GCN was attributed to the unique structural characteristics, influenced by the dopant, that not only tuned its bandgap but also enhanced separation of electron–hole pairs as compared to planar and larger sized nanosheets of pristine GCN. This low-cost and rapid assay offered a very low limit of detection of 8 nM for the fluorescence quenching method and 20 nM for the colorimetric method. The linear range for fluorescence quenching and colorimetric H2O2 assays were from 10–500 nM and 35–400 nM, respectively. Therefore, this novel method of using W/GCN nanoflakes in fluorescence quenching and colorimetric based detections of H2O2 is expected to catch more interest on the topic of using non-enzymatic platforms for sensitive and selective detection of different analysts.
1. Introduction
Hydrogen peroxide (H2O2) is a well-known chemical in domestic, industrial, and food processing applications. It plays a vital role in many biological functions in the body. Over fifty micromolar of H2O2 is considered toxic to animals and plants and causes diabetes, cancer, and Alzheimer's.1,2 In the past, H2O2 detection and monitoring used to be carried out using natural enzymes, which were costly, environmentally less stable, and difficult to handle. To overcome this, recently, researchers are trying different kinds of nanomaterials having enzyme-like properties and often called nanozymes to replace natural enzymes.3Among reported nanozymes,4 graphitic-carbon-nitride (GCN) has emerged as a preferred nanomaterial for sensor applications because of its unique physicochemical properties such as low-cost, facile synthesis, less-toxicity and chemical and thermal stability.5 The two-dimensional stacked metal-free structure of graphitic carbon nitride with strong C–N bonding instead of C–C gives semiconductor characteristics. Therefore, it is now wildly used in photocatalysis and optoelectronic conversion devices. It is commonly prepared both through top-down and bottom-up approaches by using low-cost precursors such as urea, melamine and its derivatives, and cyanuric acid. Despite the above properties, GCN has intrinsic defects6 such as small surface area, narrow light absorption range, high-recombination of electron–hole pairs,7 and low electron transferability.8 These intrinsic shortcomings in GCN limit its catalytic performance. Therefore, the preparation of defect-free GCN catalyst was a hot topic in the past.9
In order to overcome the above-mentioned limitations in GCN, significant efforts are being made in terms of structural modification and lattice doping to improve its catalytic activity. Various kinds of structures such as nanosheets, nanorods, as well as elemental dopants from alkaline, transition, and lanthanides metals, are tried and reported to increase its surface area, modify its bandgap, and reduce the recombination of electron–hole pairs. Metallic doping in nanomaterials is favoured more as it happens to impact the structure and electronic properties by modifying its surface area and amending its band gaps. Among metals, tungsten is known for its excellent electronic, optical, and electrical properties like conductivity and high charge carrier mobility when doped in semiconductor nanomaterials. During the doping of tungsten in carbon nitrides, the lone pair of nitrogen from carbon nitrides is donated to W(VI) due to the Lewis-acid and Lewis-base coordination. This results in the formation of a polymeric framework between the active sites of tungsten and nitrogen (W–N) in W doped GCN. Therefore, this W–N coordination in W doped GCN is considered the main reason behind the improvement in structural, electronic, optical, and electric properties.10
Herein, the current article reports the effect of tungsten doping on the structural and electronic properties of graphitic carbon nitrides. The properties of doped graphitic carbon nitrides were studied using XRD, SEM, EDX, FTIR, PLS, Raman, and UV-visible absorbance and diffuse reflectance spectroscopies. It was observed that the pristine GCN hold large-sized crystalline nanosheets as compared to W doped GCN, which were of small-sized amorphous nanoflakes. In addition to the structural changes, W doping also imparts improvement in the electronic and optical properties of GCN through coordination linkage. Furthermore, the novel use of these prepared nanoflakes is reported here for sensitive and selective determination of hydrogen peroxide through enzyme-free colorimetric and fluorescence quenching techniques. The whole process from the synthesis of W/GCN to the determination of H2O2 using the fluorescence quenching method is summarized and presented in Scheme 1.
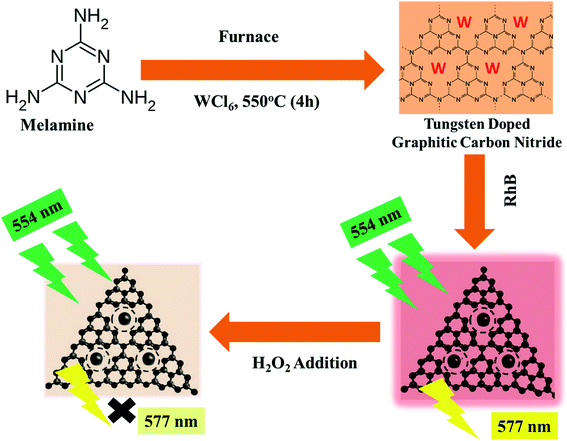 | ||
| Scheme 1 Schematic representation of the process from the synthesis of W/GCN to the detection of H2O2 by fluorescence quenching of RhB. | ||
2. Experimental section
2.1. Chemicals used
All the chemicals were of analytical grade and used without further purification. Tungsten chloride (WCl6·6H2O) was received from Acros Organics. Pyrocatechol, potassium chloride, sodium chloride, sodium hydroxide, calcium chloride, phosphate buffer saline (PBS) tablets, benzoquinone (BQ), and hydrochloric acid were purchased from Sigma Aldrich. Rhodamine B was obtained from Avonchem. L-Cysteine, melamine (C3H6N6), and H2O2 (30% of w/v solution) were purchased from Merck. D-Glucose, resorcinol, triethanolamine (TEOA), tert-butyl alcohol (TBA), and uric acid were obtained from BDH chemicals Ltd. L-(+)-Ascorbic acid was purchased from Daejung. All the solutions were made in PBS. The distilled water with a conductivity of 20 μΩ cm−1 was prepared in a Millipore system.2.2. Characterization
X-ray powder diffraction (XRD) analysis was used for phase and structure determination, and spectra were obtained using Rigaku D/max 2500 PC X-ray powder diffractometer. The electronic microscopy was used to determine the shape and surface morphology of doped GCN nanoflakes, and therefore scanning electron microscope (SEM) model Vega 3 LMU TESCAN equipped with an electron beam was used for the shape of prepared samples. Energy Dispersive X-ray (EDX) was used to find out the elemental and chemical properties of the samples. EDX analysis shows the purity of the samples by identifying the elements from the quantitative elemental composition profile. FTIR spectra of the prepared samples was acquired using Nicolet 6700 Thermo Fisher Scientific FTIR spectrophotometer to find out the specific functional groups in the doped samples. UV-Vis DRS data was used to determine the optical bandgap of the prepared samples. UV-Vis DRS was obtained from PerkinElmer Lambda 35 spectrophotometer. Also, the UV-Vis absorption spectra of liquid samples for colorimetric measurements were obtained using a PerkinElmer Lambda 25 UV-Vis absorption spectrophotometer.Photoluminescence (PL) spectroscopy was used to probe the electronic characteristics of the materials through the absorption of light and generation of photo-excited electron–hole pairs. Raman and PL measurements were performed using a laser scanning confocal Renishaw microscope, having a laser excitation wavelength of 457 nm at room temperature. Fluorescence spectroscopy was used to measure the increase or decrease in fluorescence for the qualitative and quantitative detection of hydrogen peroxide using Varian Agilent Cary Eclipse fluorescence spectrophotometer.
2.3. Fabrication of W/GCN
Graphitic carbon nitride and tungsten doped graphitic carbon nitride (W/GCN) nanostructures were prepared by a simple calcination-method.11,12 The mixtures of melamine powder (10 g, 79 mmol) with WCl6·6H2O (0, 0.05, 0.20, 0.35 and 0.5 mmol) were prepared in pestle and mortar. Solid mixtures were added into semi-closed alumina crucibles containing ceramic lids and heated at a ramp of 4 °C min−1 from room temperature to 550 °C in a muffle furnace. Maintained the reaction temperature at 550 °C for 4 hours. After natural cooling the furnace, the final products were grounded to fine powders and washed with distilled water three-time to remove any unreacted nitrogenous materials. This was followed by drying the samples in the vacuum oven at 80 °C for 24 hours. After that, the samples were labeled as GCN, W/GCN-0.05, W/GCN-0.20, W/GCN-0.35, and W/GCN-0.5 for different concentrations of tungsten chloride used in the synthesis process.2.4. Catalytic tests
The catalytic activities of prepared nanomaterials were tested by oxidation of RhB using H2O2 as oxidant. The change in fluorescent RhB concentration in the reaction mixture was determined by fluorescence and colorimetric methods. A stock suspension containing 2 mg of the solid catalyst in 1 mL of PBS was prepared by sonication for 10 min for each prepared sample.For fluorescence quenching assay, 83.5 μL of 2 mg mL−1 of catalyst suspension was added in 2915 μL of 67 ng mL−1 of RhB solution and sonicated for 5 min. The resultant reaction mixture was incubated for 30 min to make sure the adsorption–desorption dynamic equilibrium of RhB on the catalyst nanostructures surface. Emission from the reaction mixture containing RhB and the catalyst was recorded by using a fluorescence spectrophotometer at an excitation wavelength of 554 nm. Fluorescence emission intensity at 577 nm was obtained from the above spectrum and labeled as F0. After that, 1.5 μL of 1 mM of H2O2 was added to the above reaction mixture. After the incubation for 15 min, the final fluorescence emission spectrum of catalyst-nanostructures, RhB, and H2O2 containing reaction mixture was scanned. The final fluorescence emission intensity at 577 nm was obtained from this graph and labeled as F577. The change in fluorescence intensities at 577 nm (ΔF577) was determined, and it provided the catalytic power of catalyst nanostructures for the reaction between RhB and H2O2. Catalyst performance was expressed in the following equation.
| ΔF577 = F0 − F577 |
For the colorimetric analysis, first, a blank containing 500 nM of H2O2 and 65 ng mL−1 of RhB in 10 mM PBS was prepared. The absorbance of the blank reaction mixture was noted at 554 nm and labeled as A0. Second, a reaction mixture containing 56 μg mL−1 of catalyst suspension, 65 ng mL−1 of RhB, and 500 nM of H2O2 was prepared. The absorbance of the second mixture at 554 nm was determined and labeled as A554. The catalyst role in the reaction between RhB and H2O2 was measured by determining the change in absorbance (ΔA554). The reaction performance of the catalyst was expressed in the following equation.
| ΔA554 = A0 − A554 |
Concentrations of reacting species in 3 mL of concluding volume of the reaction mixture in fluorescence and colorimetric assays were 65 ng mL−1, 56 μg mL−1, and 500 nM for [RhB], [catalyst], and [H2O2], respectively. Every time fresh H2O2 and RhB solutions were used for each measurement.
The mechanism of the catalytic reaction between H2O2 and RhB was determined by adding reactive species scavengers in the reaction mixture. TEOA, TBA, and BQ were selected for hole-radical removal, hydroxyl radical scavenger, and super-oxide scavenger from the reaction mixture. The concentration of TEOA, TBA, and BQ was 10 mM, 10 mM, and 5 mM in the reaction mixture, respectively.
The selectivity of the developed sensor was studied by adding interfering species in the reaction mixture under the same reaction conditions as above. For this purpose, uric acid, resorcinol, ascorbic acid, dopamine, pyrocatechol, L-cysteine, and ionic species like Na+, and Cl1− were added to the reaction mixture in the place of H2O2.
3. Results and discussions
3.1. Characterization of catalysts
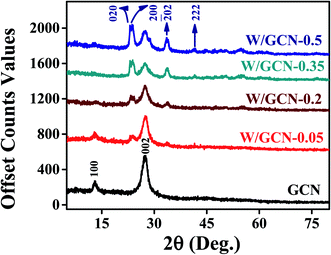
XRD spectra of as-prepared GCN and W/GCN are presented in Fig. 1. GCN spectrum showed two peaks at 2-theta (2θ) of 13.1° and 27.4° that were indexed at (001) and (002) of hexagonal planes (JCPDS 01-87-1526). The first peak at 13.1° in the GCN spectrum represents the in-plane structural repeating of the heptazine (C6N7) motif. It was assigned to the distance between holes in the nitride pores in the GCN crystal. The second peak at 27.4° in the GCN spectrum represents the interplanar stacking of conjugated one-dimensional melon strands (tri-s-triazine units) of the graphitic crystalline phases with an interlayer distance of 0.326 nm. Diffraction peaks of W/GCN-0.2 at 2θ of 23.1°, 23.75°, 24.4°, 33.6°, and 41.56° were indexed at (002), (020), (200),![[( with combining overline]](https://www.rsc.org/images/entities/char_0028_0305.gif) 202) and (222) planes for W and WO3 triclinic phases12 (JCPD-43-1035, JCPD-00-032-1395). The intensity of the (002) peak was decreased with an increase in W loading in GCN, which can be assigned to the interaction of W with the nitrite of GCN. Similarly, the decrease in intensity of the (001) peak of GCN in W/GCN-0.2 was related to the reduction of in-plane packing motif in W/GCN samples.
202) and (222) planes for W and WO3 triclinic phases12 (JCPD-43-1035, JCPD-00-032-1395). The intensity of the (002) peak was decreased with an increase in W loading in GCN, which can be assigned to the interaction of W with the nitrite of GCN. Similarly, the decrease in intensity of the (001) peak of GCN in W/GCN-0.2 was related to the reduction of in-plane packing motif in W/GCN samples.
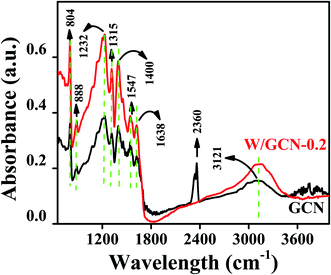
FTIR spectra of GCN and W/GCN-0.2 are shown in Fig. 2. GCN spectrum showed a stretching vibration (3121 cm−1) for residual N–H groups and absorbed oxygen-containing molecules such as water. The absorption peak at 2360 cm−1 in GCN was assigned to C![[double bond, length as m-dash]](https://www.rsc.org/images/entities/char_e001.gif) O bonds of CO2 molecules. GCN absorption bands at 1232 cm−1, 1315 cm−1, 1400 cm−1, 1456 cm−1, 1547 cm−1, and 1638 cm−1 was related to common stretching vibrations of CN heterocyclic groups. The absorption band of GCN at 804 cm−1 in the fingerprint region was attributed to the breathing vibrations of s-triazine units. For W/GCN-0.2, intensities of GCN peaks were enhanced. The enhancement in the intensity of 804 cm−1 peaks in W/GCN-0.2 as compared to the GCN peak was resulted because of the partial overlapping bands of W (N–W–N) bonds. The enhancement in the intensity and shift to 3151 cm−1 in W/GCN-0.2 against the corresponding GCN peak was observed due to the interaction of W with the free N–H bonds. The N–W–N interactions could create more active sites on the surface of W/GCN-0.2 nanoflakes as compared to active sites on the surface of GCN. These factors supported the W in the typical GCN, which could result in the higher catalytic performance of W/GCN-0.2.
O bonds of CO2 molecules. GCN absorption bands at 1232 cm−1, 1315 cm−1, 1400 cm−1, 1456 cm−1, 1547 cm−1, and 1638 cm−1 was related to common stretching vibrations of CN heterocyclic groups. The absorption band of GCN at 804 cm−1 in the fingerprint region was attributed to the breathing vibrations of s-triazine units. For W/GCN-0.2, intensities of GCN peaks were enhanced. The enhancement in the intensity of 804 cm−1 peaks in W/GCN-0.2 as compared to the GCN peak was resulted because of the partial overlapping bands of W (N–W–N) bonds. The enhancement in the intensity and shift to 3151 cm−1 in W/GCN-0.2 against the corresponding GCN peak was observed due to the interaction of W with the free N–H bonds. The N–W–N interactions could create more active sites on the surface of W/GCN-0.2 nanoflakes as compared to active sites on the surface of GCN. These factors supported the W in the typical GCN, which could result in the higher catalytic performance of W/GCN-0.2.
UV-Vis DRS spectra of GCN and W/GCN-0.2 are shown in Fig. 3. W/GCN-0.2 spectra show a blue shift from 472 to 465 nm on the absorption edge value of GCN. This variation in absorbance edge of GCN upon W doping was assigned to repulsive interaction of 5d orbitals of W and 2p orbitals of nitrogen in W/GCN-02. Band gaps (1240/absorption wavelength) of GCN and W/GCN-0.2 were calculated as 2.62 and 2.67 eV, respectively. The inset of Fig. 3 shows the highest bandgap of W/GCN-0.2 because of the small size of nanosheets in W/GCN-0.2. The GCN bandgap tuning by W showed metal coordination with a π-conjugated network of GCN, that could facilitate charge transfer in the CN heterocyclic unit.
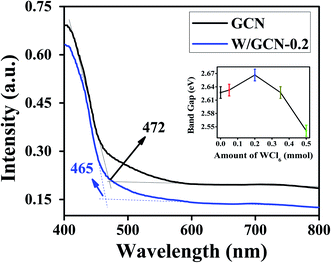 | ||
| Fig. 3 UV-Vis DRS spectra of GCN and W/GCN-0.2. The inset image showed varying bandgap with an increase in W quantity in W/GCN. | ||
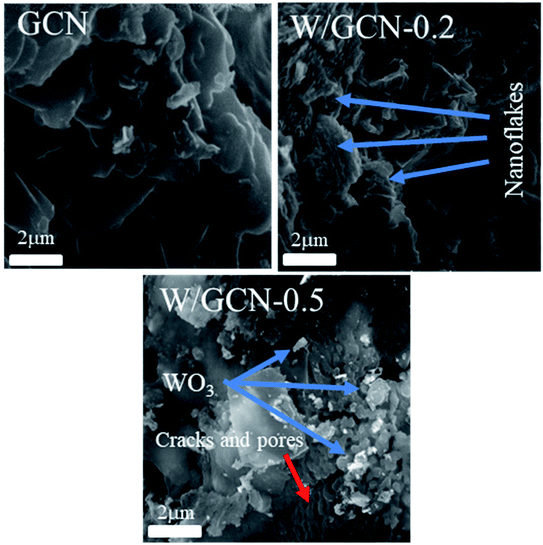
SEM images of prepared GCN, W/GCN-0.2, and W/GCN-0.5 samples are shown in Fig. 4. SEM image of W/GCN-0.2 shows the effect of W concentrations on the structural morphology of the GCN. SEM image of GCN showed a typical lamellar morphology of crystalline, and large-sized irregular flakes, which were formed because of aggregation of GCN nanosheets. Because of W loading in GCN, large-sized nanosheets of GCN were changed to small-sized nanosheets, which looked like nanoflakes, as shown in the SEM image of W/GCN-0.2. The structure of GCN was changed to multiple cracks, pores, and irregular-shaped WO3 nanoparticles aggregation were occurred at a high dopant amount, as shown in the SEM image of W/GCN-0.5. These changes in structural properties of GCN have confirmed the incorporation of W in GCN, which in return could tune the optical and electronic properties of W/GCN.
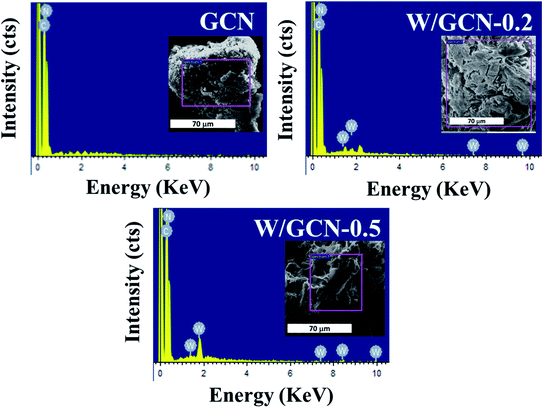
EDX images of GCN and W/GCN are presented in Fig. 5. EDX image of GCN showed peaks corresponding to C and N atoms only. In contrast, EDX images of W/GCN-0.2 and W/GCN-0.5 showed peaks corresponding to W, C, and N atoms.
EDX composition analysis of GCN, W/GCN-0.2, and W/GCN-0.5 is shown in Table 1. The GCN and W doped GCN showed high purity in the samples. A much lower atomic C/N ratio of pure GCN (0.54) and W/GCN-0.2 (0.58) than theoretical value (0.75) was considered because of occurring many uncondensed and residual amine groups on the surface.
| Samples | C (wt%) | N (wt%) | W (wt%) | C/N ratio (at%) |
|---|---|---|---|---|
| GCN | 32 | 68 | — | 0.54 |
| W/GCN-0.2 | 33 | 66 | 0.27 | 0.58 |
| W/GCN-0.5 | 36 | 61 | 3 | 0.70 |
The structural distortion of GCN by dopant was established by Raman analysis. Raman spectra of GCN and W/GCN-0.2 are shown in Fig. 6. The defective-band (D-band) and graphitic-band (G-band) of GCN and W/GCN-0.2 are labelled in Fig. 6. The relative intensity (ID/IG) ratios of GCN and W/GCN-0.2 were calculated as 0.59 and 1.31, respectively. A higher ID/IG ratio of W/GCN-0.2 against the ID/IG ratio of GCN was assigned to the presence of more structural distortion in W/GCN-0.2. Such structural defects could result in a high electron transferability of W/GCN-0.2 as compared to that of the GCN. The high electron transferability could help in enhancing the catalytic activities of W/GCN-0.2.
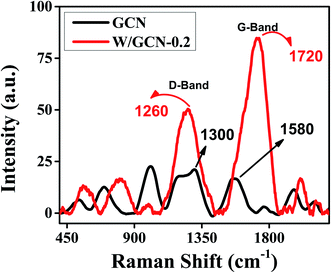 | ||
| Fig. 6 Raman spectra of GCN and W/GCN-0.2. Raman spectra were recorded using an excitation laser of 457 nm. | ||
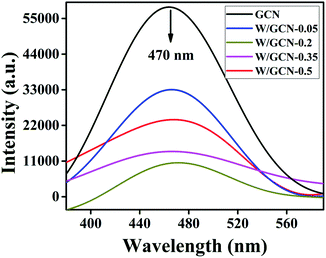
PL spectral analysis was used to find the separation efficiency of photogenerated charge carriers in the samples. PL spectra of GCN and W/GCN are shown in Fig. 7. Both GCN and W/GCN showed a PL emission peak at 470 nm. The W/GCN-0.2 showed the minimum PL emission intensity at 470 nm because of the optimal loading of W. The optimal loaded sample exhibited a high separation of charge carriers and crystal defects. These PL results strongly supported the electron–hole transfer between W and GCN in W/GCN-0.2. Because of electron–hole transfer between W and GCN, more holes were produced for the oxidation of RhB. Therefore, W doping could tune the electronic properties of GCN by increasing electronic-transferability and decreasing the recombination of the charge carriers.
3.2. Catalytic activities of GCN and W/GCN-0.2
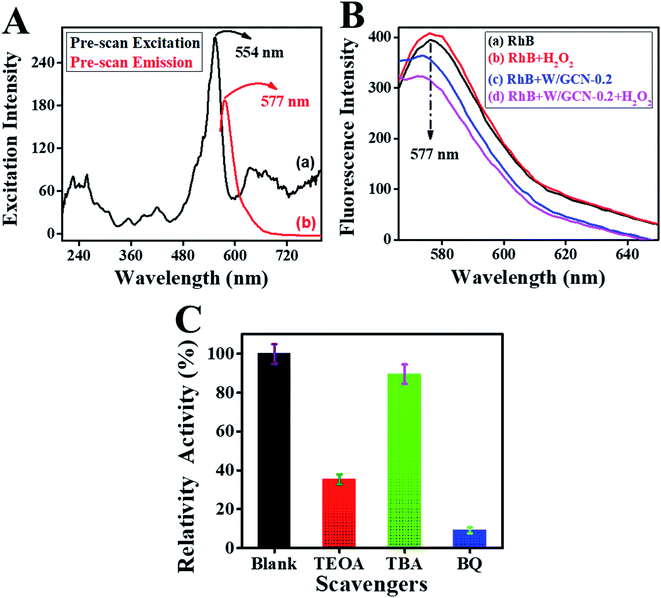
Catalytic activities of peroxidase catalyst were investigated by the detection of H2O2. Peroxidase mimic catalyst split H2O2 into radicals and ions because of intrinsic catalytic activities. The radicals were generated under the influence of peroxidase mimic catalyst, which could oxidize the chromogenic substrates such as RhB.13 Because of the above reaction, colorimetric and fluorescence emission intensities of RhB were quenched. These variations in emission intensities of RhB were used for the fluorescence and colorimetric H2O2 bioassays.14,15First, a pre-scan spectrum of the RhB probe was scanned under an excitation wavelength of 340 nm at room temperature, as shown in Fig. 8A. The curve (a) in the pre-scan of the RhB showed the absorbance peak at 554 nm, and curve (b) showed the fluorescence emission peak at 577 nm. Therefore, the fluorescence emission spectrum of reaction mixtures was scanned between 565 to 700 nm under an excitation-wavelength of 554 nm.
Second, the effect of different combinations among W/GCN-0.2, H2O2, and RhB on fluorescence emission of reaction mixtures was investigated, and resultant spectra are presented in Fig. 8B. The fluorescence emission of the RhB solution at 577 nm is shown in curve (a). The fluorescence intensity of this emission peak was enhanced in chromophore H2O2, as shown in curve (b). In contrast, it was quenched and shifted to the lower value of 574 nm in W/GCN-0.2 because of RhB dynamic absorption–desorption equilibrium at the surface of W/GCN-0.2 nanoflakes, as shown in curve (c). It can be seen in curve (d) that H2O2 in the reaction mixture of RhB and nanoflakes caused a further decrease in emission intensity. This decrease in fluorescence emission intensity was attributed to a redox reaction between H2O2 and RhB under the catalytic influence of nanoflakes. In brief, H2O2 split into radicals such as hydroxyl radicals (˙OH) and ions. The ˙OH radicals could oxidize RhB by the electron transfer through the nanoflakes. Because of the oxidation of RhB to a non-fluorescent product, RhB fluorescence emission intensity in the reaction mixture was decreased. This decrease in fluorescence intensity represented the catalytic activities of W/GCN-0.2. Following optimal reaction conditions were used to examine the catalytic activities of the prepared samples, the quantity of WCl6 in GCN = 0.2 mmol, [catalyst] = 56 μg mL−1, reaction time = 18 min, and [RhB] = 65 ng mL−1 at a fixed 500 nM of [H2O2]. For the convenience of the experimentation, experiments were performed at room temperature, and solutions were made in 10 mM PBS of pH 7.4.
3.3. Mechanism of RhB oxidation
Reactive species trapping experiments were carried out by using TBA, TEOA, and BQ as scavengers to explore the oxidative species. A comparison of catalytic activity of reaction mixture containing TBA, TEOA, and BQ with the catalytic activity of blank reaction-mixture is presented in Fig. 8C. It was noted that the relative activity of the reaction mixture of W/GCN-0.2, RhB, and H2O2 was suppressed in the presence of scavengers. This reduction in catalytic activities of the reaction mixtures due to the presence of scavengers was assigned to the decrease in the RhB oxidation. Most lowering in relative catalytic activity was observed for a reaction mixture containing TBA as a scavenger. TBA could impair ˙OH radicals in the reaction mixture of W/GCN-0.2, RhB, and H2O2. Relative catalytic activities of reaction mixtures containing TEOA as scavengers were slightly decreased but it was not much affected by BQ. These findings represented that holes and ˙OH radicals were the main active species produced during the reaction between RhB and H2O2 in the presence of W/GCN-0.2 as a catalyst. It was further thought that the unique structural and optical properties of the W/GCN-0.2 catalyst helped in improving H2O2 adsorption and an increase in the dissociation of H2O2 to ˙OH radicals. Also, energy transfer occurred between excited RhB molecules and W/GCN-0.2 catalyst. As a result of energy transfer between RhB and W/GCN-0.2, electron–hole pairs were generated in the catalyst. These electron–hole pairs in the W/GCN-0.2 catalyst could activate the H2O2. The excited electrons of W/GCN-0.2 could reduce H2O2 to ˙OH radicals. These generated radicals could also oxidize RhB dye. The reaction progress can be represented in equation form as follows:| RhB + visible light → RhB* |
| RhB* + W/GCN-0.2 → RhB + W/GCN-0.2 (e− + h+) |
| W/GCN-0.2 (h+) + H2O → ˙OH + H+ + W/GCN-0.2 |
| W/GCN-0.2 (e−) + H2O2 → ˙OH + OH− + W/GCN-0.2 |
| 2H+ + 2OH− → 2H2O |
| ˙OH + RhB → oxidized RhB |
| h+ + e− → (e− + h+) negligible recombination reaction |
3.4. Optimization of experimental conditions
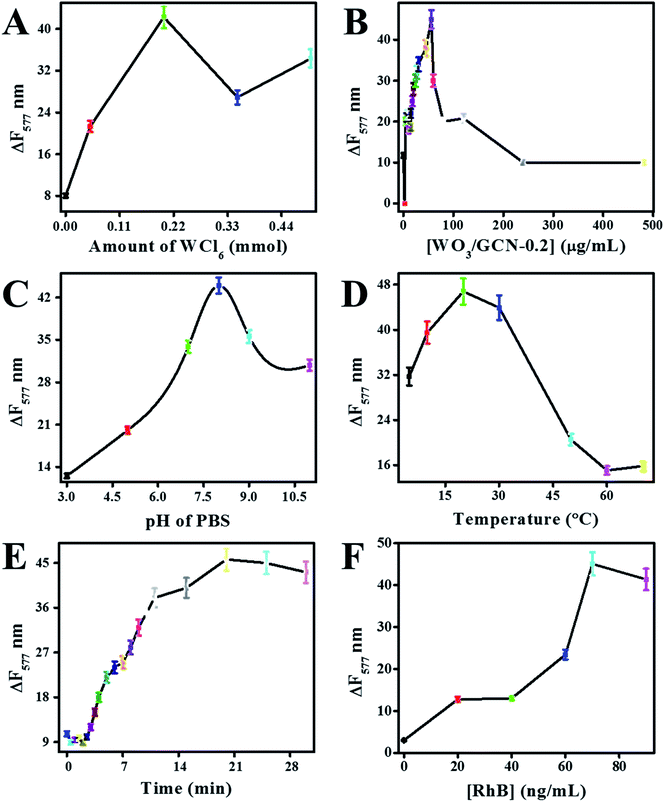
Electron transfer or donation through the graphitic framework depended upon the reaction conditions.6,16 Therefore, the effect of different reaction conditions on the catalytic performance of prepared nanomaterials were optimized at a constant concentration of H2O2. Fluorescence change (ΔF577) of reaction mixture represented the catalytic performance of the nanomaterials. The effect of different reaction conditions on ΔF577 was determined at 500 nM of the H2O2, and results are presented in Fig. 9.Catalytic performances of prepared GCN, W/GCN-0.05, W/GCN-0.2, W/GCN-0.35, and W/GCN-0.5 were evaluated. It can be seen in Fig. 9A that the maximal sensor performance was related to W/GCN-0.2. The high sensor performance for W/GCN-0.2 was correlated to excellent and unique electronic properties of W/GCN-0.2 like lower recombination rate of charge carriers and higher electron transfer rate. The high electron transferability in W/GCN-0.2 has resulted from the unique electronic coupling between W and GCN. The best catalytic activities of W/GCN-0.2 was because of the structural improvement, and the highest number of active sites in W/GCN-0.2. Thus, the optimization of the sensor parameter was carried out using catalytic active W/GCN-0.2 nanoflakes.
The effect of catalyst concentration on sensor performance was investigated by varying W/GCN-0.2 from 0 to 480 μg mL−1 in the reaction mixture. It can be seen from Fig. 9B that the sensor performance was improved by increasing the number of W/GCN-0.2 in the reaction mixture. The best sensor performance was observed at 56 μg mL−1 of W/GCN-0.2 in the reaction mixture. Therefore, 56 μg mL−1 of W/GCN-0.2 has achieved a maximal catalytic performance in the reaction mixture. This low quantity of W/GCN-0.2 catalyst could reduce the cost and increase the sensitivity of the assay. The sensor performance was decreased at higher W/GCN-0.2 concentrations because of the aggregation, generation of interaction forces, and the self-quenching of nanoflakes in the reaction mixture.
Sensor performance was also dependent upon the pH of the reaction mixture. It can be seen from Fig. 9C that the sensor performed least at low pH and the best performed at a pH of 8.0. The variation in sensor performance was attributed to active sites onto the surface of W/GCN-0.2 nanoflakes. The decrease in catalyst activities of W/GCN-0.2 in acidic pH was assigned to the protonation of active sites of amine groups in the reaction mixture.
The effect of reaction temperature on the catalytic property of W/GCN-0.2 was investigated from 10 °C to 70 °C. It can be seen from Fig. 9D that the best catalytic performance of W/GCN-0.2 was around 20 °C of the reaction temperature. The lower catalytic performance of W/GCN-0.2 at higher reaction temperature could be attributed to a lowering in electron transferability and conductivity of the W/GCN-0.2 semiconductor. The lowering of electron transferability of the semiconductor catalyst at a higher temperature generated less ˙OH radicals from H2O2 to oxidize RhB. Furthermore, an increase in RhB desorption phenomena at higher reaction temperatures could also lower the catalytic performance of W/GCN-0.2. The effect of reaction time on designed sensor performance was also investigated. It can be seen from Fig. 9E that the sensor response was the best at 18 min of reaction time, and a steady curve response at high reaction time.
Sensor performance was depended upon the RhB concentration in the reaction mixture. It can be seen from Fig. 9F that the sensor showed the best and constant performance at RhB concentration of 65 ng mL−1 in the reaction mixture. More addition of RhB, in the reaction mixture, suppressed the catalytic activities of W/GCN-0.2, and a decrease in sensor performance was observed. So, experimentations were carried out at room temperature with a reaction time of 18 min, 65 ng mL−1 of RhB concentration, and 56 μg mL−1 of W/GCN-0.2 catalyst in a pH of 7.4.
3.5. Detection of H2O2
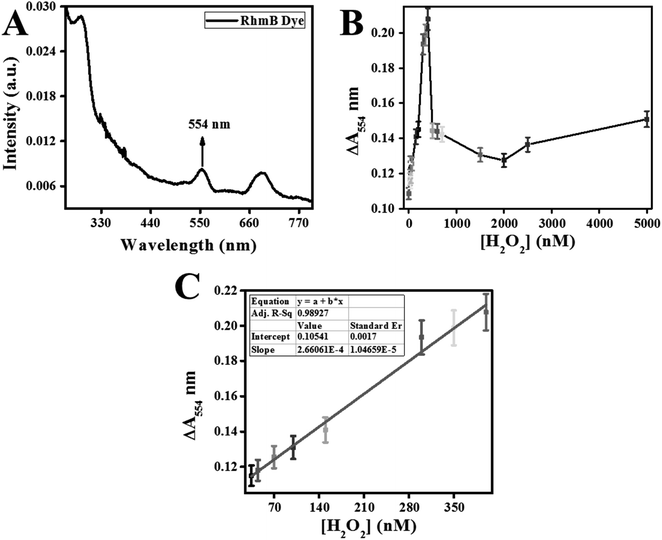
Classically, H2O2 concentrations were measured through the absorption reading at 240 nm or through peroxidase reaction with ferrous iron followed by monitoring with xylenol orange dye.17 Recently, a variety of advanced methods of nanomaterials are offered18 for high H2O2 detection demands in environmental study.The calibration curve for H2O2 detection is prepared and displayed in Fig. 10C. This method linear fitting curve exhibited a linear regression equation (ΔA554 = 2.66062 × 10⁻⁴[H2O2] + 0.10541) with R-square (R2) of 0.98927. The lower detection limit (LOD) and quantitation-limit (LOQ) were calculated using 3σ/K and 10σ/K. The K and σ represented the standard-error along the Y-axis and slope of the linear-regression-fitting curve. LOD and LOQ for H2O2 were calculated as 20 nM and 67 nM, respectively. This developed colorimetric sensors exhibited a linear range from 35–400 nM of H2O2 assay.
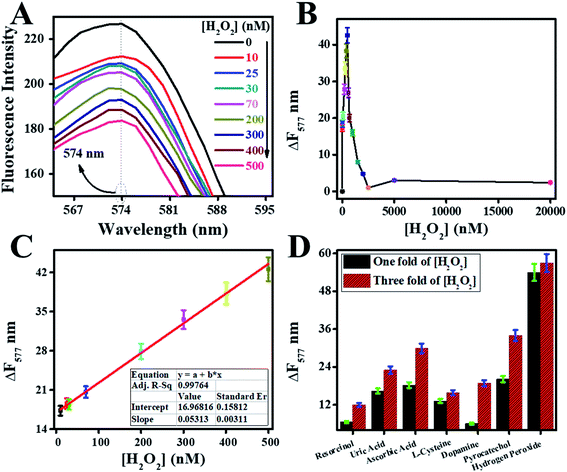
Fluorescence quenching relied on the efficiency of electron and energy transfer between reacting species. In RhB probe-based sensor, an electron and energy transfer happened between W/GCN-0.2 nanoflakes and H2O2 quenchers. To further explain these phenomena, a dose–response curve was plotted between the ΔF577 and from zero to 20![[thin space (1/6-em)]](https://www.rsc.org/images/entities/char_2009.gif) 000 nM of H2O2. It can be seen from the dose–response curve in Fig. 11B that the ΔF577 has increased up to 500 nM of H2O2. More H2O2 beyond 500 nM has decreased the ΔF577. The optimal H2O2 and the sensor saturation point was found at 500 nM of H2O2. A decrease in ΔF577 at high concentrations of H2O2 showed the hindrance in the catalytic performance of W/GCN-0.2 nanoflakes in the reaction mixture.
000 nM of H2O2. It can be seen from the dose–response curve in Fig. 11B that the ΔF577 has increased up to 500 nM of H2O2. More H2O2 beyond 500 nM has decreased the ΔF577. The optimal H2O2 and the sensor saturation point was found at 500 nM of H2O2. A decrease in ΔF577 at high concentrations of H2O2 showed the hindrance in the catalytic performance of W/GCN-0.2 nanoflakes in the reaction mixture.
A standard curve was plotted for different H2O2 concentrations by carrying out a series of fluorescence reactions under the optimal conditions, and final graphs are displayed in Fig. 11C. The standard curve was remained linear from 10 to 500 nM for H2O2. The linear-fitting regression equation of the standard curve was determined as ΔF577 = 0.05313[H2O2] + 16.96816 with a correlation coefficient of R2 = 0.99764. LOD and LOQ for H2O2 were calculated as 8 nM and 29 nM, respectively.
The lower LOD of the fluorescence quenching method represented its higher sensitivity as compared to the colorimetric method of H2O2 assays. Therefore, W/GCN-0.2 worked as an excellent catalyst for the fluorescence quenching of RhB by H2O2 because of W/GCN-0.2 excellent catalytic performance in H2O2 assays. Performance comparison of different fluorescence probes with this work for H2O2 detection is presented in Table 2.
| Materials | Linear range | LOD (nM) | Ref. |
|---|---|---|---|
| W/GCN-0.2 | 10–500 nM | 8 | Present work |
| Iridium silver NPs | 0–17 μM | 300 | 20 |
| Glutathione–graphene quantum dots | 0.5–10 μM | 134 | 21 |
| Iron-tetra sulfonate phthalocyanine | 0.02–2 μM | 3.7 | 22 |
| C-dots | 0.5–100 μM | 195 | 23 |
| Fe3O4 nanoparticles | 10–200 nM | 5.8 | 19 |
| Cds–Ag2S quantum dots | 0.001–10 mM | 300 | 24 |
| Chitosan-6-cyclodextrin-RhB-catalase enzyme | 0.3–20 mM | 10 | 25 |
| Cu nanoclusters/ZIF-8 nanocomposite | 10–1500 nM | 10 | 26 |
It can be seen from Table 2 that the W/GCN-0.2 based sensor was less-toxic, and sensor sensitivity was comparable with the reported H2O2 systems. Hence, the improvements in properties of GCN by W doping was helpful to get high sensing and high-performance catalyst for fluorescence quenching of organic dye through H2O2 reduction.
The selectivity of the developed sensor was determined by using different interfering species. The effect of interfering species like resorcinol, uric acid, ascorbic acid, L-cysteine, dopamine, pyrocatechol, and the ionic species (Ca++, K+, Cl1−, and Na++) on the sensor performance was determined and displayed as a bar chart graph in Fig. 11D. The sensor performance was remained selective for the H2O2 in the presence of interfering species; even the concentrations were increased up to three-fold of H2O2. The better interaction of H2O2 with W/GCN-0.2 has led to a selective determination of H2O2 in the interfering species, which could extend sensor applications in real life.
4. Conclusion
In summary, a series of tungsten doped graphitic carbon nitride nanostructures were prepared using melamine, and tungsten chloride as precursors through the calcination method. The as-prepared tungsten doped graphite carbon nitride samples were characterized through XRD, SEM, EDX, FTIR, UV-Vis DRS, Raman, and PL spectroscopy. Characterization results showed that doping of tungsten in GCN improved its physical and chemical characteristics by changing its morphology, such as catalytic surface enhancement by defect creation, optical and electronic properties, including separation of charge carriers, electron transferability, and conductivity. The as-synthesized nanoflakes of tungsten doped GCN were used in the detection of hydrogen peroxide through fluorescence quenching and colorimetric methods. In the presence of W/GCN catalyst, RhB and H2O2 were reacted and the optical response of RhB in the reaction mixture was decreased, which was the basis for the development of a fluorescence quenching assay for H2O2. W/GCN-0.2 nanoflakes have shown the highest catalytic activities for the H2O2 determination by oxidation of RhB. The RhB fluorescence quenching sensor has shown a lower LOD (8 nM) and a wide linear range (10–500 nM) as compared to the colorimetric sensor. The peroxidase-mimics activity of W/GCN-0.2 nanoflakes has shown several advantages over natural enzymes such as low cost, fast response, facile preparation, and high stability, which might be allowed this nanomaterial to be used as an enzyme-free peroxidase-mimics and an efficient catalyst for other potential applications in environmental, biomedical, biotechnology and medical diagnostic areas.Funding sources
This work is supported by the Pakistan Science Foundation, Pakistan through its PSF-NSFC funded project (Project No. PSF/NSFC-II/Eng/P-COMSATS-Lhr (07)), and The World Academy of Sciences through COMSTECH-TWAS Joint Research Grants Programme having reference number 17-224 RG/MSN/AS_C – FR3240300073.Author contributions
Aftab Ahmed: conceptualization, data curation, formal analysis, writing – original draft. Muhammad Nasir: conceptualization, supervision, validation, project administration, resources, writing – review & editing, funding acquisition. Akhtar Hayat: conceptualization, writing – review & editing. Mian Hasnain Nawaz: writing – review & editing. Aqif Anwar Chaudhry: writing – review & editing, Peter John: supervision, writing – review & editing.Conflicts of interest
Authors declare no competing financial interest.Acknowledgements
Aftab Ahmed thanks Interdisciplinary Research Centre in Biomedical Materials (IRCBM), COMSATS University Islamabad, Lahore Campus to allow him to use research facilities and acknowledges the efforts of his seniors and colleagues in guiding him to complete his research work.References
- C. J. Tredwin, S. Naik, N. J. Lewis and C. B. E. C. Scully, Hydrogen peroxide tooth-whitening (bleaching) products: review of adverse effects and safety issues, Br. Dent. J., 2006, 200, 371–376 CrossRef CAS
.
- B. Halliwell, M. V. Clement and L. H. Long, Hydrogen peroxide in the human body, FEBS Lett., 2000, 486, 10–13 Search PubMed
.
- J. Wu, X. Wang, Q. Wang, Z. Lou, S. Li, Y. Zhu, L. Qin and H. Wei, Nanomaterials with enzyme-like characteristics (nanozymes): next-generation artificial enzymes (II), Chem. Soc. Rev., 2019, 48, 1004–1076 RSC
.
- H. Wei and E. Wang, Nanomaterials with enzyme-like characteristics (nanozymes): next-generation artificial enzymes, Chem. Soc. Rev., 2013, 42, 6060–6093 RSC
.
- M. Inagaki, T. Tsumura, T. Kinumoto and M. Toyoda, Graphitic carbon nitrides (g-C3N4) with comparative discussion to carbon materials, Carbon, 2019, 141, 580–607 CrossRef CAS
.
- S. Yin, J. Han, T. Zhou and R. Xu, Recent progress in g-C3N4 based low cost photocatalytic system: activity enhancement and emerging applications, Catal. Sci. Technol., 2015, 5, 5048–5061 RSC
.
- L. Ge, C. Han and J. Liu, Novel visible light-induced g-C3N4/Bi2WO6 composite photocatalysts for efficient degradation of methyl orange, Appl. Catal., B, 2011, 108–109, 100–107 CrossRef CAS
.
- W. Zhu, N. Hao, J. Lu, Z. Dai, J. Qian, X. Yang and K. Wang, Highly active metal-free peroxidase mimics based on oxygen-doped carbon nitride by promoting electron transfer capacity, Chem. Commun., 2020, 56, 1409–1412 RSC
.
- A. Wang, C. Wang, L. Fu, W. Wong-Ng and Y. Lan, Recent Advances of Graphitic Carbon Nitride-Based Structures and Applications in Catalyst, Sensing, Imaging, and LEDs, Nano-Micro Lett., 2017, 9, 47 CrossRef
.
- P.-W. Chen, K. Li, Y.-X. Yu and W.-D. Zhang, Cobalt-doped graphitic carbon nitride photocatalysts with high activity for hydrogen evolution, Appl. Surf. Sci., 2017, 392, 608–615 CrossRef CAS
.
- G. Ding, W. Wang, T. Jiang, B. Han, H. Fan and G. Yang, Highly Selective Synthesis of Phenol from Benzene over a Vanadium-Doped Graphitic Carbon Nitride Catalyst, ChemCatChem, 2013, 5, 192–200 CrossRef CAS
.
- L. Cui, X. Ding, Y. Wang, H. Shi, L. Huang, Y. Zuo and S. Kang, Facile preparation of Z-scheme WO3/g-C3N4 composite photocatalyst with enhanced photocatalytic performance under visible light, Appl. Surf. Sci., 2017, 391, 202–210 CrossRef CAS
.
- A. Nsabimana, S. A. Kitte, F. Wu, L. Qi, Z. Liu, M. N. Zafar, R. Luque and G. Xu, Multifunctional magnetic Fe3O4/nitrogen-doped porous carbon nanocomposites for removal of dyes and sensing applications, Appl. Surf. Sci., 2019, 467–468, 89–97 CrossRef CAS
.
- A. S. Siddiqui, A. Hayat, M. H. Nawaz, M. A. Ahmad and M. Nasir, Effect of sulfur doping on graphene oxide towards amplified fluorescence quenching based ultrasensitive detection of hydrogen peroxide, Appl. Surf. Sci., 2020, 509, 144695 CrossRef CAS
.
- X. Chen, J. Zhang, X. Fu, M. Antonietti and X. Wang, Fe-g-C3N4-Catalyzed Oxidation of Benzene to Phenol Using Hydrogen Peroxide and Visible Light, J. Am. Chem. Soc., 2009, 131, 11658–11659 CrossRef CAS
.
- X. She, H. Xu, Y. Xu, J. Yan, J. Xia, L. Xu, Y. Song, Y. Jiang, Q. Zhang and H. Li, Exfoliated graphene-like carbon nitride in organic solvents: enhanced photocatalytic activity and highly selective and sensitive sensor for the detection of trace amounts of Cu2+, J. Mater. Chem. A, 2014, 2, 2563–2570 RSC
.
- R. Bou, R. Codony, A. Tres, E. A. Decker and F. Guardiola, Determination of hydroperoxides in foods and biological samples by the ferrous oxidation–xylenol orange method: a review of the factors that influence the method's performance, Anal. Biochem., 2008, 377, 1–15 CrossRef CAS
.
- A. S. Siddiqui, M. A. Ahmad, M. H. Nawaz, A. Hayat and M. Nasir, Nitrogen-doped graphene oxide as a catalyst for the oxidation of rhodamine B by hydrogen peroxide: application to a sensitive fluorometric assay for hydrogen peroxide, Microchim. Acta, 2019, 187, 47 CrossRef
.
- Z. Jiang, L. Kun, H. Ouyang, A. Liang and H. Jiang, A simple and sensitive fluorescence quenching method for the determination of H2O2 using rhodamine B and Fe3O4 nanocatalyst, J. Fluoresc., 2011, 21, 2015–2020 CrossRef CAS
.
- R. Tian, B. Zhang, M. Zhao, Q. Ma and Y. Qi, Polyoxometalates as promising enzyme mimics for the sensitive detection of hydrogen peroxide by fluorometric method, Talanta, 2018, 188, 332–338 CrossRef CAS
.
- Z. Qu, W. Na, Y. Nie, X. Su, Z. Qu, W. Na, Y. Nie and X. Su, A novel fluorimetric sensing strategy for highly sensitive detection of phytic acid and hydrogen peroxide, Anal. Chim. Acta, 2018, 1039, 74–81 CrossRef CAS
.
- X. Chen and J. Zou, Application of rhodamine B hydrazide as a new fluorogenic indicator in the highly sensitive determination of hydrogen peroxide and glucose based on the catalytic effect of iron(III)-tetrasulfonato-phthalocyanine, Microchim. Acta, 2006, 157, 133–138 CrossRef
.
- N. Li, S. G. Liu, J. X. Dong, Y. Z. Fan, Y. J. Ju, H. Q. Luo and N. B. Li, Using high-energy phosphate as energy-donor and nucleus growth-inhibitor to prepare carbon dots for hydrogen peroxide related biosensing, Sens. Actuators, B, 2018, 262, 780–788 CrossRef CAS
.
- L. Lin, Y. Wen, Y. Liang, N. Zhang and D. Xiao, Aqueous synthesis of Ag+ doped CdS quantum dots and its application in H2O2 sensing, Anal. Methods, 2013, 5, 457–464 RSC
.
- W. Dong, W. Li, Y. Chen, Y. Ye and S. Jin, Construction of a Fluorescent H2O2 Biosensor with Chitosan 6-OH Immobilized β-Cyclodextrin Derivatives, Mar. Drugs, 2017, 15, 284 CrossRef
.
- X. Hu, X. Liu, X. Zhang, H. Chai and Y. Huang, One-pot synthesis of the CuNCs/ZIF-8 nanocomposites for sensitively detecting H2O2 and screening of oxidase activity, Biosens. Bioelectron., 2018, 105, 65–70 CrossRef CAS
.
| This journal is © The Royal Society of Chemistry 2021 |

