 Open Access Article
A simple approach to prepare fluorescent molecularly imprinted nanoparticles†
Fenying Wang*a,
Dan Wanga,
Tingting Wangb,
Yu Jinb,
Baoping Ling cd,
Qianjin Li
 *b and
Jianlin Lib
aCollege of Chemistry, Nanchang University, Nanchang, Jiangxi 330031, China. E-mail: wangfenying@ncu.edu.cn
bDepartment of Food Science and Engineering, School of Food Science and Pharmaceutical Engineering, Nanjing Normal University, Nanjing 210023, China
cSchool of Chemistry and Chemical Engineering, Qufu Normal University, Qufu, Shandong 273165, China
dThe High Performance Computing Center, Qufu Normal University, Qufu, Shandong 273165, China
First published on 17th February 2021
Abstract
Fluorescent molecularly imprinted polymers (FMIPs) are gaining increasing attention in analytical and medical sciences, particularly silica-based FMIPs due to their low cost, environmentally friendly nature and good biocompatibility. However, at present, silica-based FMIPs are usually prepared through several steps and displayed low selectivity. Here, a simple approach was utilized for preparing silica-based FMIP nanoparticles. The polymerization was initiated by 3-aminopropyltriethoxysilane (APTES), which also acted as the functional monomer in the imprinting system; in addition, to achieve one-pot synthesis, a fluorescent monomer was prepared by a simple reaction between fluorescein isothiocyanate (FITC) and APTES. The as-synthesized FMIP nanoparticles displayed high specificity and fast response time (<1 min) towards the target molecule. Environmental pH and buffer salt could affect the specific recognition behaviors of the FMIP nanoparticles. Such a simple catalyst-free synthetic technique could also be employed for the preparation of FMIP nanoparticles targeting other acidic molecules.
1. Introduction
Molecularly Imprinted Polymer (MIP) is a kind of material having antibody-like recognition capability towards their targets because of the template-created cavities stabilized in the polymer networks; they are widely used in many areas e.g. analytical chemistry, medicine and environment,1–4 particularly fluorescent MIPs (FMIPs), because they can report the recognition events fast by fluorescence.5 Moreover, compared with fluorophore labelled biological antibodies, FMIPs are low-cost and flexible for fluorophore selection to meet the detection requirements.5–7 FMIPs have now been widely applied for specific recognition of small molecules, proteins, cells and microorganisms.8–10Several strategies have been used for the preparation of FMIPs: (1) creation of MIP recognition sites on fluorescent materials such as quantum dots, upconversion nanoparticles, and dyes or carbon dots embedded silica particles;11–14 (2) introduction of fluorescent molecules into MIPs by post-imprinting modifications, for example, grafting fluorophores after imprinting polymerization through the amino groups left in the MIPs;15–18 (3) one-pot polymerization by using polymerizable fluorescent monomers or crosslinkers.19–21 However, these strategies either required a complex preparation process or significant efforts to synthesize special monomers; moreover, almost all the polymerization processes needed initiators or catalysts, some of which could bring seriously negative effect on the imprinting efficiency.
Functional monomer is a key component for preparing highly selective MIPs. There are several ways to select a suitable functional monomer for target molecules, for instance, use of basic monomers for imprinting acidic molecules and vice versa22–24 or synthesis of well-designed functional monomers for target compounds.25 In principle, the functional monomer will form a stable complex with the template to create imprinted cavities, which can be used for specific recognition of target molecules. However, it was recently found by us that the presence of an initiator in the imprinting system would weaken the specificity of the imprinted cavities due to the adverse effect on the functional monomer–template complex,24 for example, in the silica sol–gel polymerization, the basic or acidic catalysts could break the complex formed based on hydrogen bonding interactions. In addition, the initiator often required a special solvent to dissolve into the pre-polymerization mixture, but the solvent might not be suitable to form a stable functional monomer–template complex,26 resulting in low specificity of the final imprinted polymers.
In this study, a simple and one-pot approach was developed to prepare FMIPs using the autocatalytic silica sol–gel polymerization strategy24 based on the self-catalytic polymerization capability of 3-aminopropyltriethoxysilane (APTES).27 Naproxen was selected as the target molecule as well as the template, which is one of the non-steroidal anti-inflammatory drugs for the treatment of rheumatoid arthritis and osteoarthritis, and also one of the pharmaceutical pollutants.28,29 To achieve the one-pot synthesis of FMIPs, a fluorescent silane monomer synthesized through a simple coupling reaction between fluorescein isothiocyanate (FITC) and APTES was introduced into the imprinting system. To the best of our knowledge, such a simple and catalyst-free approach was used for the first time for preparing FMIPs.
2. Results and discussion
2.1. Preparation of FMIP
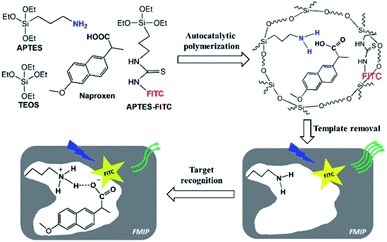
As shown in Fig. 1, in the imprinting polymerization mixture, APTES not only acted as the catalyst to initiate the silica sol–gel polymerization, but also acted as the functional monomer to interact with the template molecule through the hydrogen bonding interaction dated from the protonation between the carboxylic acid group in naproxen and the amino group in APTES, which was confirmed by the titration experiment (Fig. S1†) and theoretical calculation (Fig. S2†). The fluorescent silane monomer (FITC–APTES) was synthesized by a simple coupling reaction between FITC and APTES14 and introduced directly into the imprinting polymerization mixture without any purification process. After polymerization and template removal, specific recognition cavities complementary to the template would be left behind in the FMIPs. The FITC fluorophores would be randomly distributed in the polymer networks and assumed to be close to the cavities due to the hydrogen bonding interactions between naproxen and FITC fluorophore (Fig. S3†). Such hydrogen bonding interactions are much weaker (binding energies of 3.83–6.56 kcal mol−1) than the hydrogen bonding interaction between the functional monomer and naproxen (binding energies of −5.6 kcal mol−1, Fig. S2†), so the fluorophore will have little effect on the complex stability.Two FMIPs (FMIP1 and FMIP2) were synthesized with different amounts of FITC–APTES in the pre-polymerization mixtures, as well as their control polymers (FNIP1 and FNIP2, Table S1†). As shown in Fig. S4,† FMIP1 and FNIP1 were orange, while FMIP2 and FNIP2 were yellow, suggesting that the fluorescent monomer was grafted into both FMIPs and FNIPs successfully, and FMIP1 had more fluorophore groups than FMIP2 as expected. Utilization rates of the fluorescent monomer for FMIP1 and FMIP2 were measured be 87% and 97%, respectively, which were higher than that of their corresponding FNIPs (62% and 79% for FNIP1 and FNIP2), indicating that the presence of the template in the polymerization system seems to be beneficial to improve the polymerization efficiency of FITC–APTES. The amount of FITC fluorophore grafted into FMIP1 was calculated to be 87 μmol g−1, which was higher than that in FMIP2 (10 μmol g−1), in agreement with their visual colours (Fig. S4†).
2.2. Characterization
The polymers were characterized by IR spectroscopy (Fig. 2). Two characteristic signals at 2976 cm−1 and 880 cm−1 in the FMIPs before template removal could be attributed to the aliphatic CH stretching vibration and the aromatic CH bending vibration in naproxen, respectively. Both signals disappeared in the spectra of FMIPs after template removal, confirming that the template was indeed embedded into the polymers and could be removed by washing solution successfully. By comparing the IR spectra of FMIP1 and FMIP2 with their corresponding FNIPs, there is almost no difference, demonstrating that they have very similar polymer composition.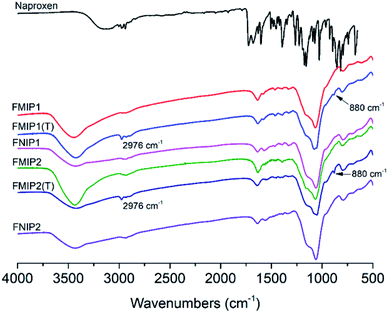 | ||
| Fig. 2 IR spectra of the template naproxen, FMIPs after (FMIP1 and FMIP2) and before (FMIP1(T) and FMIP2(T)) template removal, and FNIPs (FNIP1 and FNIP2). | ||
Morphologies of the polymers were characterized by the scanning electronic microscopy (SEM) technique. As shown in Fig. 3a, it can be clearly seen that both FMIP1 and FMIP2 are nanoparticles having rough surfaces, and FMIP1 looks bigger than FMIP2; however, their control polymers of FNIP1 and FNIP2 are spherical particles with smooth surface and display two kinds of particle sizes, which are bigger than their corresponding MIPs. The morphological differences between the MIPs and NIPs further demonstrate that the template did affect the polymerization, and the imprinting strategy should work. FMIP1 and FMIP2 were further analyzed in pure water by dynamic light scattering (DLS) to study their particle size distributions (Fig. 3b). Both FMIP1 and FMIP2 showed narrow particle size distributions, showing average particle diameter sizes of 326 nm and 285 nm, respectively, and demonstrates that FMIP1 is bigger than FMIP2, which is in agreement with the result from their SEM images. However, from the SEM images of FMIPs, we can see that the diameter sizes of both FMIP1 and FMIP2 should be less than 100 nm, which is much smaller than that measured by DLS; as the nanoparticles in water solution would be surrounded by hydration layers, the tested diameter size became larger than that measured in dry status by the SEM technique.6
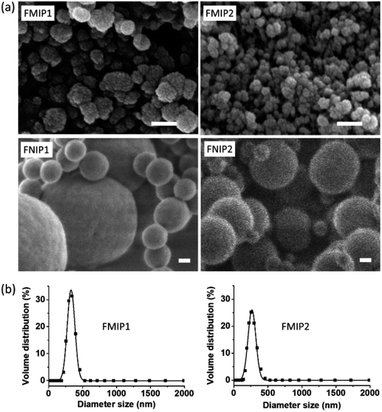 | ||
| Fig. 3 (a) SEM images of FMIP1, FMIP2, FNIP1 and FNIP2 (scale length is 100 nm). (b) Particle size distributions of FMIP1 and FMIP2 were measured by DLS method in pure water. | ||
In addition, the surface area, pore volume and pore size of the polymers were measured by the nitrogen adsorption experiment using BET method (Fig. S5 and Table S2†). The surface area of FMIP1 (165 m2 g−1) and FMIP2 (99 m2 g−1) were larger than that of FNIP1 (118 m2 g−1) and FNIP2 (48 m2 g−1), respectively, demonstrating that the FMIPs had larger surface area than their corresponding FNIPs, which could be attributed to the template creating cavities in the FMIPs. The average pore diameters of FMIP1, FNIP1, FMIP2 and FNIP2 were measured to be 6.1 nm, 5.4 nm, 10.0 nm and 5.6 nm, respectively; it can be evidently seen that the pore size of the FMIPs is bigger than that of their corresponding FNIPs, which might be also due to the existence of the imprinted cavities in the FMIPs.
2.3. Specificity evaluation
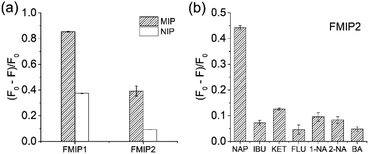
To investigate the specificity of the FMIPs, their fluorescence response to the template naproxen were first measured. As shown in Fig. 4a, it can be seen that both FMIP1 and FMIP2 exhibited higher fluorescence response than their corresponding FNIPs, which is in agreement with their binding measurements (Fig. S6†), demonstrating that they have good selectivity. Particularly FMIP2 displayed a higher imprinting factor of 3.7 than FMIP1 with an imprinting factor of 2.3, so FMIP2 was selected to perform the following tests. Then, the analogues of naproxen (pKa = 4.15) with similar pKa values including ibuprofen (pKa = 4.85), ketoprofen (pKa = 3.88), flurbiprofen (pKa = 4.42), 1-naphthylacetic acid (pKa = 4.30), 2-naphthylacetic acid (pKa = 4.26) and benzoic acid (pKa = 4.19) were selected and used as the test molecules to evaluate the cross-selectivity of FMIP2.33 From Fig. 4b, FMIP2 showed higher fluorescence response to naproxen than to its analogues, demonstrating its excellent specific recognition capability.2.4. Fluorescence response features
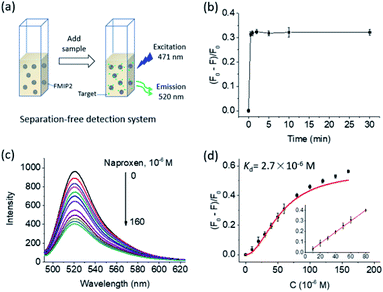
A separation-free detection system was established to further study the fluorescence responsive features of FMIP2 to naproxen (Fig. 5a). At first, its time-dependent fluorescence response to naproxen was measured. As shown in Fig. 5b, it is obvious to see that FMIP2 displayed a very short response time (less than 1 min), demonstrating that specific recognition events could be rapidly reported by FMIP2. Such rapid fluorescence response feature of the FMIP nanoparticles gave great opportunities to develop fast detection methods and real-time detection techniques by immobilizing them on a solid substrate.Then, dose-fluorescence response behaviour of FMIP2 to naproxen was tested (Fig. 5c). When naproxen concentration was increased in the FMIP2 suspension, the system fluorescence intensity decreased, displaying a good linear range of 10–80 μM and a detection limit of 2 μM (Fig. 5d) comparable to the reported fluorescence spectrometry method that showed a linear range of 2–87 μM and a detection limit of 0.5 μM (ref. 34) (the detection limit was calculated as three times of signal/noise ratio). However, the detection sensitivity was lower than the electrochemical method35 and quartz crystal microbalance method;36 some efforts are still needed to improve the sensitivity of the FMIPs e.g. using a more sensitive fluorescent molecule instead of FITC. In addition, the dissociation constant (Kd) of FMIP2 to naproxen37 was calculated to be 2.7 × 10⁻⁶ M (Fig. 5d), which is four orders of magnitude lower than that of the functional monomer to naproxen (2.2 × 10⁻² M, Fig. S1†), demonstrating that FMIP2 had an extremely stronger binding affinity to naproxen than the free functional monomer. This was because the nanoconfinement effect in the template created nanocavities,38,39 confirming the developed autocatalytic polymerization approach for preparing FMIPs was successful.
The potential applicability of the separation-free detection system based on FMIP2 nanoparticles was investigated through the measurement of the naproxen spiked into tap water. It showed that the aqueous samples spiked with naproxen of 25 and 50 μM were determined to be 22 ± 3 and 38 ± 6 μM, respectively, giving corresponding recovery rates of 86% and 77%, which indicates its application prospects for naproxen detection.
2.5. pH effect
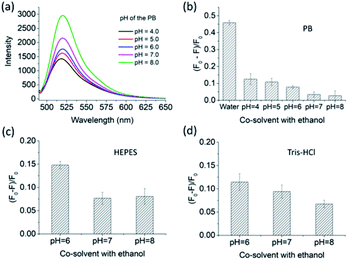
Three conventional buffers with different pH values were used for studying the pH effect on the recognition capability of FMIP2 to naproxen. From Fig. 6a, it is clearly seen that the fluorescence intensity of FMIP2 increased as the pH increased, which is in agreement with the reported FITC-modified materials.40–43 Under high pH environment, the hydrogen bonding interaction resulting from the protonation between the amino group in the imprinted cavities and the carboxylic group in naproxen would be eliminated, thus naproxen could become hard to capture by the imprinted cavities, resulting in a weak fluorescence response of FMIP2 to naproxen (Fig. 6b). However, even under the pH environment of 4, the fluorescence response of FMIPs to naproxen was still much weaker than that in the water/ethanol co-solvent, demonstrating that the phosphate salt could compete with naproxen to interact with the amino groups in FMIP2, resulting in a weak fluorescence response to naproxen. The same phenomena were also observed in HEPES and Tris–HCl buffers (Fig. 6c and d), respectively, further demonstrating that the anions in the buffer could hamper the interaction between naproxen and the amino groups in FMIP2; therefore, in the co-solvent of water/ethanol (pH 7), in which there is no anion, FMIP2 gave a much higher fluorescence response to naproxen.3. Conclusions
In this study, a simple and catalyst-free synthetic approach was developed successfully for preparing FMIP nanoparticles. In the imprinting system, APTES acted as both a catalyst and a functional monomer, as well as a fluorophore carrier; no extra catalysts were required. The resulting FMIP nanoparticles could be employed to establish the separation-free detection system, which displayed high specificity and fast response time (less than 1 min) to the target molecule naproxen. In the imprinted cavities, the functional amino group could bind naproxen through the hydrogen bonding interaction, which could be affected by the environmental pH and the buffer salt.4. Experimental
4.1. Chemicals and equipment
3-Aminopropyltriethoxysilane (99%, APTES) and tetraethoxysilane (99%, TEOS) were bought from Shanghai Aladdin Bio-Chem Technology Co., LTD (Shanghai, China). Ethanol (99.7%) was purchased from Tianjin Damao Chemical Reagent Factory (Tianjin, China). (S)-Naproxen (98%, NAP) was bought from J&K Scientific, LTD (Shanghai, China). 1-Naphthaleneacetic acid (99%, 1-NA), 2-naphthaleneacetic acid (99%, 2-NA), benzoic acid (99%, BA), fluorescein isothiocyanate (97%, FITC), (S)-ibuprofen (98%, IBU), (R,S)-ketoprofen (98%, KET), and (R,S)-flurbiprofen (98%, FLU) were bought from Shanghai Macklin Biochemical Technology Co., Ltd (Shanghai, China). All other chemicals were of analytical grade.Fluorescence tests were carried out on a F97Pro fluorescence spectrophotometer (Shanghai Jingmi, China). UV measurements were performed on a UV765 spectrophotometer (Shanghai Youke, China). IR spectra were recorded on a FTIR-Tensor27 spectrophotometer (Bruker, Germany). Scanning Electron Microscopy (SEM) images were taken on a JEOL JSM-6701F field emission scanning electron microscope (Tokyo, Japan). Particle size distribution was measured by dynamic light scattering (DLS) method on a Zetasizer Nano ZS90 instrument in pure water (Malvern Instruments Ltd., Worcestershire, UK).
4.2. Synthesis of FITC–APTES
The fluorescent monomer FITC–APTES was synthesized according to the literature with some modifications.14 At first, FITC (16 mg, 0.04 mmol) was dissolved in 8 mL pure ethanol by stirring at room temperature, its colour was purple; then, APTES (9.3 μL, 0.04 mmol) was added, and the purple colour of the solution changed to bright yellow quickly. After reacting for 24 h, the solvent was removed under vacuum evaporation. The product was a thick yellow liquid and not further purified.4.3. Preparation of FMIP nanoparticles
The template naproxen (23 mg, 0.1 mmol) was first added into the co-solvent of water/ethanol (8 mL/3 mL) under magnetic stirring; then, APTES (71 μL, 0.3 mmol) was introduced into the mixture and stirred for 30 min; later, the fluorescent functional monomer of FITC–APTES (20 mmol L−1 or 2 mmol L−1, 0.5 mL) in ethanol was added into the mixture, which was stirred for another 30 min at room temperature; finally, TEOS (222 μL, 1.0 mmol) dissolved in 0.5 mL ethanol was introduced into the mixture dropwise. The sol–gel polymerization mixture was stirred at room temperature for 48 h. Particles were collected by centrifugation at 10![[thin space (1/6-em)]](https://www.rsc.org/images/entities/char_2009.gif) 000 rpm for 5 min and washed by ethanol to remove the unreacted chemicals. The template in the FMIPs was removed using the phosphate buffer (50 mM, pH 8.5). After template removal, the FMIPs were washed with pure water and methanol three times separately before drying. Fluorescent non-imprinted polymers (FNIPs) were prepared under the same conditions as their FMIPs in the absence of the template.
000 rpm for 5 min and washed by ethanol to remove the unreacted chemicals. The template in the FMIPs was removed using the phosphate buffer (50 mM, pH 8.5). After template removal, the FMIPs were washed with pure water and methanol three times separately before drying. Fluorescent non-imprinted polymers (FNIPs) were prepared under the same conditions as their FMIPs in the absence of the template.
4.4. Binding measurement
Polymers (2 mg) and test molecules at certain concentrations were mixed in 2 mL solvent. After shaking for 12 h, the supernatant was obtained by centrifugation and measured using a UV spectrophotometer at the wavelength of 272 nm for both NAP and BA, 282 nm for 1-NA and 2-NA. The amount of the test molecules bound on the polymers could be calculated based on the molecule amount left in the supernatants. Each experiment was repeated independently three times.4.5. Computational details
All calculations were conducted by using density functional theory (DFT) method with the Gaussian 09 program.30 The geometry optimizations were performed with the M06-2x functional, and the 6-31G(d,p) basis set was used for all the atoms.31 Vibrational frequencies were computed at the same level of theory to obtain the free energy correction. The solvent effect was considered by a self-consistent reaction field (SCRF) using the SMD implicit solvent model,32 and ethanol or water was applied as the solvent separately. The free energy of the complex was calculated at the M06-2x/6-311++G(d,p) level. Each complex's energy was described by the Gibbs free energy in solution including the free energy correction from gas phase calculations, and the final energy was obtained by comparing the complex energy with the energy of reference state.4.6. Kinetic measurements
A suspension of the fluorescent particles (0.1 mg mL−1) was prepared in 2 mL solvent and its fluorescence intensity (F0) was measured at 520 nm using the excitation light of 471 nm. After adding naproxen to a final concentration of 50 μM, the mixture was stirred at certain interval times before the new fluorescence intensity (F) was measured. The experiment was repeated three times independently.4.7. Fluorescence response measurements
A suspension of the fluorescent particles (0.1 mg mL−1) was prepared in 2 mL solvent. The fluorescence spectrum of the suspension was measured using an excitation wavelength of 471 nm. After the addition of a concentrated naproxen solution, the mixture was stirred for 5 min before the new fluorescence spectrum was collected. Each experiment was repeated independently for three times.4.8. Detection of naproxen in tap water
Tap water spiked with naproxen of 1.0 mL was first mixed with 0.5 mL ethanol, then a FMIP suspension (0.4 mg mL−1) of 0.5 mL in the co-solvent of water/ethanol (2/1, v/v) was added. The sample was stirred for 10 min before measuring its fluorescence intensity at 520 nm using an excitation wavelength of 471 nm. Each experiment was repeated independently for three times.Author contributions
Fenying Wang: conceptualization, formal analysis, funding acquisition, writing – original draft; Dan Wang: investigation, validation; Tingting Wang, investigation; Yu Jin, investigation; Baoping Ling: methodology; Qianjin Li: methodology, writing – review &editing, funding acquisition; Jianlin Li, supervision.Conflicts of interest
There are no conflicts to declare.Acknowledgements
This work was supported by the National Natural Science Foundation of China (21705073 and 51406074).References
- L. Ye and K. Mosbach, Chem. Mater., 2008, 20, 859 CrossRef CAS.
- J. E. Lofgreen and G. A. Ozin, Chem. Soc. Rev., 2014, 43, 911 RSC.
- R. Schirhagl, Anal. Chem., 2014, 86, 250 CrossRef CAS.
- L. X. Chen, X. Y. Wang, W. H. Lu, X. Q. Wu and J. H. Li, Chem. Soc. Rev., 2016, 45, 2137 RSC.
- Q. Yang, J. H. Li, X. Y. Wang, H. L. Peng, H. Xiong and L. X. Chen, Biosens. Bioelectron., 2018, 112, 54 CrossRef CAS.
- Q. J. Li, T. Kamra and L. Ye, Chem. Commun., 2016, 52, 12237 RSC.
- J. H. Li, J. Q. Fu, Q. Yang, L. Y. Wang, X. Y. Wang and L. X. Chen, Analyst, 2018, 143, 3570 RSC.
- L. Ye, Anal. Bioanal. Chem., 2016, 408, 1727 CrossRef CAS.
- M. J. Whitcombe, I. Chianella, L. Larcombe, S. A. Piletsky, J. Noble, R. Porter and A. Horgan, Chem. Soc. Rev., 2011, 40, 1547 RSC.
- J. M. Pan, W. Chen, Y. Ma and G. Q. Pan, Chem. Soc. Rev., 2018, 47, 5574 RSC.
- C. Sulitzky, B. Ruckert, A. J. Hall, F. Lanza, K. Unger and B. Sellergren, Macromolecules, 2002, 35, 3314 CrossRef CAS.
- H. L. Liu, G. Z. Fang, H. D. Zhu, C. M. Li, C. C. Liu and S. Wang, Biosens. Bioelectron., 2013, 47, 127 CrossRef CAS.
- S. F. Xu and H. Z. Lu, Chem. Commun., 2015, 51, 3200 RSC.
- S. S. Wang, D. Y. Yin, W. J. Wang, X. J. Shen, J. J. Zhu, H. Y. Chen and Z. Liu, Sci. Rep., 2016, 6, 22757 CrossRef CAS.
- H. Sunayama, T. Ooya and T. Takeuchi, Chem. Commun., 2014, 50, 1347 RSC.
- Y. Suga, H. Sunayama, T. Ooya and T. Takeuchi, Chem. Commun., 2013, 49, 8450 RSC.
- Y. Mao, Y. Bao, D. X. Han, F. H. Li and L. Niu, Biosens. Bioelectron., 2012, 38, 55 CrossRef CAS.
- W. N. Ming, X. Y. Wang, W. H. Lu, Z. Zhang, X. L. Song, J. H. Li and L. X. Chen, Sens. Actuators, B, 2017, 238, 1309 CrossRef CAS.
- Q. J. Li, L. D. Jiang, T. Kamra and L. Ye, Polymer, 2018, 138, 352 CrossRef CAS.
- J. K. Awino and Y. Zhao, Chem. Commun., 2014, 50, 5752 RSC.
- L. K. Duan and Y. Zhao, Chem.–Asian J., 2020, 15, 1035 CrossRef CAS.
- K. Golker, G. D. Olsson and I. A. Nicholls, Eur. Polym. J., 2017, 92, 137 CrossRef CAS.
- R. L. Simon and D. A. Spivak, J. Chromatogr. B, 2004, 804, 203 CrossRef CAS.
- F. Y. Wang, B. P. Ling, Q. J. Li and R. Abouhany, RSC Adv., 2020, 10, 20368 RSC.
- Q. J. Li, B. P. Ling, L. D. Jiang and L. Ye, Chem. Eng. J., 2018, 350, 217 CrossRef CAS.
- M. Panagiotopoulou, S. Beyazit, S. Nestora, K. Haupt and B. T. S. Bui, Polymer, 2015, 66, 43 CrossRef CAS.
- L. X. Xu, F. Cui, J. J. Zhang, Y. J. Hao, Y. Wang and T. Y. Cui, Nanoscale, 2017, 9, 899 RSC.
- S. K. Khetan and T. J. Collins, Chem. Rev., 2007, 107, 2319 CrossRef CAS.
- S. E. Nissen, N. D. Yeomans, D. H. Solomon, T. F. Luscher, P. Libby, M. E. Husni, D. Y. Graham, J. S. Borer, L. M. Wisniewski, K. E. Wolski, Q. Q. Wang, V. Menon, F. Ruschitzka, M. Gaffney, B. Beckerman, M. F. Berger, W. H. Bao, A. M. Lincoff and P. T. Investigators, N. Engl. J. Med., 2016, 375, 2519 CrossRef CAS.
- M. J. Frisch, G. W. Trucks, H. B. Schlegel, G. E. Scuseria, M. A. Robb, J. R. Cheeseman, G. Scalmani, V. Barone, G. A. Petersson, H. Nakatsuji, X. Li, M. Caricato, A. Marenich, J. Bloino, B. G. Janesko, R. Gomperts, B. Mennucci, H. P. Hratchian, J. V. Ortiz, A. F. Izmaylov, J. L. Sonnenberg, D. Williams-Young, F. Ding, F. Lipparini, F. Egidi, J. Goings, B. Peng, A. Petrone, T. Henderson, D. Ranasinghe, V. G. Zakrzewski, J. Gao, N. Rega, G. Zheng, W. Liang, M. Hada, M. Ehara, K. Toyota, R. Fukuda, J. Hasegawa, M. Ishida, T. Nakajima, Y. Honda, O. Kitao, H. Nakai, T. Vreven, K. Throssell, J. A. Montgomery Jr, J. E. Peralta, F. Ogliaro, M. Bearpark, J. J. Heyd, E. Brothers, K. N. Kudin, V. N. Staroverov, T. Keith, R. Kobayashi, J. Normand, K. Raghavachari, A. Rendell, J. C. Burant, S. S. Iyengar, J. Tomasi, M. Cossi, J. M. Millam, M. Klene, C. Adamo, R. Cammi, J. W. Ochterski, R. L. Martin, K. Morokuma, O. Farkas, J. B. Foresman and D. J. Fox, Gaussian Inc., Wallingford CT, 2009 Search PubMed.
- Y. Zhao and D. G. Truhlar, Theor. Chem. Acc., 2008, 120, 215 Search PubMed.
- A. V. Marenich, C. J. Cramer and D. G. Truhlar, J. Phys. Chem. B, 2009, 113, 6378 CrossRef CAS.
- B. Petrie and D. Camacho-Munoz, Environ. Chem. Lett., 2021, 19, 43 CrossRef CAS.
- H. X. Lian, Y. L. Hu and G. K. Li, Talanta, 2013, 116, 460 CrossRef CAS.
- A. Afkhami, F. Kafrashi, M. Ahmadi and T. Madrakian, RSC Adv., 2015, 5, 58609 RSC.
- M. R. Eslami and N. Alizadeh, RSC Adv., 2016, 6, 9387 RSC.
- P. Thordarson, Chem. Soc. Rev., 2011, 40, 5922 RSC.
- Q. J. Li, X. Y. Tu, J. Ye, Z. J. Bie, X. D. Bi and Z. Liu, Chem. Sci., 2014, 5, 4065 RSC.
- Y. Chen, S. S. Wang, J. Ye, D. J. Li, Z. Liu and X. C. Wu, Nanoscale, 2014, 6, 9563 RSC.
- Y. L. Zhong, B. Song, X. B. Shen, D. X. Guo and Y. He, Chem. Commun., 2019, 55, 365 RSC.
- S. Das, P. K. S. Magut, S. L. de Rooy, F. Hasan and I. M. Warner, RSC Adv., 2013, 3, 21054 RSC.
- G. Ghini, C. Trono, A. Giannetti, G. L. Puleo, L. Luconi, J. Amadou, G. Giambastiani and F. Baldini, Sens. Actuators, B, 2013, 179, 163 CrossRef CAS.
- G. L. Li, B. Zhang, X. B. Song, Y. Xia, H. B. Yu, X. F. Zhang, Y. Xiao and Y. T. Song, Sens. Actuators, B, 2017, 253, 58 CrossRef CAS.
Footnote |
| † Electronic supplementary information (ESI) available. See DOI: 10.1039/d0ra10618f |
| This journal is © The Royal Society of Chemistry 2021 |

