 Open Access Article
Structural, microstructural and magnetic characterization of the β-CoTe nanophase synthesized by a novel mechanochemical method†
Marcelo Augusto Malaguttia,
Kelli de Fátima Ulbricha,
V. Z. C. Paesb,
J. Geshevb and
Carlos Eduardo Maduro de Campos *a
*a
aDepartamento de Física, Universidade Federal de Santa Catarina, 88040-970 Florianópolis, Brazil. E-mail: carlos.campos@ufsc.br
bInstituto de Física, Universidade Federal do Rio Grande do Sul, Porto Alegre 91501-970, Rio Grande do Sul, Brazil
First published on 26th January 2021
Abstract
This work reports an unprecedented mechanochemistry synthesis of β-CoTe and its systematic characterization through X-ray powder diffraction (XRPD), transmission electron microscopy (TEM), and magnetometry techniques. The mechanical alloying produced the desired material within 6 h along with minor impurities, showing good stabilization for higher milling times (15 h) and long-term storage. XRPD characterization employed the Rietveld profile fitting analysis with fundamental parameters analysis in a direct convolution approach, giving the material's structure and microstructure information. For the spherical shape, the diameter mass average of the crystallites furnished values around 13 nm with 1.1% of microstrain. The double-Voigt procedure also modeled a triaxial ellipsoid shape for the crystallite size and obtained a surface-weighted average value for its volume around 150 nm3. TEM images confirmed the nanometric size visually and showed the crystallites to aggregate in large particles hundreds of nanometers in size. Measuring hundreds of supposed crystallite sizes, we could achieve a numerical distribution of their sizes with an average of 16 nm. The magnetization analysis performed both experimentally and via numerical simulations showed that β-CoTe is predominantly superparamagnetic with a magnetic domain size compatible with the double-Voigt one.
1. Introduction
The search for transition metal chalcogenides (TMC) materials' synthesis methods has drawn considerable attention during the last decades due to their broad application in material science. Their chemical and physical properties, enhanced by nanometric scale fabrication, make them suitable for applications in several areas of science like catalysis1 (especially water electrocatalysis2), energy store and conversion,3 solar cells,4 and electronic devices.5 Among the different types of synthesis methods, mechanochemistry has been in the ascendant in this decade. In this approach, mechanical energy through milling (shocks and shear from grinding/milling tools) can facilitate chemical reactions. Also, mechanochemistry is recognized to be a “green” method as it does not use solvents and its syntheses are performed in a controlled atmosphere near room temperature. Beyond that, the experimental procedures are easy and straightforward: their techniques apply material grinding to reduce sample grain sizes and augment homogeneity, increasing chemical activation. These procedures have been explored since the beginnings of human existence6 and were shown to be of quite simple use until modern mechanical alloying techniques started to be developed in the 1960s.7 TMCs have been explored by this method in many recent reports as reviewed by Baláž et al.8TMC materials which have not been subject to mechanochemistry investigation include the Co–Te alloys, especially the β-CoTe phase (a hexagonal nickeline-type structure). Exploration of the phase diagram via mechanochemistry has not yet been reported and is our current objective for the 1![[thin space (1/6-em)]](https://www.rsc.org/images/entities/char_2009.gif) :
:![[thin space (1/6-em)]](https://www.rsc.org/images/entities/char_2009.gif) 1 stoichiometry. The calculation of the phase diagrams method (CALPHAD) has recently been used to perform its thermodynamic assessment using available experimental data in the literature9 from other synthesis methods. The β-CoTe phase and γ-CoTe2 phase (marcasite-type) are described in this diagram, although the 1
1 stoichiometry. The calculation of the phase diagrams method (CALPHAD) has recently been used to perform its thermodynamic assessment using available experimental data in the literature9 from other synthesis methods. The β-CoTe phase and γ-CoTe2 phase (marcasite-type) are described in this diagram, although the 1![[thin space (1/6-em)]](https://www.rsc.org/images/entities/char_2009.gif) :
:![[thin space (1/6-em)]](https://www.rsc.org/images/entities/char_2009.gif) 2 stoichiometry presents a polymorphism with the pyrite10 and BaSi2-type structures.11 The β-CoTe materials proved to have a homogeneity range from 55.4–64.2 at% Te at high temperatures, this wide range is explained by the Co vacancy defect mechanism, which adds another term for Co-vacancies' interactions in the grand partition function and corrects the phase diagram.12 All these phases present a eutectic solid–liquid phase transition at a temperature of about 1288 K.
2 stoichiometry presents a polymorphism with the pyrite10 and BaSi2-type structures.11 The β-CoTe materials proved to have a homogeneity range from 55.4–64.2 at% Te at high temperatures, this wide range is explained by the Co vacancy defect mechanism, which adds another term for Co-vacancies' interactions in the grand partition function and corrects the phase diagram.12 All these phases present a eutectic solid–liquid phase transition at a temperature of about 1288 K.
In the literature, the β-CoTe phases featured one of the lowest chemical shifts of the TMCs and the lowest effective-charge for Co. The inter- and intra-binding of Te–Te is short and furnished a low c/a ratio for the hexagonal cells.13 The Seebeck coefficient is negative, also presenting a Curie–Weiss-like behavior for magnetic susceptibility14,15 at high temperatures and hard ferrimagnetism at temperatures below 40 K. All these properties came from thermal synthesized materials,11,16 in almost perfect bulk single crystals.
Due to these properties, the β-CoTe phase produced by solvothermal routes has been applied for biomolecular detection devices and has detected uric acid and adenine in human purine, which can indicate symptoms of diseases like gout and Parkinson's when in excess.17 The properties which had the most influence were the good conductivity of these materials and the quantum confinement effect due to their size. Similar TMC materials, regarding their composition, have already been tested for biomolecular detection devices by this research group, examples are NiTe2 for morin detection18 and Ni3−xTe2 applied to dopamine and adrenaline detection,19 all produced via mechanochemistry. So, the exploration of β-CoTe for these applications could be possible in the future. The phase is also considered a semiconductor with a band gap equal to 2.05 eV, which made viable the photo-reduction process using this phase and visible light to convert carbon dioxide into methane, showing its applicability for air cleaning.20
Many techniques can produce better quality nanostructures but are often more complicated and high cost (e.g. exfoliation and ion milling21). Mechanochemistry, in this regard, offers a good alternative to lower production costs since it involves a single-step procedure (the milling) to react the initial reagents with a great difference in melting points, it does not use toxic catalytic materials as solvothermal routes do, and it can be easily scaled-up by bigger millers.8
For these reasons of applicability and ease of synthesis, a novel synthesis of the β-CoTe phase through a mechanochemistry route, produced in a single-step procedure, is reported in this article. Here, pure elementary powders of Co and Te were used as the reagents in high-energy ball milling at room temperature and in an Ar atmosphere. The characterization procedures employed were X-ray powder diffraction (XRPD) and transmission electron microscopy (TEM), together with magnetic characterization through hysteresis loops, field cooling (FC), and zero field cooling (ZFC) measurements. Rietveld analysis was employed for XRPD via a direct convolution approach, fitting the peak profile with a conventional fundamental parameter approach (FPA) to obtain structural and microstructural information about the nanomaterial. Also, a double-Voigt (DV)22 approach retrieved information about crystallite size (CS) anisotropy, showing an effective triaxial ellipsoidal modeling for the shape. All these analyses employed the total pattern analysis solution (TOPAS) software.23 TEM allowed the counting of the visualized crystallites, showing a number average crystallite distribution. Our magnetization analysis, both experimental and through numerical simulations, allowed the determination of certain ferromagnetic and superparamagnetic characteristics of our samples.
2. Experimental section
2.1. Synthesis
The reagents used in the synthesis were elementary micrometric powders: Co (Sigma-Aldrich, 99.9+% purity) and Te (Sigma-Aldrich 99.99% purity). These elements were mixed in a vial with 65 mL capacity in the atomic proportion of 1![[thin space (1/6-em)]](https://www.rsc.org/images/entities/char_2009.gif) :
:![[thin space (1/6-em)]](https://www.rsc.org/images/entities/char_2009.gif) 1, together with nine steel balls: three of 12.7 mm of diameter and six of 6.35 mm. The total mass used as the reagent was 3.1 g with a ball-to-powder ratio (BPR) equal to 10
1, together with nine steel balls: three of 12.7 mm of diameter and six of 6.35 mm. The total mass used as the reagent was 3.1 g with a ball-to-powder ratio (BPR) equal to 10![[thin space (1/6-em)]](https://www.rsc.org/images/entities/char_2009.gif) :
:![[thin space (1/6-em)]](https://www.rsc.org/images/entities/char_2009.gif) 1. The mechanochemical synthesis was performed in a High Energy Ball Mill SPEX 8000, using 1425 cycles a minute. All the preparation was realized in an Ar atmosphere to avoid oxidation. For every 3 h of milling time, about 0.100 mg of the material was fished out and stored in microtubes of 2 mL each for further characterization procedures. These are the standard parameters and procedures when dealing with TMCs in our lab, as can be seen in our recent publications,24–26 hence they are used for this synthesis as well.
1. The mechanochemical synthesis was performed in a High Energy Ball Mill SPEX 8000, using 1425 cycles a minute. All the preparation was realized in an Ar atmosphere to avoid oxidation. For every 3 h of milling time, about 0.100 mg of the material was fished out and stored in microtubes of 2 mL each for further characterization procedures. These are the standard parameters and procedures when dealing with TMCs in our lab, as can be seen in our recent publications,24–26 hence they are used for this synthesis as well.
A second batch was produced and confirmed the reproducibility of the synthesis. All the samples studied were stored from the day of their synthesis up to about 300 days (>10 months) in small plastic microtubes closed to the air and kept at room temperature (RT). The samples were regularly re-examined by XRPD and the results attested to their long-term storing stability.
2.2. Characterization
Five techniques were implemented for the materials characterization: XRPD, selected area electron diffraction (SAED), imaging by TEM, vibrating sample magnetometry (VSM), and the physical properties measurement system (PPMS). The conventional Rietveld method was used to perform XRPD data analysis with the DV approach in the TOPAS software.The Rietveld analysis was accomplished by the TOPAS suite of programs, starting from structure models obtained in the ICSD Database.27 The description of the background function used the Chebyshev 8th polynomial order. Lorentzian and Gaussian distributions modeled the phase peak profiles for CS and microstrain (MS), respectively. These functions were convoluted with the experimental and emission profiles achieved by the simple axial mode and the Holzer Kα and Kβ models,28 respectively, which were retrieved by fitting measurements of a LaB6 sample standard.29 A DV approach calculated the CS anisotropy with the triaxial ellipsoid modeling using the TOPAS macro in the ref. 22. Thermal dislocation parameters used isotropic models for all the atoms, keeping atomic coordinates fixed.
![[3 with combining macron]](https://www.rsc.org/images/entities/char_0033_0304.gif) m (ICSD 64998). The crystal information file (.cif) was inputted into TOPAS to refine the structure and to obtain the microstructural information. The crystal data of the sample milled for 15 h without a knife, using the FPA and the preceding space group furnished β-CoTe lattice parameters of a = b = 3.8949(2) Å and c = 5.3809(4) Å, a volume of 70.70(1) Å3, a calculated density of 8.7642(9) g cm−3, Rp and Rwp of 2.28% and 2.94% respectively, and a goodness of fit (GoF) of 1.80 from 1556 data points. The domain size mass average is 12.58(8) nm using a Lorentzian peak profile. The isotropic MS reached 1.1% (e0 = 0.2%), using a Gaussian peak profile and a Gaussian distribution for the deformations.
m (ICSD 64998). The crystal information file (.cif) was inputted into TOPAS to refine the structure and to obtain the microstructural information. The crystal data of the sample milled for 15 h without a knife, using the FPA and the preceding space group furnished β-CoTe lattice parameters of a = b = 3.8949(2) Å and c = 5.3809(4) Å, a volume of 70.70(1) Å3, a calculated density of 8.7642(9) g cm−3, Rp and Rwp of 2.28% and 2.94% respectively, and a goodness of fit (GoF) of 1.80 from 1556 data points. The domain size mass average is 12.58(8) nm using a Lorentzian peak profile. The isotropic MS reached 1.1% (e0 = 0.2%), using a Gaussian peak profile and a Gaussian distribution for the deformations.![[thin space (1/6-em)]](https://www.rsc.org/images/entities/char_2009.gif) 000 times and 100 kV of electron acceleration voltage. JEMS30 electron microscopy simulation software is responsible for the simulation of electron diffraction data using the refined structure obtained by Rietveld.
000 times and 100 kV of electron acceleration voltage. JEMS30 electron microscopy simulation software is responsible for the simulation of electron diffraction data using the refined structure obtained by Rietveld.3. Results and discussion
3.1. Structural and microstructural characterization
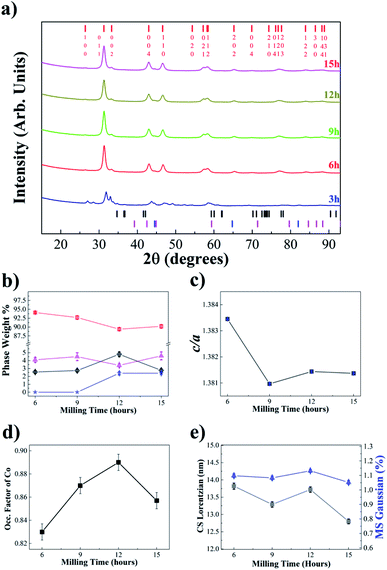
Fig. 1(a) shows the experimental XRPD patterns of the Co50Te50 samples obtained for different processing (milling) times. The majority phase corresponded to the β-CoTe accompanied by a tiny quantity of residuals of Co and CoO (unreacted materials) and Fe. Here one can observe that for 3 h of milling time, it is hard to identify any phase but after 6 h, β-CoTe peaks appeared and are notably the predominant phase in the material. Unfortunately, CoO presents a peak around 60° and Co appears near 45°, as seen in Fig. S1–S4 of the ESI.† Fe powder was detected after 12 h of milling and was caused by contamination from the collisions of the balls with themselves and the recipient walls, generating wear of the milling tools and introducing atoms of Fe into the powders. It is hard to quantify its correct phase percentage in the sample because of its crystallographic and chemical similarity with Co structures, although the profile fit is not well fit without adding it (Fig. S5†). For CoO, one can understand it to be related to air infiltration in the synthesis and its mixture with unreacted Co. Also, ref. 13 detected the presence of CoO by thermal synthesis, showing that it is not only a problem of this kind of synthesis. The presence of CoO is very insignificant, reaching 3% for the 15 h-milled sample.The α-TeO2 phase is also present in the initial granular Te reagent as observed in the XRPD measurements (Fig. S6†). The material was easily ground using a mortar and a pestle to increase the XRPD statistics, a process that could provoke a reaction with the air and cause this contamination. The presence of oxides in the initial reagents also could explain the existence of the CoO. The Te XRPD pattern did not present perfect statistics because of the nature of the material, so the quantification of absolute values obtained there could be imprecise, although α-TeO2 is present in the sample. Ref. 31 demonstrates that the oxidized reagents may form another composite with mechanical alloying but they do not alter the phase formation of the TMC alloy.
Information about the sample structure and microstructure was obtained through a conventional FPA fit of the diffractogram peaks, furnishing along with it the mass phase percentages evolution presented in Fig. 1(b). Regarding the β-CoTe phase XRPD peaks, no visual difference can be seen in the patterns over time, meaning that it was very stable after 6 h. Fig. 1(c) presents the close-packing ratio (CPR) for the hexagonal structure with milling time, which showed a decrease in the transition from 6 h to 9 h and that stability was reached after then. The occupation factor for the Co atom was refined, which reached values of 0.86 as shown in Fig. 1(d). Fig. 1(e) gives the evolution of the microstructural parameters of β-CoTe with milling time, showing that the average CS decreased a little with milling time and microstrain showed no significant variation, remaining at around 1.1% for milling times over 6 h. So, one can interpret that the physical mechanisms of milling (cold welding, fracturing, and rewelding) are not yet in a steady-state at 15 h of milling.
The β-CoTe phase obtained by mechanochemistry proved to be very stable for 200 days, as shown in Fig. S7.† The XRPD pattern did not change and the same goes for the structural and microstructural parameters, except for a very small variation of the parameters within 77 days, which could be attributed to the method of characterization itself.
The reproducibility of the β-CoTe nanophase synthesized by the novel mechanochemical method was confirmed by preparing a second batch, the XRD pattern of which is shown in Fig. S8.† The phases identified were the same as for the first batch with almost the same β-CoTe phase content and micro-structural parameters. The only difference observed was that the Fe and Co reflections were slightly more distinguishable when compared to the first batch.
Table 1 shows a comparison between this work and others regarding the unit cell results. Here, one can see that the CPR is low if compared to the ideal hexagonal structure (1.633), indicating that the crystal structure is composed of atoms more closely packed and loosely connected planes.13 All works cited present similar c/a values and ours do not diverge. According to M. Schur et al.,13 the shortest Te–Te distance has a value below the sum of two Te2− ionic radii, meaning bonding takes place with these chalcogenides which reduces the CPR.
| Work | Lattice parameter a (Å) | Lattice parameter c (Å) | Volume (Å3) | Close-packing ratio (c/a) |
|---|---|---|---|---|
| Ref. 20 | 3.75–3.88 | 5.35–5.99 | 69.05–72.41 | 1.384–1.606 |
| Ref. 13 | 3.893 | 5.371 | 70.49 | 1.380 |
| Ref. 14 | 3.874 | 5.375 | 69.86 | 1.387 |
| Ref. 15 | 3.85 | 5.131 | 65.86 | 1.33 |
| Ref. 11 | 3.888 | 5.378 | 70.41 | 1.383 |
| Ref. 16 | 3.890 | 5.373 | 70.41 | 1.381 |
| This work (15 h-sample) | 3.895 | 5.3809 | 70.70 | 1.381 |
Also, CoSe32 was synthesized using the same milling equipment and ball-to-powder ratio, in a different stoichiometry (3![[thin space (1/6-em)]](https://www.rsc.org/images/entities/char_2009.gif) :
:![[thin space (1/6-em)]](https://www.rsc.org/images/entities/char_2009.gif) 1), achieving the P63/mmc phase within 72 h of milling, presenting a c/a of 1.53, way higher than this work. Although no occupational factor is refined in this paper, the appearance of this phase for high milling times, in a completely different stoichiometry, can be justified by the high quantity of defects that mechanochemistry can introduce in the sample, thus augmenting the number of vacancies of the Co atoms so characteristic to form these kinds of TMC nickeline structures. With the 1
1), achieving the P63/mmc phase within 72 h of milling, presenting a c/a of 1.53, way higher than this work. Although no occupational factor is refined in this paper, the appearance of this phase for high milling times, in a completely different stoichiometry, can be justified by the high quantity of defects that mechanochemistry can introduce in the sample, thus augmenting the number of vacancies of the Co atoms so characteristic to form these kinds of TMC nickeline structures. With the 1![[thin space (1/6-em)]](https://www.rsc.org/images/entities/char_2009.gif) :
:![[thin space (1/6-em)]](https://www.rsc.org/images/entities/char_2009.gif) 3 stoichiometry33 for the Co–Se within 3 h of milling, the hexagonal phase could be identified and showed underestimated values for CS of about 7 nm, reaching a mass phase percentage of 60% with 70 h of milling time. Although the chalcogenides changed from Te to Se, the structures seemed to repeat themselves.
3 stoichiometry33 for the Co–Se within 3 h of milling, the hexagonal phase could be identified and showed underestimated values for CS of about 7 nm, reaching a mass phase percentage of 60% with 70 h of milling time. Although the chalcogenides changed from Te to Se, the structures seemed to repeat themselves.
3.2. Double-Voigt crystallite size anisotropy modeling
Effective modeling of the size and shape is also possible through the use of a macro for TOPAS developed by J. Neubauer et al.34 This strategy employed the DV approach and used the Lorentzian and Gaussian integral breadths for size parameter calculations, correlating it with the Scherrer equation for mean apparent size. Along with various possible morphologies, here the triaxial ellipsoid shape is used for the CS modeling due to its better agreement. The 15 h-milled sample refinements resulted in the shape presented in Fig. 2, plotted using the Mathematica software35 and the radii in the figure caption, representing a ‘true’ CS of 5.249 nm (the cubic root of the volume). These values cannot be compared with the previous results since their definitions are different: the first approach measures the CS diameter mass average and the last uses a surface-weighted average. The Rwp value reduced by 0.16% but GoF was reduced by 0.1%, adding just one parameter if compared to the conventional approach.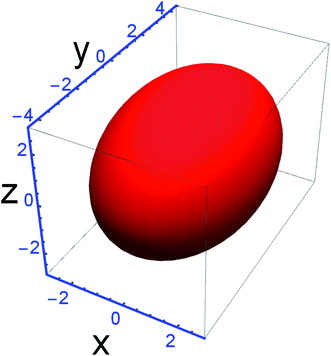 | ||
| Fig. 2 Crystallite size anisotropy modeled with a triaxial ellipsoid. Values are rx = rz = 2.855 nm and ry = 4.310 nm. R-values: Rwp of 2.78% (Rp 2.11%) and GoF 1.702. | ||
3.3. Transmission electron microscopy
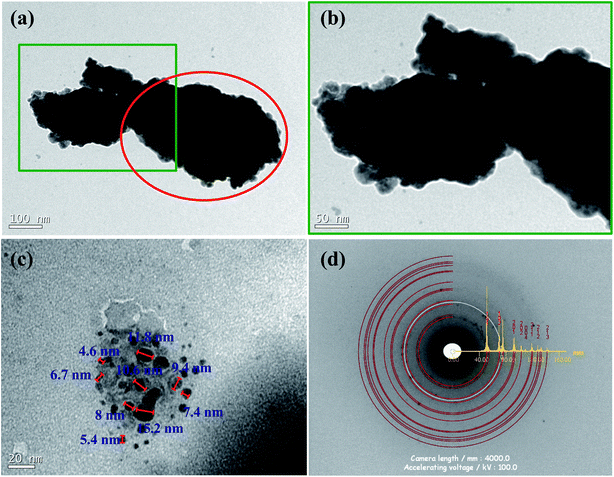
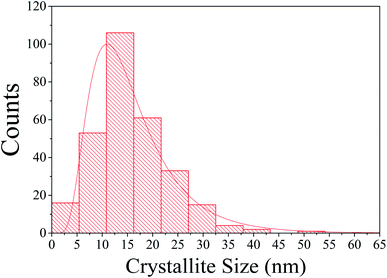
The microscopy images showed that the crystallites are aggregated into larger nanometric particles with irregular shapes and are of a few hundred nanometers in size. The aggregation of the crystallites took place through the cold-welding mechanism (competing with fracture mechanisms), inherent to the mechanical alloying process. Its visualization is presented in Fig. 3(a) with its magnified portion displayed in Fig. 3(b). These images confirm the particles to have smaller constituents. Using these, one can also measure the CSs according to Fig. 3(c), showing a variety of sizes in the image from 4.6 nm to 15.2 nm. A count using 291 supposed crystallites within 8 pictures furnished the distribution presented in Fig. 4 together with the average and distribution. According to Mittemeijer & Scardi,36 the number weighted column heights obtained by TEM make a comparison between the Rietveld weight average CS impossible, despite the values being in the same order of magnitude. Also, surface-weighted averages are impossible to match with numerical ones, meaning that the comparison with the above method is not comparable as well. The aggregation could also make it difficult to visualize the CSs and the values for the average size obtained by this technique were probably not very accurate.In Fig. 3(d), the SAED pattern revealed typical Debye rings that attested to the polycrystalline character of this nanocrystalline material. The Debye ring modeled by JEMS presented an excellent match for the plane spacing retrieved by Rietveld. Only one peak did not correspond to the β-CoTe phase and is presumed to be from the Co or Fe phase due to its location. No CoO was visible in this measurement, probably because of its small quantity in the sample.
3.4. Magnetic measurements and simulation results
The descending branches of the magnetization hysteresis loops, obtained through VSM at 300 K for the Co50Te50 samples with different milling times, are displayed in Fig. 5. Fig. S9† also shows these loops for the 15 h-milled sample, together with their temperature variations measured down to 10 K via PPMS. Although all curves exhibit some hysteresis (a small yet nonzero remnant magnetization and coercivity, HC), these certainly present features characteristic of disordered systems consisting of predominantly superparamagnetic (SPM) grains i.e., at sufficiently high temperatures, their magnetizations are thermally agitated, allowing them to rotate away from the respective equilibrium directions and towards that of H. The average size, 〈d〉, of the SPM particles and the sample's saturation magnetization, MS, are obtained by fitting the experimental magnetization curves taking into account both ferromagnetic (FM) and SPM contributions.37,38 Given that each fitting curve is a superposition of the SPM and FM parts, the method also yields the coercivity value of the FM phase, HFMC.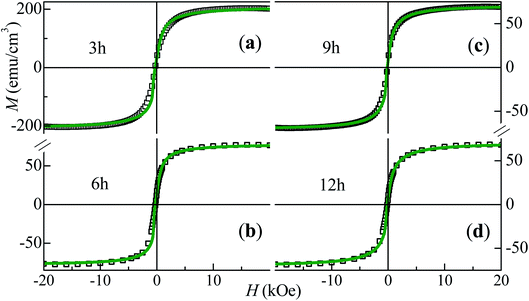 | ||
| Fig. 5 Symbols: descending branches of the M × H loops obtained at 300 K via VSM measurements for Co50Te50 with different milling times; the lines are the respective fitting curves. | ||
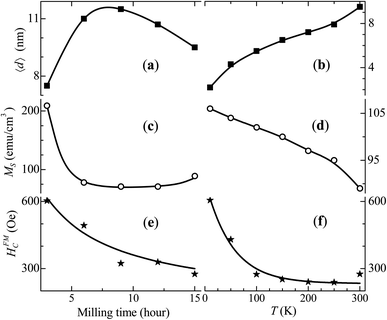
Fig. 6 shows the three parameters, 〈d〉, MS and HFMC, obtained from the simulations for different milling times of Co50Te50 at 300 K, and for different measurement temperatures for the 15 hour milled sample (the value of the other parameter used, i.e., the width of the log-normal grain-size distribution, was kept constant, equal to 1.5). The majority of these parameters present monotonous variations with both milling time and temperature, except for 〈d〉 and MS as functions of the milling time. The value of 〈d〉 increased by ∼53% and that of MS decreased by ∼67% from 3 h to 9 h of milling. For greater milling times, 〈d〉 and MS present a weak gradual decrease, while HFMC steadily reduces with the milling time, where more than twofold shrinking from 3 h to 15 h was estimated. All these parameters vary monotonously with the measurement temperature. However, while HFMC decreases exponentially, 〈d〉 and MS change in a linear manner – a small decrease of MS and an increase of 〈d〉.
The variation of 〈d〉 with T can be understood by bearing in mind that 〈d〉, estimated from our magnetization curves' fittings, represents a “magnetic” size, i.e., that of an entity which is SPM at the measurement conditions. Very small interacting grains tend to agglomerate, which is also facilitated by thermal agitation at higher temperatures where only great (polycrystalline with weak magnetic anisotropy) clusters are FM, contributing to HFMC. With the decrease of T, the number of magnetically-frozen grains with smaller 〈d〉 and stronger anisotropy (and thus higher HFMC values) increases, reflected in the great increase of HFMC when T decreases.
A ZFC/FC pair of curves, measured upon application of a magnetic field of 100 Oe, was traced for the Co50Te50 15 h-milled sample, for temperatures ranging between 5 K and 300 K (Fig. S10†). Due to the H-value being much lower than the system's anisotropy field at 300 K (estimated to be of ∼3 kOe), there is significant splitting between the FC and ZFC curves, there is no temperature region with reversible magnetization rotation as well as no indication to the existence of the SPM blocking temperature.
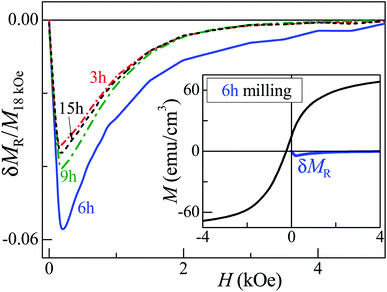
As seen in Fig. 6 and S9,† there is good agreement between model and experiment, indicating rather weak or absent FM intergrain interactions. For their evaluation, we employed the recently-developed δMR interaction plots technique.39 The method is based on measuring a recoil loop, where H is cycled between the maximum positive magnetic field and a smaller field, called recoil field, HR. Here, we constructed δMR plots for recoil loops with HR ≅ HC, traced at 300 K for the samples with different milling times. These plots, each normalized to the value of M obtained at H = 18 kOe of the respective recoil loops, are shown in Fig. 7. For H ≲ 4 kOe, all δMR(H) values exhibit negative deviations which, in uniaxial-anisotropy systems, are normally ascribed to a dipolar-like behaviour, stabilizing the demagnetized magnetic coupling state. However, the inset of Fig. 7 reveals these interactions in our system to be very weak, given the very small δMR amplitude value as compared to the major loop magnetization (theoretically, the amplitude of such a plot may reach a value twice as high as MS). Thus, our analysis reveals that the coupling between the FM grains is practically negligible, i.e., their aggregation is insignificant. It is worth mentioning that the FM contribution could also be related to the presence of a small amount of elemental Fe, Co or CoO in the samples.
4. Conclusions
The β-CoTe phase was synthesized successfully by the mechanical alloy of pure elemental reagents, using a single-step procedure that resulted in 93% of its mass phase percentage after 6 h of milling. The reproducibility and stability of the β-CoTe nanophase were verified and attested. TEM and XRPD results showed the crystals to be nanometric in size with TEM recording an average of 16 nm in diameter and a mass diameter average of about 13 nm being retrieved by the Rietveld FPA. The DV anisotropy approach for the CSs resulted in a surface-weighted ‘true’ CS average of 5.2 nm using a triaxial ellipsoid shape for modeling. No comparison between these numbers was possible due to their different nature. The values of the close-packing ratio proved to be smaller if compared to the ideal hexagonal structure but agreed with literature values. The occupational factor refinement revealed 86% of site occupancy for Co. Future studies should be produced to check for the suitable mechanochemistry stoichiometry that forms a pure phase for β-CoTe. Numerical simulations allowed us to estimate the average size of the SPM (β-CoTe phase) particles and the sample's saturation magnetization MS by fitting the experimental magnetization curves, also taking into account the ferromagnetic contribution.Conflicts of interest
There are no conflicts to declare.Acknowledgements
We are grateful to the Brazilian agencies CNPq (grants 421747/2016-1, 310175/2016-0, 305796/2016-0, and 150535/2019-8) and CAPES (M. A. M. Master and K. F. U. PhD Scholarships) for financial support. The XRPD, VSM and TEM/SAED/EDS measurements were performed at Laboratório de Difração de Raios-X (LDRX), Laboratório Multiusuário de Caracterização Magnética de Materiais (LabCAM) and Laboratório Central de Microscopia Eletrônica (LCME) multiuser facilities at UFSC.References
- R. R. Chianelli, et al., Catalytic properties of single layers of transition metal sulfide catalytic materials, Catal. Rev.: Sci. Eng., 2006, 48, 1–41 CrossRef CAS.
- C.-A. Tseng and C.-P. Lee, Transition Metal Chalcogenides for the Electrocatalysis of Water, IntechOpen, 2020, 38 DOI:10.5772/intechopen.92045.
- H. Yuan, L. Kong, T. Li and Q. Zhang, A review of transition metal chalcogenide/graphene nanocomposites for energy storage and conversion, Chin. Chem. Lett., 2017, 28, 2180–2194 CrossRef CAS.
- N. Balis, E. Stratakis and E. Kymakis, Graphene and transition metal dichalcogenide nanosheets as charge transport layers for solution processed solar cells, Mater. Today, 2016, 19, 580–594 CrossRef CAS.
- D. Jariwala, V. K. Sangwan, L. J. Lauhon, T. J. Marks and M. C. Hersam, Emerging device applications for semiconducting two-dimensional transition metal dichalcogenides, ACS Nano, 2014, 8, 1102–1120 CrossRef CAS.
- L. Takacs, The historical development of mechanochemistry, Chem. Soc. Rev., 2013, 42, 7649–7659 RSC.
- C. Suryanarayana, Mechanical alloying and milling, 2004, vol. 46, pp. 1–472 Search PubMed.
- P. Baláž, M. Baláž, M. Achimovičová, Z. Bujňáková and E. Dutková, Chalcogenide mechanochemistry in materials science: insight into synthesis and applications (a review), J. Mater. Sci., 2017, 52, 11851–11890 CrossRef.
- H. Yuan, et al., Thermodynamic assessment of the Te-X (X = As, Si, Co) systems, Calphad, 2020, 68, 101743 CrossRef CAS.
- T. A. Bither, R. J. Bouchard, W. H. Cloud, P. C. Donohue and W. J. Siemons, Transition Metal Pyrite Dichalcogenides. High-Pressure Synthesis and Correlation of Properties, Inorg. Chem., 1968, 7, 2208–2220 CrossRef CAS.
- P. d. M. d. Betzembroeck and J. Naud, Étude par diffraction-X de quelques composés du système Ni-Co-Te obtenus par synthèse thermique, Bull. Soc. Chim. Belg., 1971, 80, 107–116 CrossRef.
- R. M. Geffken, K. L. Komarek and E. M. Miller, Thermodynamic properties of cobalt-tellurium alloys, J. Solid State Chem., 1972, 4, 153–162 CrossRef CAS.
- M. Muhler, W. Bensch and M. Schur, Preparation, crystal structures, experimental and theoretical electronic band structures of cobalt tellurides in the composition range CoTe1.3-CoTe2, J. Phys.: Condens. Matter, 1998, 10, 2947–2962 CrossRef CAS.
- H. Schicketanz, P. Terzieff and K. L. Komarek, Thermoelectric and Magnetic Measurements on polycrystalline and single-crystal Co1-xTe, J. Less-Common Met., 1986, 119, 13–20 CrossRef CAS.
- B. R. Dahal, R. P. Dulal, I. L. Pegg and J. Philip, Ferrimagnetic Co1+δTe nanostructures, Mater. Res. Express, 2016, 3, 1–6 Search PubMed.
- K. O. Klepp and K. L. Komarek, Übergangsmetall-Chalkogensysteme, 4, Mitt.: Die systeme Kobalt-Tellur und Kobalt-Nickel-Tellur, Monatsh. Chem., 1973, 104, 105–117 CrossRef CAS.
- S. Pradhan, et al., Chemical synthesis of nanoparticles of nickel telluride and cobalt telluride and its electrochemical applications for determination of uric acid and adenine, Electrochim. Acta, 2017, 238, 185–193 CrossRef CAS.
- K. de Fatima Ulbrich, J. P. Winiarski, C. L. Jost and C. E. M. de Campos, Green and facile solvent-free synthesis of NiTe2 nanocrystalline material applied to voltammetric determination of antioxidant morin, Mater. Today Commun., 2020, 25, 101251 CrossRef CAS.
- K. de Fatima Ulbrich, J. P. Winiarski, C. L. Jost and C. E. Maduro de Campos, Mechanochemical synthesis of a Ni3-xTe2 nanocrystalline composite and its application for simultaneous electrochemical detection of dopamine and adrenaline, Composites, Part B, 2020, 183, 107649 CrossRef.
- M. S. Khan, M. N. Ashiq, M. F. Ehsan, T. He and S. Ijaz, Controlled synthesis of cobalt telluride superstructures for the visible light photo-conversion of carbon dioxide into methane, Appl. Catal., A, 2014, 487, 202–209 CrossRef CAS.
- Y. He, et al., Review Of Nanoscale Layered Transition Metal Chalcogenide Superconductors, Adv. Mater. Lett., 2019, 10, 152–163 CrossRef CAS.
- D. Ectors, F. Goetz-Neunhoeffer and J. Neubauer, Domain size anisotropy in the double-Voigt approach: an extended model, J. Appl. Crystallogr., 2015, 48, 1998–2001 CrossRef CAS.
- Bruker AXS, TOPAS, 2009 Search PubMed.
- K. F. Ulbrich and C. E. M. Campos, Stability of iron selenide nanophases prepared by mechanosynthesis, AIP Adv., 2019, 9, 045311 CrossRef.
- K. F. Ulbrich, et al., A comprehensive structural and microstructural investigation of a new iron-telluride nano phase, J. Mater. Chem. C, 2018, 6, 3047–3057 RSC.
- K. F. Ulbrich and C. E. M. Campos, Nanosized tetragonal β-FeSe phase obtained by mechanical alloying: structural, microstructural, magnetic and electrical characterization, RSC Adv., 2018, 8, 8190–8198 RSC.
- I. Levin, NIST Inorganic Crystal Structure Database (ICSD), 2018, DOI:10.18434/M32147.
- G. Hölzer, M. Fritsch, M. Deutsch, J. Härtwig and E. Förster, Kα1,2 and Kbeta1,3 x-ray emission lines of the 3d transition metals, Phys. Rev. A: At., Mol., Opt. Phys., 1997, 56, 4554–4568 CrossRef.
- D. Black, D. Windover and A. Henins, Standard reference material 660b for X-ray metrology, Adv. X-Ray Anal., 2009, 140–148 Search PubMed.
- JEMS, v 4, Switzerland Search PubMed.
- C. E. M. Campos, et al., Influence of minor oxidation of the precursor powders to form nanocrystalline CdTe by mechanical alloying, J. Alloys Compd., 2008, 466, 80–86 CrossRef CAS.
- C. E. M. Campos, J. C. D. Lima, T. A. Grandi, K. D. Machado and P. S. Pizani, Structural studies of cobalt selenides prepared by mechanical alloying, Phys. Rev. B: Condens. Matter Mater. Phys., 2002, 324, 409–418 CrossRef CAS.
- C. E. M. d. Campos, Estudo De Propriedades Físicas De Nanomateriais Produzidos Por Síntese Mecânica, Universidade Federal de Santa Catarina, 2005 Search PubMed.
- D. Ectors, F. Goetz-Neunhoeffer and J. Neubauer, A generalized geometric approach to anisotropic peak broadening due to domain morphology, J. Appl. Crystallogr., 2015, 48, 189–194 CrossRef CAS.
- Wolfram Research, I. Mathematica, 2020 Search PubMed.
- A. Kern, A. A. Coelho and R. W. Cheary, Convolution based profile fitting, Diffraction Analysis of the Microstructure of Materials, ed. E. J. Mittemeijer and P. Scardi, Materials Science, Springer, 2004, pp. 17–50, ISBN 3-540-40510-4; Bruker, Topas 5 Technical Reference Manual, 2014 Search PubMed.
- A. D. C. Viegas, J. Geshev, L. S. Dorneles and J. E. Schmidt, Correlation between magnetic interactions and giant magnetoresistance in melt-spun Co10Cu90 granular alloys, J. Appl. Phys., 1997, 82, 3047–3053 CrossRef CAS.
- V. Masheva, et al., On the magnetic properties of nanosized CoFe2O4, J. Magn. Magn. Mater., 1999, 196, 128–130 CrossRef.
- J. Geshev, Interaction plots obtained from in-field magnetization instead of remanence measurements, J. Magn. Magn. Mater., 2018, 467, 135–138 CrossRef CAS.
Footnote |
| † Electronic supplementary information (ESI) available. See DOI: 10.1039/d0ra10716f |
| This journal is © The Royal Society of Chemistry 2021 |

