 Open Access Article
The microstructures and mechanical properties of nanocrystalline Li2SiO3: molecular dynamics simulations
Yan Hong Shen a,
You Yu*a,
Xiang Gang Konga,
Jiang Denga,
Xiao Feng Tianb and
Yan Jun Liangc
aCollege of Optoelectronic Engineering, Chengdu University of Information Technology, Chengdu 610225, China. E-mail: yy2012@cuit.edu.cn
bThe College of Nuclear Technology and Automation Engineering, Chengdu University of Technology, Chengdu 610059, China
cChina North Communication Technology Co. Ltd., Xin Xiang, 45300, China
First published on 9th March 2021
Abstract
The microstructures and mechanical properties of nanocrystalline Li2SiO3 have been investigated via molecular dynamics calculations. The results indicate that the mean atomic mass densities of nanostructured Li2SiO3 with different mean grain size are slightly lower than that of ordinary crystal Li2SiO3. Interestingly, a significant anti-Hall–Petch effect between yield stress and average grain size is observed in the tensile deformation simulation of the samples. In fact, the curve changes linearly until the strain reaches approximately 0.016–0.018. Next, when the strain is between 0.27 and 0.38, the stress of the sample has a small peak in the plastic flow region. Then, all the samples will begin to fracture at a strain of about 0.39–0.41. Moreover, due to the influence of grain boundary sliding and grain rotation, there are a few dislocations in the samples with the small average grain sizes, highlighting the strong influence of the mechanical properties on the overall tensile deformation of the samples.
1 Introduction
Recently, Li2SiO3 has attracted tremendous experimental and theoretical interest in its widespread applications ranging from electronic devices,1 high-energy lithium secondary batteries,2,3 CO2 captors,4 and ceramic hobs.5 In addition, although solid tritium breeding materials used in nuclear fusion reaction have many selection materials,6–12 such as such as Li2TiO3, Li2SiO3, Li2ZrO3, Li8ZrO6, Li4SiO4, LiAlO2, Li2O, and so on, it is still one of the most important selection conditions that solid breeder materials can produce tritium safely and economically. Among them, Li2SiO3 is regarded as one of the most potential solid tritium breeding candidate materials in deuterium–tritium fusion reactors due to its excellent performance, such as good thermal stability, high tritium solubility, excellent structural material compatibility, potentially outstanding tritium production rate and fast tritium release rate.6–9 It is of great significance to research the deformation and fracture behavior of tritium breeder materials in the design of the nuclear fusion reactor. However, up to now, the deformation and fracture characteristics of nanostructured Li2SiO3 are not well understood.Numerous experimental investigations and theoretical studies have been performed in recent years to explore the properties of Li2SiO3. The electrical conductivity of nanostructured Li2SiO3 at T = 450 °C to 1000 °C was measured by Konishi et al.,10 using the two-terminal ac method. By performing the molecular-dynamics simulation, Habasaki11 investigated the statistical geometry and related dynamical property of Li2SiO3 at the glass transition point. The kinetics describing the thermal decomposition of Li2SiO3 was analyzed by Cruz et al.,12 who found that Li2SiO3 presented a very high level of thermal stability after the heat treatments. Du et al.13 studied the structural and electronic properties of Li2SiO3 by applying density functional theory (DFT) calculations. Annihilation of irradiation defects and tritium release processes in the Li2SiO3 system were reported by Nishikawa et al.14 They indicated that tritium release from Li2SiO3 sample began just before the irradiation defects were annihilated. Structural and dielectric properties of Li2SiO3 ceramic were investigated by Prasad et al.1 who observed that its dielectric studies displayed the strong frequency dispersion behavior in the low-frequency region. Li et al.7 have successfully synthesized Li2SiO3 nanocrystals in an alkaline hydro-thermal environment, and schematically depicted the formation of different morphology at the atomic level. Balbuena et al.15 reported on the dynamic and structural characterization of Li2SiO3 by means of Molecular Dynamics (MD) method. The structural and melting properties of single crystal and nanocrystal Li2SiO3 were investigated by Ma et al.16 by using Molecular Dynamics (MD) simulations. Khomane et al.17 reported the synthesis of nanocrystalline Li2SiO3 by coupling of sol–gel method in the reverse micro-emulsion. The nanostructures of Li2SiO3 were successfully synthesized by Alemi et al.18 using the hydro-thermal method and who investigated the gain sizes, morphologies and optical properties of the samples by PXRD technique and Fourier transform infrared spectroscopy.
Nanocrystals have unique mechanical properties different from conventional polycrystalline materials, such as low modulus of elasticity, high hardness and high strength, and so on, which is of great significance to develop new high strength and high hardness materials. In the experiment, it is very difficult to study the micro deformation mechanism of nanomaterials. At present, the researches on the mechanical properties of nanocrystals in the experiment are mostly limited to the measurement of their micro-structure and micro-hardness. Therefore, theoretical simulation has become a necessary auxiliary means for experimental research and exploration.
In this paper, the modelling details are described in Section 2. In Section 3, we present a series of results, such as, atomic mass density, tensile stress and strain curve, Young's modulus, yield stress, flow stress, and so on, obtained by using molecular dynamics (MD) method. We close with a summary in Section 4.
2 Modelling details
For obtaining the suitable equilibrium structures, the relaxation procedure of Li2SiO3 nanocrystals was carried out by LAMMPS program.19 Li2SiO3 with space group Cmc21 (no. 36) belonged to the orthorhombic system.16 The potential function of inter-atomic interaction for Li2SiO3 was taken from the results of Ma et al.16 The potential models were constructed by the combination of the Coulomb–Buckingham potential and the ZBL (Ziegler–Biersack–Littmark) potential. For describing the strong repulsion behavior at very short distances, the ZBL potential was used.16,30 The equations of atomic motion in all molecular dynamics simulations were integrated with a time step of 0.001 picoseconds (ps). In order to control the temperature and pressure in the process of simulation, Nosé/Hoover thermostat21 and Nosé/Hoover barostat22,23 were employed, respectively. In all simulations, Particle–Particle–Particle–Mesh (PPPM) was used to deal with the long-range Coulomb interaction.24In the tensile simulation, the periodic boundary conditions were used to simulate the tensile behavior of the quasi-infinite body in three different directions. We chose to stretch in one direction of the sample, but the other two directions of the sample could contract freely. The whole loading process of the sample always kept zero-stress state. The simulation process consisted of two steps. The first step was to relax the initial structures of the samples. The initial configuration of each sample was relaxed for 10![[thin space (1/6-em)]](https://www.rsc.org/images/entities/char_2009.gif) 000 steps, and the relaxation time was 1 ps, which could reach the energy stable state. According to the relaxation results, we obtained the atomic densities of the samples. In the second step, the relaxation structures were uniformly stretched along the x-axis (or y-axis, or z-axis). The number of the total trajectories for the six samples was 18. As the stretching results in different directions were similar, we only displayed the x-axis stretching results of the six samples. A tensile strain of 0.003 was applied each time. The strain rate was 0.15 × 10⁹ s−1. The stretching and relaxation process was repeated until the total tensile strain reached 0.8. The simulated temperature of the system was controlled at 300 K. The whole stretching time was set to 400 ps. By using the results of the stretching simulation, we studied the stress–strain, Young's modulus, yield stress, flow stress of the samples.
000 steps, and the relaxation time was 1 ps, which could reach the energy stable state. According to the relaxation results, we obtained the atomic densities of the samples. In the second step, the relaxation structures were uniformly stretched along the x-axis (or y-axis, or z-axis). The number of the total trajectories for the six samples was 18. As the stretching results in different directions were similar, we only displayed the x-axis stretching results of the six samples. A tensile strain of 0.003 was applied each time. The strain rate was 0.15 × 10⁹ s−1. The stretching and relaxation process was repeated until the total tensile strain reached 0.8. The simulated temperature of the system was controlled at 300 K. The whole stretching time was set to 400 ps. By using the results of the stretching simulation, we studied the stress–strain, Young's modulus, yield stress, flow stress of the samples.
3 Results and discussion
3.1 The three-dimensional nanostructure
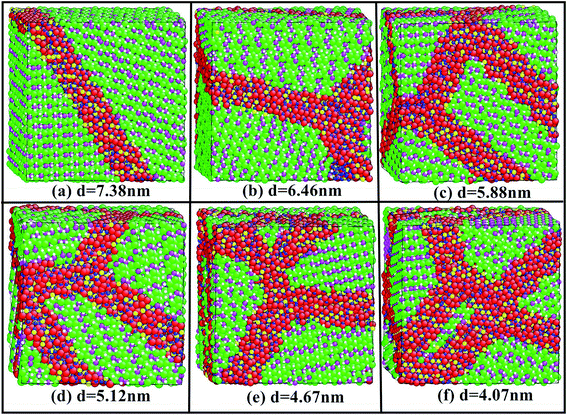
The unique mechanical properties of nanocrystals are not only related to their inherent microstructure characteristics (such as extremely small grain size and large interface atom percentage), but also their micro defects (such as porosity, micro-pore size and distribution) and surface defects. The initial geometrical size of all samples is 8a × 14b × 16c, where a, b and c are the experimental lattice constants of Li2SiO3, respectively.9 The actual size of the initial sample is 75.168 Å × 75.544 Å × 74.576 Å. In order to more accurately simulate the mechanical properties of Li2SiO3 nanocrystals, we use the constrained Voronoi tessellation to establish three-dimensional nanostructures of the samples. In the process of building the whole system model, a number of atoms at the grain boundary will be deleted to maintain the electrical neutrality of the whole system. The details of this method can be found in the previous work,20 and the geometric structures of six samples are constructed by the above method.Next, we perform the relaxation process to obtain the optimized structures of six samples, as shown in Fig. 1. In Fig. 1, the grain number of the six samples is 2, 3, 4, 6, 8 and 10, and the corresponding average grain size is 7.38 nm, 6.46 nm, 5.88 nm, 5.12 nm, 4.67 nm and 4.07 nm, respectively. The total number of the particles for the six samples in the simulation cell is about 42![[thin space (1/6-em)]](https://www.rsc.org/images/entities/char_2009.gif) 804–43
804–43![[thin space (1/6-em)]](https://www.rsc.org/images/entities/char_2009.gif) 008. It can be easy to see that the orientation of each grain is different.
008. It can be easy to see that the orientation of each grain is different.
3.2 The atomic mass density
The density of materials has an important influence on their properties, especially the mechanical properties. Generally speaking, the density of the common coarse grain in the fully dense state is the same as that of the single complete product, and the grain size has little effect on the overall density of the crystal. However, when the grain size reaches the nanometer level, the proportion of the atoms at the grain boundary is even larger than that in the interior of the grain, so the effect of the grain boundary on the density of the nanocrystal can no longer be ignored.In order to understand the change of the atomic mass density of the sample, we carry out molecular dynamics relaxation and obtain the structure information of the nanocrystalline Li2SiO3 with the different mean grain sizes. Table 1 shows the structure situation of the sample with the mean grain size of d = 5.12 nm by using AtomEye25 (see Table 1). The arrangement of atoms at the grain boundary is sparser than that in the crystal, and the original coordination number is reduced, which leads to the decrease of the density of the grain boundary. Our simulation results confirm that the mean mass density of the nanostructured Li2SiO3 declines, as shown in Table 1. Although only one sample is listed, the results of other samples are similar. In the range of small average grain size we researched, the mean mass density of the nanostructured Li2SiO3 is slightly smaller than that of the complete crystals.26
3.3 The tensile stress and strain curve
The plasticity and toughness of nanomaterials under tensile stress can be greatly improved by reducing porosity, defects and increasing density of materials. In order to better understand the tensile deformation mechanism of the samples, we simulate the tensile deformation process of nanocrystalline Li2SiO3 with the different average grain size.Fig. 2(a) displays the stress–strain curves of nanocrystalline Li2SiO3 with different average grain sizes in the range of strain 0–0.01. Until the strain reaches approximately 0.016–0.018, the curve changes linearly, and then bends gradually; when the strain reaches between 0.037 and 0.048, the curve obtains the peak stress and then begins to decrease slightly. The stress appears similar to the plastic flow stage, that is, there is no strain strengthening phenomenon. In Fig. 2(b), the tensile stress–strain curves of Li2SiO3 in the range of strain 0–0.8 are depicted. The curve shapes of the samples with different average grain sizes are similar. They all have obvious plastic flow stages. However, as the average grain size of the nanocrystalline Li2SiO3 declines, the strength of the sample will decrease and the curve will bend ahead of time. When the strain is between 0.27 and 0.38, the stress of the sample has a small peak in the plastic flow region. Finally, all the samples will start to fracture at the strain of about 0.39–0.41. Although only the x-axis stretching results of the samples are presented in Fig. 2, the results in other directions are similar. The margin of error is less than 5%.
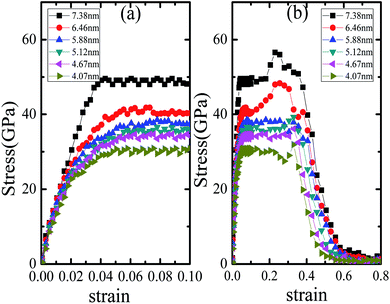 | ||
| Fig. 2 Tensile stress and strain curves of Li2SiO3 nanocrystals with different average grain sizes (d) (a) strain ranging from 0 to 0.1; (b) strain ranging from 0 to 0.8. | ||
3.4 The Young's modulus
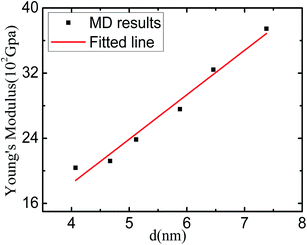
The Young's modulus of nanomaterial is strongly dependent on its size and shape. Fig. 3 is the relation curve of the Young's modulus and mean grain size of the sample by fitting the linear deformation part of the calculated results in Fig. 2(a). We can easy to see that the values of the Young's modulus of nanostructured Li2SiO3 decreases with the mean grain size of the sample decreasing. The softening of Young's modulus of the sample may be related to the intrinsic mechanism of nanomaterials. In fact, according to the analysis of the Voronoi volume of nanostructured Li2SiO3, it is demonstrated that the looseness of the grain boundary and grain distortion of the sample can be the internal causes of the softening of Young's modulus.3.5 The yield stress and flow stress
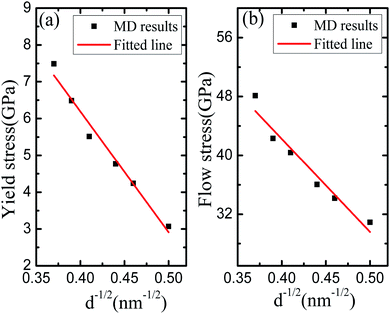
Fig. 4 exhibits the relationship between the yield stress (the flow stress) and the average grain size based on the calculation results of Fig. 2. In Fig. 4(a), it is easy to observe that yield stress of nanocrystalline Li2SiO3 declines with its average grain size decreasing. The softening phenomenon of yield stress is the essential characteristic of nanomaterials. In fact, according to the change of the volume and density of the sample, we observe that the internal cause of yield stress softening may be caused by grain boundary porosity and grain distortion. Fig. 4(b) shows the relationship curve between mean grain size and flow stress, in which has the obvious anti-Hall–Petch effect, that is, the flow stress of the sample decreases with its average grain size decreases. Because of the complex effects of various defects in the experiment, it is difficult to understand whether the anti-Hall–Petch effect is the essential feature of nanocrystals. However, Schiøtz et al.27 found that there was an anti-Hall–Petch phenomenon in some nanocrystals. The calculation results of yield stress and flow stress also verify the reports of Schiøtz et al.273.6 The whole tensile deformation process
For understanding the whole process of material deformation, Fig. 5 depicts the whole tensile deformation process of nanocrystalline Li2SiO3 as a function of the simulated time. The results show that the sample cannot be stretched infinitely. When the simulation time reaches 120 ps, the sample with d = 5.12 nm begins to break. Although only one sample simulation is shown here, other samples show similar phenomena. There are few dislocations in the samples, which may be caused by the small average grain size. The plastic deformation of Li2SiO3 nanocrystals may be mainly realized by grain boundary sliding and grain rotation.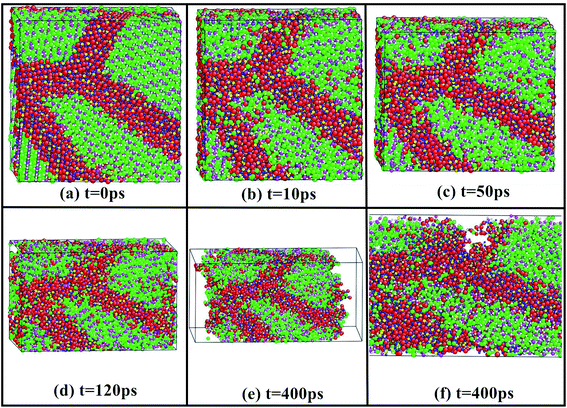 | ||
| Fig. 5 The whole tensile deformation process of a nanostructured Li2SiO3 with the average grain size of 5.12 nm. | ||
Due to the limitation of computer computing power, only a small part of nanomaterials can be considered in the simulation. Therefore, it is worthwhile to stress that there are some deficiencies in the simulation results: firstly, the simulated sample size is too small, which makes the stress field in the grains and at the grain boundaries deviate from the actual situation; secondly, because the simulation time of the sample is too short, the loading strain rate of the sample is too high, which leads to the high simulation strength of the whole process. Given the existing problems, we will continue to improve the algorithm and simulation means to expand the calculation scale and extend the simulation time in the future simulation.
Although we usually use the electron back-scatter diffraction28 and synchrotron radiation tomography29 to research the microstructure and mechanical properties of nanocrystals, the experimental study on the mechanical deformation details of nanocrystalline Li2SiO3 is not easy. Therefore, the simulation results in this paper hope to help to guide the further experimental research of Li2SiO3 nanocrystals.
4 Conclusions
All in all, we report the mechanical deformation properties of nanocrystalline Li2SiO3 by performing molecular dynamics simulation. The results are as follows: firstly, the atomic densities of Li2SiO3 nanocrystals with different mean grain sizes are lower than that of ordinary crystals. Next, by computing the stress–strain, Young's modulus, yield stress, flow stress of the sample, we observe that with the decrease of the mean grain size of the sample, its tensile strength decreases, and there is an inverse Hall–Petch effect between yield strength and average grain size. Moreover, in the whole tensile deformation process of the samples, there are few dislocations observed in the samples which may be caused by small mean grain sizes. The plastic deformation of nanostructured Li2SiO3 may be mainly realized by grain boundary sliding and grain rotation.Author contributions
Y. H. S. conceived the project, Y. H. S. and Y. Y. performed molecular dynamics simulations and analyzed the data, Y. H. S., Y. Y., X. G. K., J. D., X. F. T. and Y. J. L. co-wrote the paper. All authors discussed the results and commented on the manuscript.Conflicts of interest
There are no conflicts to declare.Acknowledgements
This work was supported in part by the National Natural Science Foundations of China (Grant no. 11904037, 11847134 and 11704049) and in part by the Scientific Research Foundation of CUIT (Grant no. KYTZ201705) and in part by Sichuan Province Science and Technology Program (Grant no. 2018GZ0515).References
- A. Prasad and A. Basu, Mater. Lett., 2012, 66, 1–3 CrossRef CAS.
- M. Broussely, F. Perton and P. Biensan, J. Power Sources, 1995, 54, 109–114 CrossRef CAS.
- C.-H. Lu and W.-C. Lee, J. Mater. Chem., 2000, 10, 1403–1407 RSC.
- H. Pfeiffer, C. Vázquez, V. Lara and P. Bosch, Chem. Mater., 2007, 19, 922–926 CrossRef CAS.
- H. Pfeiffer and P. Bosch, Chem. Mater., 2015, 17, 1704–1710 CrossRef.
- H. Kudo, K. Okuno and S. O'Hira, J. Nucl. Mater., 1988, 155–157, 524–528 CrossRef.
- X. Li and H. Yang, CrystEngComm, 2014, 16, 4501–4507 RSC.
- S. Buchner and N. M. Balzaretti, J. Phys. Chem. Solids, 2013, 74, 1179–1183 CrossRef CAS.
- T. Tang, P. Chen, W. Luo, D. Luo and Y. Wang, J. Nucl. Mater., 2012, 420, 31–38 CrossRef CAS.
- S. Konishi and H. Ohno, J. Am. Ceram. Soc., 1984, 67, 418–419 CrossRef CAS.
- J. Habasaki, Mol. Phys., 1990, 70, 513–528 CrossRef CAS.
- D. Cruz, S. Bulbulian, E. Lima and H. Pfeiffer, J. Solid State Chem., 2006, 179, 909–916 CrossRef CAS.
- J. Du and L. R. Corrales, J. Phys. Chem. B, 2006, 110, 22346–22352 CrossRef CAS PubMed.
- Y. Nishikawa, M. Oyaidzu, A. Yoshikawa, K. Munakata, M. Okada, M. Nishikawa and K. Okuno, J. Nucl. Mater., 2007, 367–370, 1371–1376 CrossRef CAS.
- C. Balbuena, C. Brito and D. A. Stariolo, J. Phys.: Condens. Matter, 2014, 26, 155104 CrossRef PubMed.
- S. Ma, S. Li, T. Gao, Y. Shen, X. Chen, C. Xiao and T. Lu, Ceram. Int., 2018, 44, 3381–3387 CrossRef CAS.
- R. B. Khomane, B. K. Sharma, S. Saha and B. D. Kulkarni, Chem. Eng. Sci., 2006, 61, 3415–3418 CrossRef CAS.
- A. Alemi, S. Khademinia and M. Sertkol, Int. Nano Lett., 2015, 5, 15–20 CrossRef CAS.
- S. Plimpton, J. Comput. Phys., 1995, 117, 1–19 CrossRef CAS.
- Y. Shen, T. Gao, X. Tian, X. Chen, C. J. Xiao and T. Lu, Sci. Rep., 2015, 5, 10698 CrossRef CAS PubMed.
- W. G. Hoover, Phys. Rev. A: At., Mol., Opt. Phys., 1985, 31, 1695–1697 CrossRef PubMed.
- W. G. Hoover, Phys. Rev. A: At., Mol., Opt. Phys., 1986, 34, 2499 CrossRef PubMed.
- S. Melchionna, G. Ciccotti and B. L. Holian, Mol. Phys., 1993, 78, 533–544 CrossRef CAS.
- G. Rajagopal and R. J. Needs, J. Comput. Phys., 1994, 115, 399–405 CrossRef.
- J. Li, Modell. Simul. Mater. Sci. Eng., 2003, 11, 173–177 CrossRef.
- H. Yamada, D. Tsunoe, S. Shiraishi and G. Isomichi, J. Phys. Chem. C, 2015, 119, 5412–5419 CrossRef CAS.
- J. Schiøtz, F. D. D. Tolla and K. W. Jacobsen, Nat, 1998, 391, 561–563 CrossRef.
- L. St-Pierre, E. Héripré, M. Dexet, J. Crépin, G. Bertolino and N. Bilger, Int. J. Plast., 2008, 24, 1516–1532 CrossRef CAS.
- H. F. Poulsen, S. Garbe, T. Lorentzen, D. J. Jensen, F. W. Poulsen, N. H. Andersen, T. Frello, R. Feidenhans'l and H. Graafsma, J. Synchrotron Radiat., 1997, 4, 147–154 CrossRef CAS PubMed.
- J. Biersack and J. Ziegler, Nucl. Instrum. Methods Phys. Res., 1982, 194, 93–100 CrossRef CAS.
| This journal is © The Royal Society of Chemistry 2021 |

