 Open Access Article
Creative Commons Attribution 3.0 Unported Licence
Influences of copper–potassium ion exchange process on the optical bandgaps and spectroscopic properties of Cr3+/Yb3+ co-doped in lanthanum aluminosilicate glasses
T. H.
Le
a,
Anh-Luan
Phan
bc,
Nguyen Minh
Ty
d,
Dacheng
Zhou
e,
Jianbei
Qiu
e and
Ho Kim
Dan
 *fg
*fg
aDepartment of Physics and Technology, Thai Nguyen University of Sciences, Thai Nguyen, Vietnam
bInstitute of Fundamental and Applied Sciences, Duy Tan University, Ho Chi Minh City 700000, Vietnam. E-mail: phananhluan@duytan.edu.vn
cFaculty of Natural Sciences, Duy Tan University, Da Nang City, 550000, Vietnam
dFaculty of Natural Sciences, Thu Dau Mot University, Thu Dau Mot 590000, Vietnam
eKey Laboratory of Advanced Materials of Yunnan Province, School of Materials Science and Engineering, Kunming University of Science and Technology, Kunming 650093, China
fCeramics and Biomaterials Research Group, Advanced Institute of Materials Science, Ton Duc Thang University, Ho Chi Minh City, Vietnam. E-mail: hokimdan@tdtu.edu.vn
gFaculty of Applied Sciences, Ton Duc Thang University, Ho Chi Minh City, Vietnam
First published on 26th February 2021
Abstract
In this study, lanthanum aluminosilicate glasses with compositions of 45SiO2–20Al2O3–12.5LaF3–10BaF2–9K2O–1Cr2O3–2.5Yb2O3 (SALBK) were prepared using the conventional melting method and copper–potassium ion exchange process. Influences of the ion exchange process between copper and potassium on the visible, upconversion, and near-infrared luminescence spectra of Cr3+/Yb3+ co-doped under excitations of 343, 490, and 980 nm LD were investigated. The EDS analysis of SALBK glasses was measured to confirm the presence of atoms in the glasses. The values of direct and indirect bandgaps of Cr3+/Yb3+ co-doped SALBK glasses were calculated and analyzed. Besides, the energy exchange processes between Cu+, Cu2+ ions, and Cr3+, Yb3+ ions were also proposed and discussed.
1. Introduction
In recent years, the spectroscopy and optical properties of chromium single-doped and chromium/rare-earth (RE) co-doped have been extensively studied1–5 due to their advantages.6,7 Chromium is a transition metal (TM) with many different valence states.8–10 In the glass networks, it often exists in the trivalent state Cr3+,1–5,8 which can emit radiation in the visible (VIS), near-infrared (NIR) regions under different excitation wavelengths.5,11,12 Also, the 4T1g(F) → 4A2g, 4T2g(F) → 4A2g, 2T1g → 4A2g, 2T2g → 4A2g and 2E → 4A2g transitions of Cr3+ can be combined with Yb3+ to generate the VIS, NIR emission spectra.5,13,14 In 2001, H. U. Güdel et al.15 confirmed that Cr3+, in association with Yb3+, creates VIS emission in the wavelength range from 400 to 700 nm.16 Moreover, our recent study17 showed that the Cr3+/Yb3+ co-doped in the glasses generates emission spectra in the wavelength regions of 420–700 nm, 660–860 nm, and 970–1150 nm corresponding to the excitations 358, 488, and 690 nm LD. Since then, we have been interested in enhancing emissions and optical properties of Cr3+/Yb3+ co-doped in the glasses.17,18 To this aim, embedding the coinage ions (such as, Ag+, Cu+ ions) into the glass through the ion exchange process20–22 is one of the different solutions which brought about positive results.3,12,19 In fact, the ion exchange process between coinage ions and alkali ions has many advantages compared with other traditional methods.21 For example, in many previous researches22–24 as well as in our recent work,25 it was shown that the coinage ions introduced by the ion exchange processes could significantly affect the optical properties of the glasses such as the refractive index, the optical density, the near-infrared emission spectrum, or even chemically strengthen the glasses26,27 as well as modify glass structure.28Through the ion exchange process, the Cu+ and Cu2+ ions, as well as Ag+ ions, could be ejected into the surfaces of the glasses,22,24,29–32 then become neutral copper or/and silver atoms and grow into copper or/and silver nanoparticles (CuNPs or/and AgNPs).24,29,32 Therefore, the ion exchange process between copper or/and silver cations and alkali cations to enhance the luminescence of Cr3+/RE3+ co-doped has been studied in recent times.21,29,33 In this paper, we study the influences of the ion exchange process between copper and potassium on the optical bandgaps and spectroscopic properties of Cr3+/Yb3+ co-doped in 45SiO2–20Al2O3–12.5LaF3–10BaF2–9K2O–1Cr2O3–2.5Yb2O3 lanthanum aluminosilicate glasses. We calculated the values of both the direct and indirect optical bandgaps and figured out its manner of dependence on the salt concentration ratios between CuSO4:K2SO4. Besides, the energy transfer mechanism between Cu+ and Cu2+ ions with Cr3+, Yb3+ ions was also proposed and discussed.
2. Experimental details
In this study, we used the highly pure (99.99%) reagents of SiO2, Al2O3, LaF3, BaF2, Cr2O3, K2O, Yb2O3, K2SO4, and CuSO4 to prepare compositions of 45SiO2–20Al2O3–12.5LaF3–10BaF2–9K2O–1Cr2O3–2.5Yb2O3 (SALBK) by the conventional melting method. After being condensed in a platinum crucible, 12 g of the mixture of these materials were put into an electric furnace to be heated at 1600 °C for 1 h under air atmosphere. After that, we poured the molten mixture into a mold placed on a polished plate made from stainless steel to form glass samples, then annealed all of them at 450 °C for 6 h to remove thermal strains.34 We next cut them into 10 mm × 10 mm × 2 mm size and finally polished their surface for the sake of measurements.In order to perform the ion exchange process between copper and potassium, we prepared salt mixtures with different concentration ratios between xCuSO4:(100 − x)K2SO4 where x varies as particularly given in Table 1.
| Name of glass samples | CuSO4x mol% | K2SO4(100 − x) mol% | Salt concentration ratio p between CuSO4 and K2SO4 |
|---|---|---|---|
| SALBK-1Cr2.5Yb-0Cu | 0 | 100 | 0 |
| SALBK-1Cr2.5Yb-15Cu | 15 | 85 | 0.18 |
| SALBK-1Cr2.5Yb-20Cu | 20 | 80 | 0.25 |
| SALBK-1Cr2.5Yb-25Cu | 25 | 75 | 0.33 |
| SALBK-1Cr2.5Yb-30Cu | 30 | 70 | 0.43 |
| SALBK-1Cr2.5Yb-35Cu | 35 | 65 | 0.54 |
All the experimental measurements with the glass samples, which were carried out at the ambient air temperature, and their corresponding instruments are listed in Table 2.
| Measurement | Instrument |
|---|---|
| Differential thermal analysis (DTA) | DTA-60AH Shimadzu |
| X-ray photoelectron spectroscopy (XPS) spectra | PHI5500 ESCA spectrometer |
| XRD analysis | Powder diffractometer (BRUKER AXS GMBH) using CuKα radiation |
| Absorption spectra | U-4100 Hitachi spectrophotometer |
| NIR emission spectra | SBP300 Zolix spectrophotometer with an InGaAs detector |
| Visible emission spectra | F-7000 Hitachi fluorescence spectrophotometer |
| Energy-dispersive X-ray spectroscopy (EDS) | Field emission scanning electron microscopy (FESEM) |
| Decay lifetimes | Edinburgh instruments FLS-1000 fluorescence spectrometer |
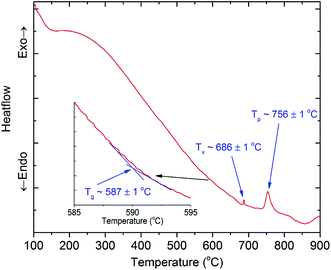
To find the suitable temperature ranges for the ion exchange process between copper and potassium, we conducted DTA analysis for 45SiO2–20Al2O3–12.5LaF3–10BaF2–9K2O–1Cr2O3–2.5Yb2O3 (SALBK) glass sample. The results are shown in Fig. 1, where Tg, Tx, and Tp are the glass transition temperature, the crystallization onset temperature and crystallization peak temperature, respectively. According to the results, we chose 587 °C as the temperature of the salt mixtures into which we submerged the glass samples for 24 h.34
Next, they were taken out and washed with alcohol and distilled water to eliminate all the residual salt on their surfaces. After all, the glass samples were further heat-treated at 686 °C for 8 h to promote the copper nanoparticles (CuNPs) formation.
3. Results and discussion
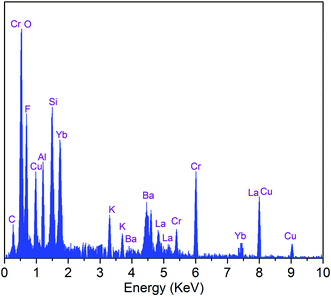
The EDS analysis of the SALBK-1Cr2.5Yb-35Cu glass sample is shown in Fig. 2. In addition to the EDS peaks of the Si, O, Al, La, F, Ba, K, Cr, and Yb atoms in SALBK glass,35 the ones of copper were strongly obtained corresponding to the energy values about 0.95, 8.04, and 8.99 keV,36 which means that the copper and potassium ions have been added into the glass network through the ion exchange process.37To investigate the influence of the ion exchange process between copper and potassium on the structure of glass materials, we performed the XRD analysis of all the glass samples together with using X'Pert HighScore Plus software,38 showing the results in Fig. 3. Conspicuously, the XRD pattern of the SALBK-1Cr2.5Yb-0Cu glass sample has no diffraction peak,39 while all of the others show three main peaks at 2θ = 30.6 degree (110), 2θ = 44.2 degree (111) and 2θ = 52.1 degree (200)40 due to the formation of copper nanoparticles (CuNPs).41 Besides, no diffraction peak of other nanocrystals is observed for all the samples.
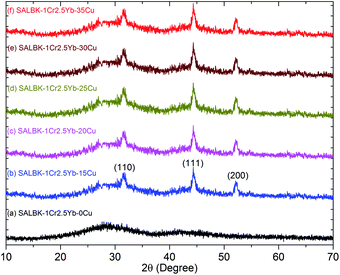 | ||
| Fig. 3 XRD analysis of SALBK-1Cr2.5Yb-0Cu, SALBK-1Cr2.5Yb-15Cu, SALBK-1Cr2.5Yb-20Cu, SALBK-1Cr2.5Yb-25Cu, SALBK-1Cr2.5Yb-30Cu, and SALBK-1Cr2.5Yb-35Cu glass samples. | ||
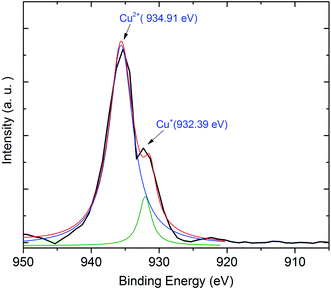
Next, we exhibit the absorption spectra of SALBK-1Cr2.5Yb-0Cu, SALBK-1Cr2.5Yb-15Cu, SALBK-1Cr2.5Yb-20Cu, SALBK-1Cr2.5Yb-25Cu, SALBK-1Cr2.5Yb-30Cu, and SALBK-1Cr2.5Yb-35Cu glass samples in Fig. 4. For the SALBK-1Cr2.5Yb-0Cu glass sample, we can observe three absorption peaks bands centered at 470, 650, and 878 nm, which is evidence that they are from the 4A2g → 4T1g(F), 4A2g → 4T2g(F) and 4A2g → 2E transitions of Cr3+.17,42,43 In addition, with the increase in salt concentration ratio p from 0.18 to 0.54, the emission intensities of Cr3+/Yb3+ co-doped bands centered at 470, 650 nm, and 878 nm strongly increased. These increments may be ascribed to the local surface plasmon resonance (LSPR) of copper ions44 and the crystal field variation caused by copper ions.17,43,45 Moreover, the intensities of two absorption spectra bands centered at 306 nm and 878 nm also increased significantly, which confirms the existence and the role of Cu+ and Cu2+, respectively,46 in the absorption spectra of Cr3+/Yb3+ co-doped. The Cu+ formed and exists in silicate glass due to reducing of Cu2+.47,48 To further demonstrate the existence of both Cu+ and Cu2+ ions in the glass after ion exchange. We analyzed XPS spectra of the SABLK-15Cu glass sample, the results are shown in Fig. 5 (the blue and green curves are the curve-fitting Gaussian of XPS spectra at 934.91 eV and 932.39 eV, respectively). Based on these results, we can confirm the existence of both Cu+ and Cu2+ ions in the SALBK glasses, corresponding to the XPS major peaks at 932.39 eV and 934.91 eV.49–52
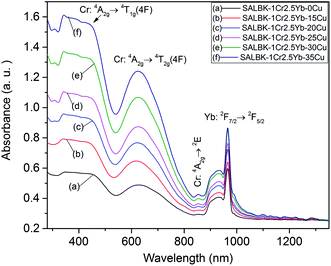 | ||
| Fig. 4 Absorption spectra of SALBK-1Cr2.5Yb-0Cu, SALBK-1Cr2.5Yb-15Cu, SALBK-1Cr2.5Yb-20Cu, SALBK-1Cr2.5Yb-25Cu, SALBK-1Cr2.5Yb-30Cu, and SALBK-1Cr2.5Yb-35Cu glass samples. | ||
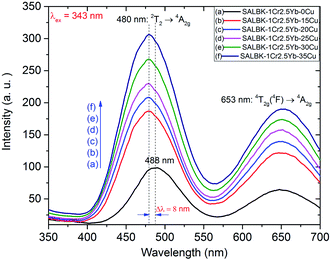
In Fig. 6, we present the visible emission spectra under excitation 343 nm of all these glass samples with two peaks at about 488 and 653 nm, which are assigned to the 2T2 → 4A2g and 4T2g(4F) → 4A2g transitions of Cr3+.17,43,45 As shown, the visible emission intensities of Cr3+/Yb3+ co-doped bands centered at 488 and 653 nm significantly increased with the increase in salt concentration ratio p from 0.18 to 0.54.47 Interestingly, the peak at 488 nm of Cr3+ under 343 nm excitation has a slight blue-shift of about 8 nm. The emission peak shift at 488 nm of Cr3+ is assigned to the role of Cu+ cations. This result is also consistent with the suggestions discussed in the paper53 of Tian-Shuai Lv et al.
The increases in visible emission intensity of Cr3+/Yb3+ co-doped band centered at 488 nm and 653 nm were assigned to the energy transfer (ET1) process from 3Eg(T2g) → 1Ag transition of Cu+ to 2T2 → 4A2g transition of Cr3+,47,48 and to the ET2 process from 3Eg(T1g) → 1Ag transition of Cu+ to 4T2g(4F) → 4A2g transition of Cr3+,47,48 respectively. These two ET1, ET2 processes are proposed as follows:
ET1: 3Eg(T2g)(Cu+) + 4A2g(Cr3+) → 2T2(Cr3+) + 1Ag(Cu+).
ET2: 3Eg(T1g)(Cu+) + 4A2g(Cr3+) → 4T2g(4F)(Cr3+) + 1Ag(Cu+).
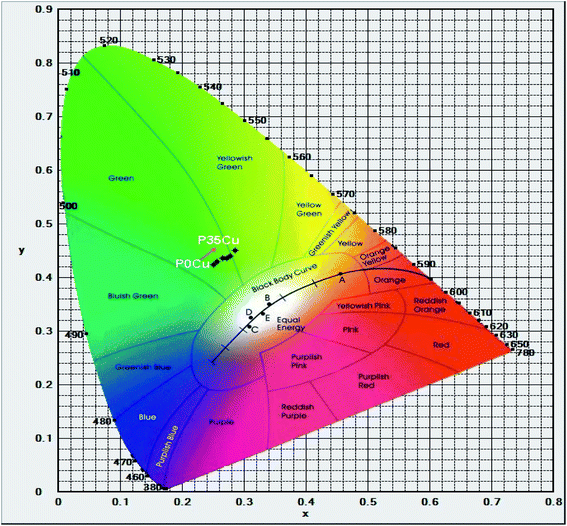
Furthermore, the calculated results of the CIE 1931(x; y) chromaticity coordinates for luminescence of Cr3+/Yb3+ co-doped in SALBK-1Cr2.5Yb-0Cu, SALBK-1Cr2.5Yb-15Cu, SALBK-1Cr2.5Yb-20Cu, SALBK-1Cr2.5Yb-25Cu, SALBK-1Cr2.5Yb-30Cu, and SALBK-1Cr2.5Yb-35Cu glass samples in correspondence to the P0Cu, P15Cu, P20Cu, P25Cu, P30Cu, and P35Cu points on the CIE 1931(x, y) chromaticity coordinates are given in Table 3, while Fig. 7 is for the sake of illustration. It can be seen that except that the CIE 1931(x; y) chromaticity coordinates for luminescence of Cr3+/Yb3+ co-doped in SALBK-1Cr2.5Yb-35Cu glass sample were shifted to the yellowish-green color region, the remaining were originally in the green color region.
| Name of glass samples | CIEx | CIEy | Position on the CIE 1931(x, y) chromaticity coordinates | Color region |
|---|---|---|---|---|
| SALBK-1Cr2.5Yb-0Cu | 0.2511 | 0.4241 | P0Cu | Green |
| SALBK-1Cr2.5Yb-15Cu | 0.2648 | 0.4356 | P15Cu | Green |
| SALBK-1Cr2.5Yb-20Cu | 0.2562 | 0.4294 | P20Cu | Green |
| SALBK-1Cr2.5Yb-25Cu | 0.2722 | 0.4363 | P25Cu | Green |
| SALBK-1Cr2.5Yb-30Cu | 0.2779 | 0.4402 | P30Cu | Green |
| SALBK-1Cr2.5Yb-35Cu | 0.2851 | 0.4501 | P35Cu | Yellowish-green |
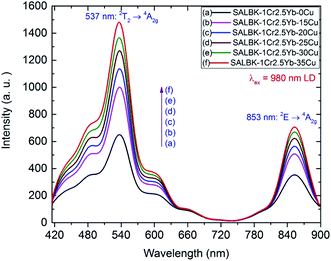
Fig. 8 shows the upconversion (UC) emission spectra of Cr3+/Yb3+ co-doped in all the glass samples under excitation 980 nm LD with two bands centered at ∼537 and 853 nm corresponding to 2T2 → 4A2g, and 2E → 4A2g transitions of Cr3+, respectively.17,45,54–56 With the increase in salt concentration ratio p from 0.18 to 0.54, the emission intensities of these bands markedly increased. These increments were assigned to the aforementioned ET1 process (for the band centered at 537 nm) and to the ET3 process from 2B2g → 2B1g transition of Cu2+ to 2E → 4A2g transition of Cr3+ (for the one at 853 nm),5,46 which is proposed as follows:
ET3: 2Eg(Cu2+) + 4A2g(Cr3+) → 2E(Cr3+) + 2B1g(Cu2+).
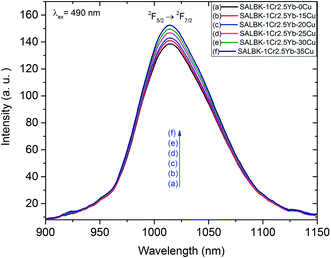
Likewise, Fig. 9 shows the NIR emission spectra under excitation 490 nm. There was only one NIR emission peak at 1016 nm, and it is assigned to the 2F5/2 → 2F7/2 transition of Yb3+.3,5 Similarly, the NIR emission intensity of the band centered at 1016 nm also increased with the increase in salt concentration ratio p, which is a manifestation of the ET4 process from 2B2g → 2B1g transition of Cu2+ to 2F5/2 → 2F7/2 transition of Yb3+:57
ET4: 2Eg(Cu2+) + 2F7/2(Yb3+) → 2F5/2(Yb3+) + 2B1g(Cu2+).
The mechanism for the visible and NIR luminescence of Cr3+/Yb3+ co-doped under excitations of 343, 490, and 980 nm LD, and the details of all the above-mentioned ET1, ET2, ET3, and ET4 processes are described in Fig. 10.
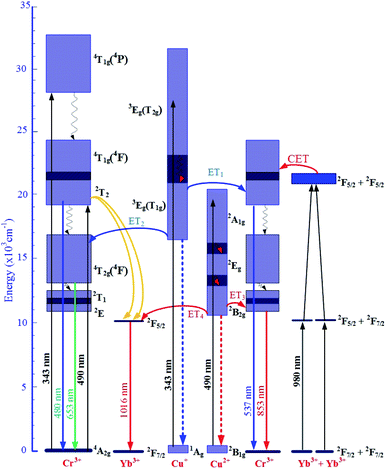 | ||
| Fig. 10 Mechanism ET processes for the visible, UC, and NIR luminescence of Cr3+/Yb3+ co-doped under excitations 343, 490, and 980 nm LD. | ||
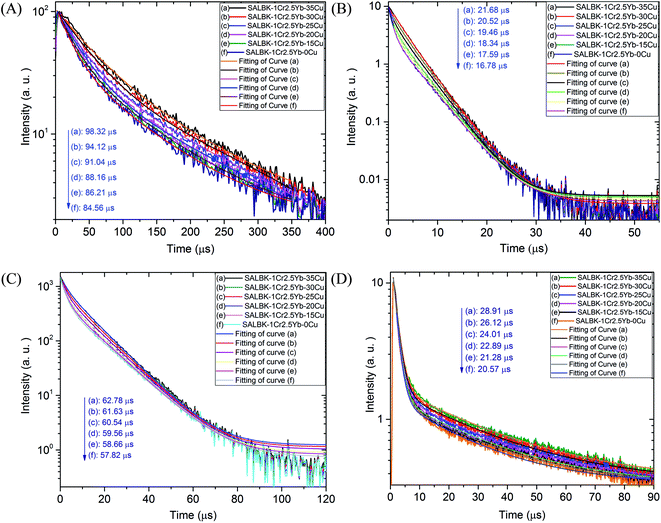
To further validate evidence for the ET1, ET2, ET3, ET4 processes from Cu+/Cu2+ ions to Cr3+ and Yb3+ ions, we carried out the decay lifetimes measurement for several glass samples. Namely, the decay lifetimes curves of Cr3+ at 537, 653, and 853 nm to demonstrations for the ET1, ET2, ET3 processes are shown in Fig. 11A–C, respectively while the decay lifetimes curve of Yb3+ at 1016 nm to demonstrations for the ET4 is in Fig. 11D.
We recall that the decay lifetimes can be calculated by the following equation:58,59
 | (1) |
| Name of glass samples | Decay lifetimes of Cr3+ at 537 nm, λex = 980 nm LD (ET1 process) | Decay lifetimes of Cr3+ at 653 nm, λex = 343 nm (ET2 process) | Decay lifetimes of Cr3+ at 853 nm, λex = 980 nm LD (ET3 process) | Decay lifetimes of Yb3+ at 1016 nm, λex = 490 nm (ET4 process) |
|---|---|---|---|---|
| SALBK-1Cr2.5Yb-35Cu | 98.32 μs | 21.68 μs | 62.78 μs | 28.91 μs |
| SALBK-1Cr2.5Yb-30Cu | 94.12 μs | 20.52 μs | 61.63 μs | 26.12 μs |
| SALBK-1Cr2.5Yb-25Cu | 91.04 μs | 19.46 μs | 60.54 μs | 24.01 μs |
| SALBK-1Cr2.5Yb-20Cu | 88.16 μs | 18.34 μs | 59.56 μs | 22.89 μs |
| SALBK-1Cr2.5Yb-15Cu | 86.21 μs | 17.59 μs | 58.66 μs | 21.28 μs |
| SALBK-1Cr2.5Yb-0Cu | 84.56 μs | 16.78 μs | 57.82 μs | 20.57 μs |
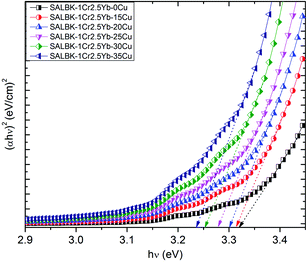
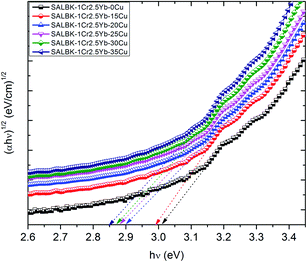
Finally, we calculated and analyzed the optical bandgap (Eg) of Cr3+/Yb3+ co-doped in SALBK glasses to evaluate whether and how it is affected by the ion exchange process between copper and potassium. The optical bandgap Eg can be calculated using Tauc's formula:60
| αhν = A(hν − Eg)m | (2) |
| Glass samples | Direct bandgap hν [(eV)] | Indirect bandgap hν [(eV)] |
|---|---|---|
| SALBK-1Cr2.5Yb-0Cu | 3.33 | 3.02 |
| SALBK-1Cr2.5Yb-15Cu | 3.32 | 2.98 |
| SALBK-1Cr2.5Yb-20Cu | 3.30 | 2.91 |
| SALBK-1Cr2.5Yb-25Cu | 3.28 | 2.88 |
| SALBK-1Cr2.5Yb-30Cu | 3.25 | 2.87 |
| SALBK-1Cr2.5Yb-35Cu | 3.23 | 2.83 |
The calculation gave us the estimated results of 3.23–3.33 eV for direct bandgap and 2.83–3.02 eV for indirect bandgap. On the other hand, both bandgap types decrease when the salt concentration ratio p increases from 0.18 to 0.54. Thus, we can conclude that the ion exchange process between copper and potassium had a diminishing effect on the bandgap. The reasons for this effect can be: (i) Because there are non-bridging oxygens (NBOs) in the silicate glasses network,64 the Al3+ ions have some options to link with SiO4 tetrahedra to form (Al, Si)–O–Si, (Al, Si)–O–Al bonds,65 or with others groups to form (Al, Si)–O bonds.65 After the copper ions were introduced into the silica network by the copper-potassium ion exchange process, these bonds may be broken and then Al–O− and Si–O− groups can combine with copper ions to create the Si–O–Cu, and Al–O–Cu bonds. (ii) With the increase of salt concentration ratio, more negative sites appeared due to the local structure of the NBOs in the silicate glasses network.64,66
4. Conclusions
The CuNPs were formed in 45SiO2–20Al2O3–12.5LaF3–10BaF2–9K2O–1Cr2O3–2.5Yb2O3 lanthanum aluminosilicate glasses through the ion exchange process between copper and potassium process. The intensities of all three visible, UC, and NIR emissions of Cr3+/Yb3+ co-doped bands at 480, 537, 653, 853, and 1016 nm increased with the increase in the ratio of salt concentrations CuSO4:K2SO4 from 0.18 to 0.54. When the salt concentration ratio of the ion exchange process achieved 35 mol%CuSO4:65 mol%K2SO4, the CIE 1931(x; y) chromaticity coordinates for the luminescence of Cr3+/Yb3+ co-doped in SALBK-1Cr2.5Yb-35Cu glass sample shifted to the yellowish-green color region. At the same time, the estimated results of the optical bandgap (Eg) confirmed that with the increase in the ratio of salt concentrations CuSO4:K2SO4 from 0.18 to 0.54, the value of both direct and indirect bandgaps decrease. Besides, the possible energy transfer processes from Cu+, Cu2+ ions to Cr3+, Yb3+ ions were determined through the experimental results of the spectroscopic emissions and the decay lifetimes.Conflicts of interest
There are no conflicts to declare.Acknowledgements
This research is funded by Vietnam National Foundation for Science and Technology Development (NAFOSTED) under grant number 103.03-2020.30.References
- D. Gourier, A. Bessière, S. K. Sharma, L. Binet, B. Viana, N. Basavaraju and K. R. Priolkar, Origin of the visible light induced persistent luminescence of Cr3+-doped zinc gallate, J. Phys. Chem. Solids, 2014, 75, 826–837, DOI:10.1016/j.jpcs.2014.03.005.
- Z. Gerelkhuu, B. T. Huy, J. W. Chung, T. L. Phan and E. Conte, Yong-Ill Lee, Influence of Cr3+ on upconversion luminescent and magnetic properties of NaLu0.86-xGd0.12F4:Crx3+/Er3+0.02 (0 ≤ x ≤ 0.24) material, J. Lumin., 2017, 187, 40–45, DOI:10.1016/j.jlumin.2017.02.038.
- Z. J. Fang, Y. Li, F. T. Zhang, Z. J. Ma, G. P. Dong and J. R. Qiu, Enhanced sunlight excited 1-μm emission in Cr3+–Yb3+ co-doped transparent glass-ceramics containing Y3Al5O12 nanocrystals, J. Am. Ceram. Soc., 2014, 98(4), 1–6, DOI:10.1111/jace.13449.
- X. L. Yang, W. C. Wang and Q. Y. Zhang, BaF2 modified Cr3+/Ho3+ co-doped germanate glass for efficient 2.0 μm fiber lasers, J. Non-Cryst. Solids, 2018, 482, 147–153, DOI:10.1016/j.jnoncrysol.2017.12.031.
- H. K. Dan, N. M. Ty, D. C. Zhou and J. B. Qiu, Anh-Luan Phan, Influence of Cr3+ on yellowish-green UC emission and energy transfer of Er3+/Cr3+/Yb3+ tri-doped zinc silicate glasses, J. Am. Ceram. Soc., 2020, 103, 6356–6368, DOI:10.1111/jace.17359.
- Q. Y. Shao, H. Ding, L. Q. Yao, J. F. Xu, C. Liang and J. Q. Jiang, Photoluminescence properties of a ScBO3:Cr3+ phosphor and its applications for broadband near-infrared LEDs, RSC Adv., 2018, 8, 12035–12042, 10.1039/C8RA01084F.
- M. A. Hassan, F. Ahmad and Z. M. Abd El-Fattah, Novel identification of ultraviolet/visible Cr6+/Cr3+ optical transitions in borate glasses, J. Alloys Compd., 2018, 750, 320–327, DOI:10.1016/j.jallcom.2018.03.351.
- U. R. Rodríguez-Mendoza, A. Speghini, D. Jaque, M. Zambelli and M. Bettinelli, Optical properties of single doped Cr3+ and co-doped Cr3+–Nd3+ aluminum tantalum tellurite glasses, J. Alloys Compd., 2004, 380, 163–166, DOI:10.1016/j.jallcom.2004.03.024.
- H. P. Ma, P. Liu, D. G. Deng and S. Q. Xu, Spectroscopy and crystal-field analysis of Cr4+-doped transparent silicate glass-ceramics, J. Non-Cryst. Solids, 2011, 357, 2294–2297, DOI:10.1016/j.jnoncrysol.2010.11.066.
- M. A. Hassan, F. M. Ebrahim and M. G. Moustafa, Z.M.Abd El-Fattah, M.M. El-Okr, Unraveling the hidden Urbach edge and Cr6+ optical transitions in borate glasses, J. Non-Cryst. Solids, 2019, 515, 157–164, DOI:10.1016/j.jnoncrysol.2019.02.026.
- S. Ye, E. H. Song, E. Ma, S. J. Zhang, J. Wang, X. Y. Chen, Q. Y. Zhang and J. R. Qiu, Broadband Cr3+-sensitized upconversion luminescence in La3Ga5GeO14: Cr3+, Yb3+, Er3+, Opt. Mater. Express, 2014, 4, 638–648, DOI:10.1364/OME.4.000638.
- X. Wang, W. H. Li, K. Tian, E. Lewis, S. B. Wang, G. Brambilla, Y. K. Dong, X. Wu and P. F. Wang, Enhanced near-infrared emission in Yb3+-Cr3+ co-doped KZnF3 glass-ceramics excited by a solar simulator, Ceramics International, 2019, 45, 6738–6743, DOI:10.1016/j.ceramint.2018.12.164.
- D. Ghosh, S. Balaji, K. Biswas and K. Annapurna, Quantum cutting induced multifold enhanced emission from Cr3+-Yb3+-Nd3+ doped zinc fluoroboro silicate glass-Role of host material, J. Appl. Phys., 2016, 120, 233104, DOI:10.1063/1.4971979.
- X. Y. Luo, X. L. Yang and S. G. Xiao, Conversion of broadband UV-visible to near infrared emission by LaMgAl11O19: Cr3+, Yb3+ phosphors, Mater. Res. Bull., 2018, 101, 73–82, DOI:10.1016/j.materresbull.2017.12.023.
- S. Heer, M. Wermuth, K. Krämer and H. U. Güdel, Upconversion excitation of Cr3+ 2E emission in Y3Ga5O12 codoped with Cr3+ and Yb3+, J. Lumin., 2001, 94–95, 337–341, DOI:10.1016/S0022-2313(01)00395-7.
- S. Heer, K. Petermann and H. U. Güdel, Upconversion excitation of Cr3+ emission in YAlO3 codoped with Cr3+ and Yb3+, J. Lumin., 2003, 102–103, 144–150, DOI:10.1016/S0022-2313(02)00490-8.
- H. K. Dan, N. M. Ty and T. D. Tap, Dai-Nam Le, L.T. Vinh, Q. Jiao, D.C. Zhou, J.B. Qiu, Energy transfer and spectroscopic properties of Cr3+/Yb3+ co-doped TeO2–ZnO–La2O3 tellurite glasses under different wavelength excitation lights, Opt. Mater., 2020, 100, 109662, DOI:10.1016/j.optmat.2020.109662.
- S. Heer, M. Wermuth, K. Krämer and H. U. Güdel, Sharp 2E upconversion luminescence of Cr3+ in Y3Ga5O12 co-doped with Cr3+ and Yb3+, Phys. Rev. B, 2002, 65, 125112, DOI:10.1103/PhysRevB.65.125112.
- M. Skruodiene, A. Katelnikovas, L. Vasylechko and R. Skaudzius, Tb3+ to Cr3+ energy transfer in a co-doped Y3Al5O12 host, J. Lumin., 2019, 208, 327–333, DOI:10.1016/j.jlumin.2018.12.048.
- C. Y. Yu, Z. W. Yang, J. Y. Zhao, J. L. Zhu, A. J. Huang, J. B. Qiu, Z. G. Song and D. C. Zhou, Luminescence enhancement and white light generation of Eu3+ and Dy3+ single-doped and co-doped tellurite glasses by Ag nanoparticles based on Ag+-Na+ ion-exchange, J. Alloys Compd., 2018, 748, 717–729, DOI:10.1016/j.jallcom.2018.03.191.
- X. J. He, X. H. Xu, Y. M. Shi and J. B. Qiu, Effective enhancement of Bi near-infrared luminescence in silicogermanate glasses via silver–sodium ion exchange, J. Non-Cryst. Solids, 2015, 409, 178–182, DOI:10.1016/j.jnoncrysol.2014.11.021.
- J. Y. Zhao, J. L. Zhu, Z. W. Yang, Q. Jiao, C. Y. Yu, J. B. Qiu and Z. G. Song, Selective preparation of Ag species on photoluminescence of Sm3+ in borosilicate glass via Ag+-Na+ ion exchange, J. Am. Ceram. Soc., 2020, 103(2), 955–964, DOI:10.1111/jace.16758.
- P. Vařák, P. Nekvindová, S. Vytykáčová, A. Michalcová, P. Malinský and J. Oswald, Near-infrared photoluminescence enhancement and radiative energy transfer in RE-doped zinc-silicate glass (RE = Ho, Er, Tm) after silver ion exchange, J. Non-Cryst. Solids, 2021, 120580, DOI:10.1016/j.jnoncrysol.2020.120580.
- I. A. Demichev, A. I. Sidorov and N. V. Nikonorov, The influence of the conditions of ion exchange in CuSO4:Na2SO4 melt on the optical properties of surface layers of silicate glass, Opt. Spectrosc., 2015, 119, 234–237, DOI:10.1134/S0030400X15080068.
- H. K. Dan, Anh-Luan. Phan, N.M. Ty, D.C. Zhou, J.B. Qiu, Optical bandgaps and visible/near-infrared emissions of Bin+-doped (n = 1, 2, and 3) fluoroaluminosilicate glasses via Ag+-K+ ions exchange process, Opt. Mater., 2021, 112, 110762, DOI:10.1016/j.optmat.2020.110762.
- L. Y. Zhang and X. J. Guo, Thermal history and its implications: A case study for ion exchange, J. Am. Ceram. Soc., 2020, 103(7), 3971–3977, DOI:10.1111/jace.17027.
- X. C. Li, M. Meng, D. Li, R. Wei, L. He and S. F. Zhang, Strengthening and toughening of a multi-component lithium disilicate glass-ceramic by ion-exchange, J. Eur. Ceram. Soc., 40(13), 4635–4646, DOI:10.1016/j.jeurceramsoc.2020.05.075.
- C. Ragoen, M. A. T. Marple, S. Sen, T. Lambricht and S. Godet, Structural modifications induced by Na+/K+ ion exchange in silicate glasses: A multinuclear NMR spectroscopic study, J. Non-Cryst. Solids, 2017, 474, 9–15, DOI:10.1016/j.jnoncrysol.2017.08.006.
- X. J. He, X. H. Xu, D. C. Zhou, C. Q. Yan and J. B. Qiu, Effects of copper ions on the near-infrared luminescence in Bi-doped silicate glass via copper for sodium ion exchange, J. Non-Cryst. Solids, 2015, 421, 30–34, DOI:10.1016/j.jnoncrysol.2015.04.024.
- I. A. Demichev, N. V. Nikonorov and A. I. Sidorov, Formation of core–shell bimetallic nanostructures in alkali silicate glasses in the course of silver and copper ion exchange and thermal treatment, J. Phys. Chem. C, 2015, 119(33), 19344–19349, DOI:10.1021/acs.jpcc.5b05036.
- G. K. Inwati, P. Kumar, W. D. Roos, H. C. Swart and M. Singh, UV-irradiation effects on tuning LSPR of Cu/Ag nanoclusters in ion exchanged glass matrix and its thermodynamic behaviour, J. Alloys Compd., 2020, 823, 153820, DOI:10.1016/j.jallcom.2020.153820.
- C. Y. Yu, Z. W. Yang, J. Y. Zhao, J. L. Zhu, A. J. Huang, J. B. Qiu, Z. G. Song and D. C. Zhou, Luminescence enhancement and white light generation of Eu3+ and Dy3+ single-doped and co-doped tellurite glasses by Ag nanoparticles based on Ag+-Na+ ion-exchange, J. Alloys Compd., 2018, 748, 717–729, DOI:10.1016/j.jallcom.2018.03.191.
- E. Cattaruzza, G. Battaglin, F. Gonella, A. Quaranta, G. Mariotto, C. Sada and S. Ali, chromium doping of silicate glasses by field-assisted solid-state ion exchange, J. Non-Cryst. Solids, 2011, 357, 1846–1850, DOI:10.1016/j.jnoncrysol.2010.12.050.
- H. K. Dan, N. M. Ty, T. D. Tap, H. X. Vinh, L. T. Vinh, Q. Jiao, D. C. Zhou and J. B. Qiu, Effects of Al3+/La3+ ratio on the DSC/DTA and luminescence properties of Bi-doped lanthanum aluminosilicate glasses, Infrared Phys. Technol., 2019, 103, 103072, DOI:10.1016/j.infrared.2019.103072.
- V. S. Dharmadhikari, S. R. Sainkar, S. Badrinarayan and A. Goswami, Characterisation of thin films of bismuth oxide by X-ray photoelectron spectroscopy, J. Electron Spectrosc. Relat. Phenom., 1982, 25, 181–189, DOI:10.1016/0368-2048(82)85016-0.
- A. A. Menazea, A. M. Abdelghany, N. A. Hakeem, W. H. Osman and F. H. Abd El-kader, Precipitation of Silver nanoparticles in Borate glasses by 1064 nm Nd:YAG Nanosecond Laser Pulses: Characterization and Dielectric Studies, J. Electron. Mater., 2020, 49, 826–832, DOI:10.1007/s11664-019-07736-z.
- M. Puchalska, E. Zych and P. Bolek, Luminescences of Bi3+ and Bi2+ ions in Bi-doped CaAl4O7 phosphor powders obtained via modified Pechini citrate process, J. Alloys Compd., 2019, 806, 798–805, DOI:10.1016/j.jallcom.2019.07.307.
- H. C. Swart and R. E. Kroon, Ultraviolet and visible luminescence from bismuth doped materials, Opt. Mater.: X, 2019, 2, 100025, DOI:10.1016/j.omx.2019.100025.
- X. J. He, X. H. Xu, D. C. Zhou, C. Q. Yan and J. B. Qiu, Effects of copper ions on the near-infrared luminescence in Bi-doped silicate glass via copper for sodium ion exchange, J. Non-Cryst. Solids, 2015, 421, 30–34, DOI:10.1016/j.jnoncrysol.2015.04.024.
- Y. Fujimoto and M. Nakatsuka, 27Al NMR structural study on aluminum coordination state in bismuth-doped silica glass, J. Non-Cryst, Solids, 2006, 352, 2254, DOI:10.1016/j.jnoncrysol.2006.02.047.
- M. Ismail, S. Gul, M. I. Khan and M. Ali Khan, Abdullah M. Asiri, S.B. Khan, Green synthesis of zerovalent copper nanoparticles for efficient reduction of toxic azo dyes congo red and methyl orange, Green Process. Synth., 2019, 8, 135–143, DOI:10.1515/gps-2018-0038.
- X. M. Lu, H. X. Li, X. Bao, W. Liu, X. X. Fan, Y. F. Liu, J. Li, Z. X. Guo, Y. Qiu, L. Zhang, S. N. Lv, X. L. Zhang, T. Y. Tan and J. W. Wang, Enhanced f and d state upconversion of Ln3+ and Cr3+ by codoping zinc and cadmium in gallogermanates, J. Lumin., 2019, 210, 358–362, DOI:10.1016/j.jlumin.2019.02.052.
- Q. Q. Wang, S. Y. Zhang, Z. W. Li and Q. Zhu, Near infrared-emitting Cr3+/Eu3+ co-doped zinc gallogermanate persistence luminescent nanoparticles for cell imaging, Nanoscale Res. Lett., 2018, 13(64), 1–9, DOI:10.1186/s11671-018-2477-6.
- P. S. Liu, H. Wang, X. M. Li, M. C. Rui and H. B. Zeng, Localized surface plasmon resonance of Cu nanoparticles by laser ablation in liquid media, RSC Adv., 2015, 5, 79738–79745, 10.1039/C5RA14933A.
- I. Mikalauskaite, G. Pleckaityte, M. Skapas, A. Zarkov, A. Katelnikovas and A. Beganskiene, Emission spectra tuning of upconverting NaGdF4:20%Yb, 2%Er nanoparticles by Cr3+ co-doping for optical temperature sensing, J. Lumin., 2019, 213, 210–217, DOI:10.1016/j.jlumin.2019.05.032.
- T. S. Lv, X. H. Xu, D. C. Zhou and J. B. Qiu, Influence of Cu+ cations on photoluminescence properties of Tb3+ in Cu+–Na+ ion-exchanged sodium-borosilicate glasses, J. Non-Cryst. Solids, 2015, 409, 14–19, DOI:10.1016/j.jnoncrysol.2014.11.006.
- J. A. Jiménez, M. Sendova and C. Q. Zhao, Efficient energy transfer and enhanced near-IR emission in Cu+/Nd3+-activated aluminophosphate glass, J. Am. Ceram. Soc., 2015, 98(10), 305–308, DOI:10.1111/jace.13727.
- J. A. Jiménez and M. Sendova, Enhanced 1.53μm emission of Er3+ ions in phosphate glass via energy transfer from Cu+ ions, J. Appl. Phys., 2014, 116, 033518, DOI:10.1063/1.4890716.
- J. Z. Zhang, Y. H. Xu, Z. Liu, W. R. Yang and J. Q. Liu, A highly conductive porous graphene electrode prepared via in situ reduction of graphene oxide using Cu nanoparticles for the fabrication of high performance supercapacitors, RSC Adv., 2015, 5, 54275, 10.1039/C5RA07857A.
- Z. Jin, C. Liu, K. Qi and X. Q. Cui, Photo-reduced Cu/CuO nanoclusters on TiO2 nanotube arrays as highly efficient and reusable catalyst, Sci. Rep., 2017, 7, 39695, DOI:10.1038/srep39695.
- M. C. Biesinger, Advanced analysis of copper X-ray photoelectron spectra, Surf. Interface Anal., 2017, 49, 1325–1334, DOI:10.1002/sia.6239.
- A. Gupta, R. Jamatia, R. A. Patil, Y.-R. Ma and A. K. Pal, Copper Oxide/reduced graphene oxide nanocomposite-catalyzed synthesis of flavanones and flavanones with triazole hybrid molecules in one pot: a green and sustainable approach, ACS Omega, 2018, 3, 7288–7299, DOI:10.1021/acsomega.8b00334.
- T.-S. Lv, Xu-H. Xu, X. Yu and J. B. Qiu, Evolution in the oxidation valences and sensitization effect of copper through modifying glass structure and Sn2+/Si codoping, J. Am. Ceram. Soc., 2015, 98(7), 2078–2085, DOI:10.1111/jace.13599.
- L. F. Yuan, Y. H. Jin, Y. Su, H. Y. Wu, Y. H. Hu and S. H. Yang, Optically stimulated luminescence phosphors: principles, applications, and prospects, Laser Photonics Rev., 2020, 14(12), 2000123, DOI:10.1002/lpor.202000123.
- Y. H. Jin, Y. H. Hu, L. F. Yuan, L. Chen, H. Y. Wu, G. F. Ju, H. Duan and Z. F. Mu, Multifunctional near-infrared emitting Cr3+-doped Mg4Ga8Ge2O20 particles with long persistent and photostimulated persistent luminescence, and photochromic properties, J. Mater. Chem. C, 2016, 4, 6614–6625, 10.1039/C6TC01640E.
- Y. Y. Zhan, Y. H. Jin, H. Y. Wu, L. F. Yuan, G. F. Ju, Y. Lv and Y. H. Hu, Cr3+-doped Mg4Ga4Ge3O16 near-infrared phosphor membrane for optical information storage and recording, J. Alloys Compd., 2019, 777, 991–1000, DOI:10.1016/j.jallcom.2018.11.065.
- Y. X. Zhuang and S. Tanabe, Forward and back energy transfer between Cu2+ and Yb3+ in Ca1−xCuSi4O10:Ybx crystals, J. Appl. Phys., 212, 112, 093521, DOI:10.1063/1.4765013.
- H. K. Dan, D. C. Zhou, R. F. Wang, J. Qiao, Z. W. Yang, Z. G. X. Yu and J. B. Qiu, Effect of copper nanoparticles on the enhancement of upconversion in the Tb3+/Yb3+co-doped transparent glass–ceramics, Opt. Mater., 2015, 39, 160–166, DOI:10.1016/j.optmat.2014.11.018.
- H. K. Dan, D. C. Zhou, R. F. Wang, J. Qiao, Z. W. Yang, Z. G. Song, X. Yu and J. B. Qiu, Effect of Mn2+ ions on the enhancement upconversion emission and energy transfer of Mn2+/Tb3+/Yb3+ tri-doped transparent glass-ceramics, Mater. Lett., 2015, 150, 76–80, DOI:10.1016/j.matlet.2015.03.005.
- J. Tauc, in Amorphous and Liquid Semiconductors, ed. J. Tauc, Plenum, New York, 1974, ch. 4) Search PubMed.
- P. H. Nam, N. X. Phuc, P. H. Linh, L. T. Lu, D. H. Manh, P. T. Phong and I.-J. Lee, Effect of zinc on structure, optical and magnetic properties and magnetic heating efficiency of Mn1-xZnxFe2O4 nanoparticles, Phys. B, 2018, 550, 428–435, DOI:10.1016/j.physb.2018.09.004.
- Ł. Jarosińskia, J. Pawlaka and S. K. J. Al-Ani, Inverse logarithmic derivative method for determining the energy gap and the type of electron transitions as an alternative to the Tauc method, Opt. Mater., 2019, 88, 667–673, DOI:10.1016/j.optmat.2018.12.041.
- S. B. Mallur, T. Czarnecki, A. Adhikari and P. K. Babu, Compositional dependence of optical band gap and refractive index in lead and bismuth borate glasses, Mater. Res. Bull., 2015, 68, 27–34, DOI:10.1016/j.materresbull.2015.03.033.
- T. Schaller, J. F. Stebbins and M. C. Wilding, Cation clustering and formation of free oxide ions in sodium and potassium lanthanum silicate glasses: nuclear magnetic resonance and Raman spectroscopic findings, J. Non-Cryst. Solids, 1999, 243, 146–157, DOI:10.1016/S0022-3093(98)00838-2.
- S. Sen and J. F. Stebbins, Structural role of Nd3+ and Al3+ cations in SiO2 glass: a 29Si MAS-NMR spin-lattice relaxation, 27Al NMR and EPR study, J. of Non-Cryst, Solids, 1995, 188, 54–62, DOI:10.1016/0022-3093(95)00099-2.
- M. Handke, W. Mozgawa and M. Nocun, Specific features of the IR spectra of silicate glasses, J. Mol. Struct., 1994, 325, 129–136, DOI:10.1016/0022-2860(94)80028-6.
| This journal is © The Royal Society of Chemistry 2021 |

