DOI:
10.1039/D0RA10834K
(Paper)
RSC Adv., 2021,
11, 10451-10462
Judd–Ofelt parameters and X-ray irradiation results of MNb2O6:Eu3+ (M = Sr, Cd, Ni) phosphors synthesized via a molten salt method
Received
25th December 2020
, Accepted 23rd February 2021
First published on 10th March 2021
Abstract
Trivalent Eu-activated MNb2O6 (M = Sr, Cd, Ni) ceramic phosphors were produced using the molten salt route, which involves a low sintering temperature and provides improved homogeneity. The photoluminescence (PL) and radioluminescence (RL) spectra of phosphors exhibited characteristic Eu3+ emissions with 5F0 → 7Fj transitions, and strong peaks occurred at the 5D0 → 7F2 transition. The PL and RL emissions of SrNb2O6:Eu3+ decreased over 3 mol%, while both emissions for CdNb2O6:Eu3+ and NiNb2O6:Eu3+ increased with increasing Eu3+ concentration. The spectral properties of phosphors were evaluated by determining Judd–Ofelt intensity parameters (Ω2, Ω4) from the PL emission spectrum. The quantum efficiencies (ηQE%) of MNb2O6:Eu3+ (M = Sr, Cd, Ni) phosphors with the highest emission were found as 61.87%, 41.89%, and 11.87% respectively. Bandwidths (σe × Δλeff) and optical gains (σe × τ) of MNb2O6:Eu3+ (M = Sr, Cd, Ni) phosphors with highest emissions were found as follows; 24.182 × 10⁻²⁸, 28.674 × 10⁻²⁸, 38.647 × 10⁻²⁸ cm3 and 20.441 × 10⁻²⁵, 13.790 × 10⁻²⁵, 3.987 × 10⁻²⁵ cm2 s, respectively, corresponding to the 5D0 → 7F2 transition.
1. Introduction
The scientific and technological applications of rare earth (RE) elements have seen significant progress in last few decades due to their unique spectroscopic properties in different host lattices, where their superior chemical and thermal stability are along with their outstanding luminescent yield and color purity. Today, trivalent RE ions have a wide range of applications, such as high-performance luminescent devices, magnets, catalysts, and other functional materials.1–7 When the host lattice is activated by RE3+ ions, besides PL, they can cause changes in RL features. In the radioluminescence mechanism, high-energy ionizing radiation (X-rays, alpha particles, and electrons) instantly transforms into thousands of low-energy photons (1–6 eV). The RL feature is of great importance in many fields, such as high-tech industrial applications, homeland security, radiography, biochemical applications, medical devices, biological safety, particle physics, astrophysics, and nuclear material applications.6,7
The oxide compounds of columbite niobates can be expressed as MNb2O6 (M = Sr, Cd, Ni, Co, Mg, Mn, etc.). The symmetry of MNb2O6 easily accepts guest ions of a similar ionic size as the metal and Nb ions of the structure. As the MNb2O6 structure, the strontium niobate (SrNb2O6) compound composed of the SrO6–NbO6 octahedral8,9 stands out due to its luminescence,7–9 photocatalytic,10,11 and dielectric12 properties. The high photocatalytic property of SrNb2O6 is attributed to its increasing absorption by the change of its crystal structure.10 The molten salt method, one of the methods used in the synthesis of niobates has a favorite feature due to some advantages, which provides a low sintering temperature, short reaction time, good composition, and improved homogeneity.7,8 The advantage of the molten salt method can be evaluated by comparing it with the solid-state reaction method. Here, SrNb2O6 was produced by the solid-state reaction method at 1250 °C for 7 h,9 whereas SrNb2O6 was fabricated using the molten salt method at 650 °C for 4 h.7,8
In this study, the structural, photoluminescence, and X-ray induced characterizations of SrNb2O6:Eu3+ were carried out by XRD, SEM, PL, and RL analyses. In addition, the previously reported phosphors of CdNb2O6:Eu3+ (ref. 13) and NiNb2O6:Eu3+ (ref. 14) were included in the study, and the Judd–Ofelt intensity parameters and radioluminescence results of MNb2O6:Eu3+ (M = Sr, Cd, Ni) phosphors were reported by comparison with PL and RL analyses. Also, the grain structures of three compounds were examined by SEM analysis.
2 Experimental
In the synthesis of (Sr, Cd, Ni)Nb2O6:xEu3+ (x% = 0.5, 3, 6 mol%) and undoped ceramic powders by the molten salt method, as starting materials for each synthesis, strontium nitrate (Sr(NO3)2) (Sigma-Aldrich, 99%), cadmium nitrate tetrahydrate (Cd(NO3)2·4H2O) (Sigma-Aldrich, 98.5%), nickel nitrate hexahydrate (Ni(NO3)2·6H2O) (Sigma-Aldrich, 99%), pure niobium oxide (Nb2O5) (Alpha Aesar, 99.9%), and Eu2O3 (Alpha Aesar, 99.9%) powder were used in the calculated stoichiometric amounts. The x value was taken as “mol”, which means 2 Eu atoms due to the Eu2O3 compound. The syntheses of (Cd,Ni)Nb2O6:Eu3+ (ref. 13 and 14) and SrNb2O6:Nd3+, Dy3+ (ref. 7 and 8) were reported as intermediate solid solutions. However, the Sr(NO3)2 amount was reduced slightly to prevent secondary phase formation in the synthesis of SrNb2O6:Nd3+, Dy3+,7,8 similarly, 0.98 and 0.95 mol were used instead of 1 mol Sr(NO3)2 for the 3 and 6 mol% Eu3+ samples, respectively, corresponding to 2 mol of Nb2O5. The stoichiometric amounts of the molten salt mixtures were added to the reactant mixtures. For this purpose, the molten salts to be used and their mixing ratios were, respectively, for strontium niobate synthesis, NaCl![[thin space (1/6-em)]](https://www.rsc.org/images/entities/char_2009.gif) :
:![[thin space (1/6-em)]](https://www.rsc.org/images/entities/char_2009.gif) KCl, salt
KCl, salt![[thin space (1/6-em)]](https://www.rsc.org/images/entities/char_2009.gif) :
:![[thin space (1/6-em)]](https://www.rsc.org/images/entities/char_2009.gif) salt molar ratio 6
salt molar ratio 6![[thin space (1/6-em)]](https://www.rsc.org/images/entities/char_2009.gif) :
:![[thin space (1/6-em)]](https://www.rsc.org/images/entities/char_2009.gif) 1 and salt
1 and salt![[thin space (1/6-em)]](https://www.rsc.org/images/entities/char_2009.gif) :
:![[thin space (1/6-em)]](https://www.rsc.org/images/entities/char_2009.gif) oxide weight ratio 1
oxide weight ratio 1![[thin space (1/6-em)]](https://www.rsc.org/images/entities/char_2009.gif) :
:![[thin space (1/6-em)]](https://www.rsc.org/images/entities/char_2009.gif) 1, for cadmium niobate synthesis, Li2SO4
1, for cadmium niobate synthesis, Li2SO4![[thin space (1/6-em)]](https://www.rsc.org/images/entities/char_2009.gif) :
:![[thin space (1/6-em)]](https://www.rsc.org/images/entities/char_2009.gif) Na2SO4, salt
Na2SO4, salt![[thin space (1/6-em)]](https://www.rsc.org/images/entities/char_2009.gif) :
:![[thin space (1/6-em)]](https://www.rsc.org/images/entities/char_2009.gif) salt molar ratio 1
salt molar ratio 1![[thin space (1/6-em)]](https://www.rsc.org/images/entities/char_2009.gif) :
:![[thin space (1/6-em)]](https://www.rsc.org/images/entities/char_2009.gif) 1 and salt
1 and salt![[thin space (1/6-em)]](https://www.rsc.org/images/entities/char_2009.gif) :
:![[thin space (1/6-em)]](https://www.rsc.org/images/entities/char_2009.gif) oxide weight ratio 1
oxide weight ratio 1![[thin space (1/6-em)]](https://www.rsc.org/images/entities/char_2009.gif) :
:![[thin space (1/6-em)]](https://www.rsc.org/images/entities/char_2009.gif) 1, for nickel niobate synthesis, Li2SO4
1, for nickel niobate synthesis, Li2SO4![[thin space (1/6-em)]](https://www.rsc.org/images/entities/char_2009.gif) :
:![[thin space (1/6-em)]](https://www.rsc.org/images/entities/char_2009.gif) Na2SO4, salt
Na2SO4, salt![[thin space (1/6-em)]](https://www.rsc.org/images/entities/char_2009.gif) :
:![[thin space (1/6-em)]](https://www.rsc.org/images/entities/char_2009.gif) salt molar ratio 1
salt molar ratio 1![[thin space (1/6-em)]](https://www.rsc.org/images/entities/char_2009.gif) :
:![[thin space (1/6-em)]](https://www.rsc.org/images/entities/char_2009.gif) 1 and salt
1 and salt![[thin space (1/6-em)]](https://www.rsc.org/images/entities/char_2009.gif) :
:![[thin space (1/6-em)]](https://www.rsc.org/images/entities/char_2009.gif) oxide weight ratio 1
oxide weight ratio 1![[thin space (1/6-em)]](https://www.rsc.org/images/entities/char_2009.gif) :
:![[thin space (1/6-em)]](https://www.rsc.org/images/entities/char_2009.gif) 1. The starting materials for each compound group were mixed to produce the phosphor powders by the molten salt synthesis method and finely ground in an agate mortar to ensure homogeneity. After that, europium oxide (Eu2O3) dopant was added. The final powder mixture was thoroughly mixed in an agate mortar for a final time and re-ground to ensure greater homogeneity. Then, mixtures prepared by weighing for each compound were placed and calcined in alumina crucibles at 650 °C for 4 h for strontium niobate, or at 900 °C for 4 h for cadmium niobate and nickel niobate. Phosphor powders obtained as a result of the heat treatment were washed many times with ultrapure water to remove the ionic salts they contained and vacuum filtered several times. The presence of Cl-ions in the filtrate was checked using qualitative reactions.
1. The starting materials for each compound group were mixed to produce the phosphor powders by the molten salt synthesis method and finely ground in an agate mortar to ensure homogeneity. After that, europium oxide (Eu2O3) dopant was added. The final powder mixture was thoroughly mixed in an agate mortar for a final time and re-ground to ensure greater homogeneity. Then, mixtures prepared by weighing for each compound were placed and calcined in alumina crucibles at 650 °C for 4 h for strontium niobate, or at 900 °C for 4 h for cadmium niobate and nickel niobate. Phosphor powders obtained as a result of the heat treatment were washed many times with ultrapure water to remove the ionic salts they contained and vacuum filtered several times. The presence of Cl-ions in the filtrate was checked using qualitative reactions.
The powder samples analyses were carried out by XRD (X-ray diffractometer; D2 PHASER, Bruker Corp., Germany) using Cu-Kα (1.54 Å) radiation in between 2θ = 5–70 °C with a scan speed of 2 °C min−1. SEM micrographs of the samples were taken by scanning electron microscopy (SEM; Inspect S50, FEI Corp., USA) after Au coating. Elemental compositions were determined by energy dispersive spectroscopy (EDS; INCAx-Sight 7274 model; 133 eV resolution 5.9 keV, OXFORD Instruments, England) which was attached to the SEM system (JSM-5910LV, JEOL Corp., Japan). EDS was performed at 20 kV SEM acceleration voltage.
PL (photoluminescence) measurements were recorded on an Edinburgh Instruments (UK) FLSP920 model fluorescence spectrometer with xenon lamp (450 W) continuous wavelength lamps for steady-state measurements. Decay times were taken by μF1 and μF2: 5 W or 60 W pulsed xenon microsecond flashlamps producing short microsecond pulses for decay measurements. Decay curves data (B1, τ1, B2, τ2) were recorded with a time-correlated single-photon counting (TCSPC) system. Radioluminescence (RL) results were obtained using an Horiba Jobin Yvon spectrometer (Japan), which included a liquid nitrogen-cooled CCD detector and an X-ray irradiation source Machlett OEG-50A. The data for the RL were recorded with a detector integration time of 5 s between 200–1000 nm and 2 mm was chosen for the slit widths (input and output). The operating level of the spectrometer was 30 kV and 15 mA (30 Gy min−1) and it was operated in a dark environment and at room temperature.
3. Results and discussions
3.1 Structural analyses
Fig. 1 shows the X-ray diffraction results of undoped SrNb2O6 and Eu3+-doped SrNb2O6 samples. The XRD pattern (JCPDS no: 28-1243) of the samples was indexed by orthorhombic columbite symmetry with the space group Pbcn60. The CdNb2O6:Eu3+ (ref. 13) and NiNb2O6:Eu3+ (ref. 14) structures also had the same symmetry, and their symmetry continued up to 6 mol%, while secondary phases were found at low amounts. The XRD-SEM results of SrNb2O6:Eu3+ were investigated in this study, the detailed X-ray diffraction results of the CdNb2O6:Eu3+ and NiNb2O6:Eu3+ have been reported in ref. 13 and 14. The cell parameters of orthorhombic SrNb2O6 are a = 5.592 Å, b = 7.722 Å, c = 10.989 Å, and α = β = γ = 90°.7 On the other hand, it has been reported that the orthorhombic columbite symmetry and monoclinic symmetry almost fully overlap with each other.15,16 Accordingly, XRD reflections of SrNb2O6 could be indexed with monoclinic symmetry (space group P21/c) which exactly fitted with the orthorhombic symmetry.15,16 Based on the monoclinic symmetry, the cell parameters of SrNb2O6 are a = 5.594 Å, b = 7.722 Å, c = 10.986 Å, and α = 90.37°, β = γ = 90°.17,18
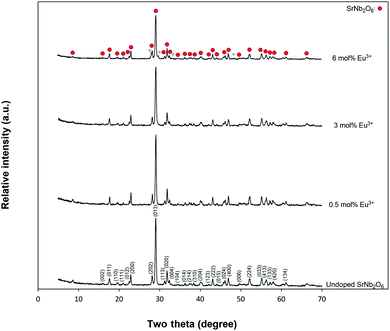 |
| | Fig. 1 X-ray diffraction results for undoped SrNb2O6 and Eu3+-doped SrNb2O6 powders. | |
The SrNb2O6 structure composed of corner-shared and edge-shared NbO6 octahedral aligned along the a-axis and c-axis, respectively, as shown in Fig. 2. The Sr2+ and Nb5+ cations are surrounded by O2− with 8 and 6 CN (coordination number), and their ionic radii (r) are 1.26 Å and 0.64 Å, respectively.7,9 There is a cationic site with Wyckoff position 4e for the compatibility of the activator ions within the crystal structure.9 The Eu3+ ions will occupy the SrNb2O6 structure with the ionic radii of 0.947 Å for 6 CN and 1.066 Å for 8 CN. On the basis of SrNb2O6 doping with Eu3+, the Eu3+ ions will take place as an intermediate atom, while some Eu3+ ions will replace the ions of Sr2+. A small amount of Eu3+ ions lead to the formation of a minor amount of EuNbO4 for 6 mol% sample, as seen in the XRD pattern in Fig. 1. Also, the increase in positive charge due to the inclusion of Eu3+ ions will affect the lattice charge balance in the lattice.
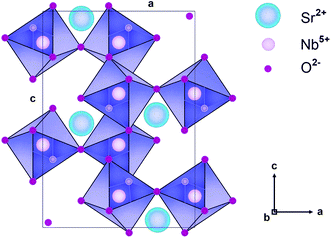 |
| | Fig. 2 Schematic illustration of SrNb2O6 crystal in the direction of the b axis. | |
SEM micrographs of MNb2O6:Eu3+ structures (M = Sr, Cd, Ni) for 3 mol% concentration of Eu3+ are presented in Fig. 3(a–d). SEM micrographs of Eu3+-doped SrNb2O6 are given in Fig. 3(a and b) at 2000× and 20![[thin space (1/6-em)]](https://www.rsc.org/images/entities/char_2009.gif) 000× magnifications, respectively. The grain morphologies with rod-like shapes exhibited the characteristic structure of SrNb2O6.7,8 The thicknesses and lengths of the rods for all the samples varied between 0.06–0.68 and 0.21–12 μm, respectively. The grain shape and size of CdNb2O6:Eu3+ and NiNb2O6Eu3+ differed in the SEM micrographs given in Fig. 3(c and d) and at 20
000× magnifications, respectively. The grain morphologies with rod-like shapes exhibited the characteristic structure of SrNb2O6.7,8 The thicknesses and lengths of the rods for all the samples varied between 0.06–0.68 and 0.21–12 μm, respectively. The grain shape and size of CdNb2O6:Eu3+ and NiNb2O6Eu3+ differed in the SEM micrographs given in Fig. 3(c and d) and at 20![[thin space (1/6-em)]](https://www.rsc.org/images/entities/char_2009.gif) 000× magnification, respectively. While the grains of Eu3+-doped CdNb2O6 were irregular, agglomerated, and plate-like shape, the grain sizes varied in the range of 0.5–4 μm. The grain morphologies of Eu3+-doped NiNb2O6 were round-like shape and relatively less agglomerated, with small grain sizes in the range of 0.1–1 μm. The EDS spectra and elemental compositions (at% and wt%) for 3 mol% Eu3+-doped MNb2O6 (M = Sr, Cd, Ni) samples are given in Fig. 4(a–c), respectively. The EDS atomic compositions (%) of the samples are highly compatible with the theoretical atomic values (%).
000× magnification, respectively. While the grains of Eu3+-doped CdNb2O6 were irregular, agglomerated, and plate-like shape, the grain sizes varied in the range of 0.5–4 μm. The grain morphologies of Eu3+-doped NiNb2O6 were round-like shape and relatively less agglomerated, with small grain sizes in the range of 0.1–1 μm. The EDS spectra and elemental compositions (at% and wt%) for 3 mol% Eu3+-doped MNb2O6 (M = Sr, Cd, Ni) samples are given in Fig. 4(a–c), respectively. The EDS atomic compositions (%) of the samples are highly compatible with the theoretical atomic values (%).
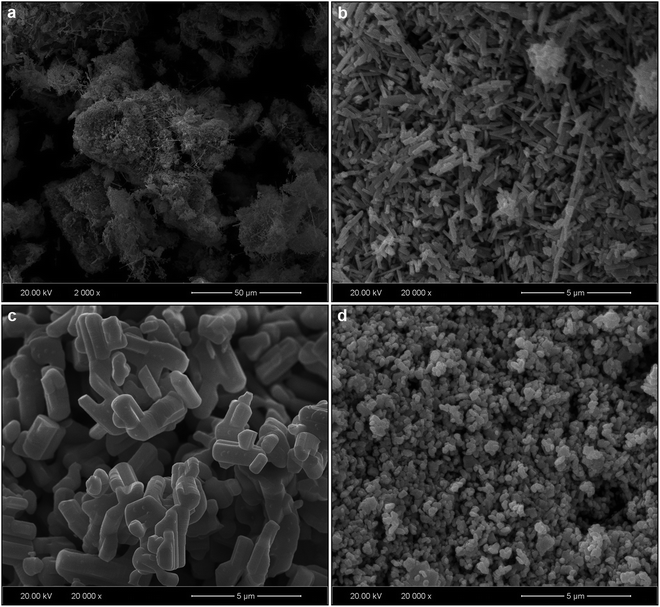 |
| | Fig. 3 SEM results of 3 mol% Eu3+-doped MNb2O6 samples: (a) SEM micrograph for SrNb2O6:Eu3+ at low (2000×) magnification, and SEM micrographs at high (20![[thin space (1/6-em)]](https://www.rsc.org/images/entities/char_2009.gif) 000×) magnification: (b) SrNb2O6:Eu3+, (c) CdNb2O6:Eu3+, and (d) NiNb2O6:Eu3+. 000×) magnification: (b) SrNb2O6:Eu3+, (c) CdNb2O6:Eu3+, and (d) NiNb2O6:Eu3+. | |
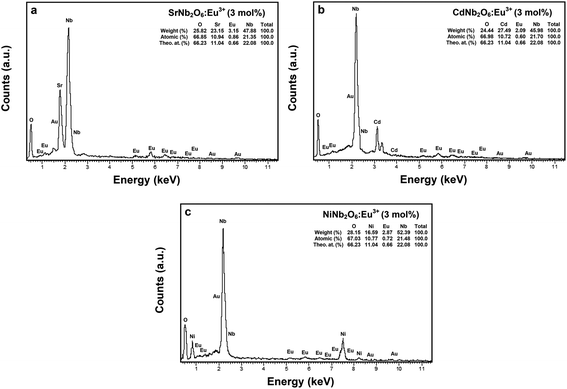 |
| | Fig. 4 EDS elemental compositions (wt%, at%) and theoretical atomic values (%) for 3 mol% Eu3+-doped MNb2O6 samples: (a) SrNb2O6:Eu3+, (b) CdNb2O6:Eu3+, and (c) NiNb2O6:Eu3+. | |
3.2 Photoluminescence and radioluminescence analyses
Fig. 5(a–c) show the CT bands and PL excitations of MNb2O6:Eu3+ (M = Sr, Cd, Ni) phosphors recorded at emission wavelengths of 615.7, 616.2, and 614.0 nm, respectively. PL excitations of the phosphors were assigned to the transitions of 7F0 → 5D4, 7F0 → 5Gj, 7F0 → 5L6, 7F0 → 5D3, and 7F0 → 5D2. The broad CT bands with peak centers at 277.4 nm (SrNb2O6:Eu3+), 276.6 nm (CdNb2O6:Eu3+), and 277.7 nm (NiNb2O6:Eu3+) could be attributed to the Eu3+–O2− charge transfer, which results from the transition of 2p electrons of O2− to the empty 4f orbitals of Eu3+ ion.5,6 Fig. 6(a–c) show the PL emissions of MNb2O6:Eu3+ (M = Sr, Cd, Ni) phosphors monitored at the 5D0 → 7F0, 5D0 → 7F1, 5D0 → 7F2, 5D0 → 7F3, 5D0 → 7F4 transitions with the excitation of 393.6, 463.8, and 394.0 nm, respectively. The PL emissions of the CdNb2O6:Eu3+ and NiNb2O6:Eu3+ increased up to 6 mol%, while the SrNb2O6:Eu3+ emission decreased after 3 mol% due to the concentration quenching or nonradiative energy transfer, which originated from the host defects and the distance RE3+–RE3+.5,6 In all the examples, the emission intensities of the 5D0 → 7F2 (electric dipole) transition were higher than the 5D0 → 7F1 (magnetic dipole) transition. This indicates that the Eu3+ ions occupied crystallographic sites without an inversion center.19,20
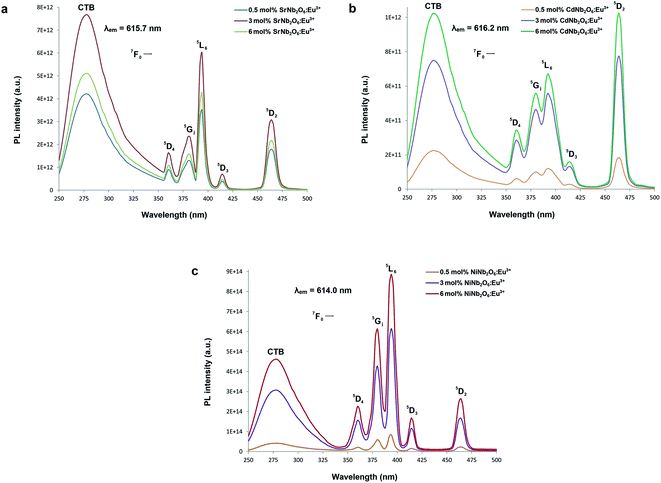 |
| | Fig. 5 PL excitation spectra and charge-transfer bands (CTB) of the phosphors: (a) SrNb2O6:Eu3+, (b) CdNb2O6:Eu3+, and (c) NiNb2O6:Eu3+. | |
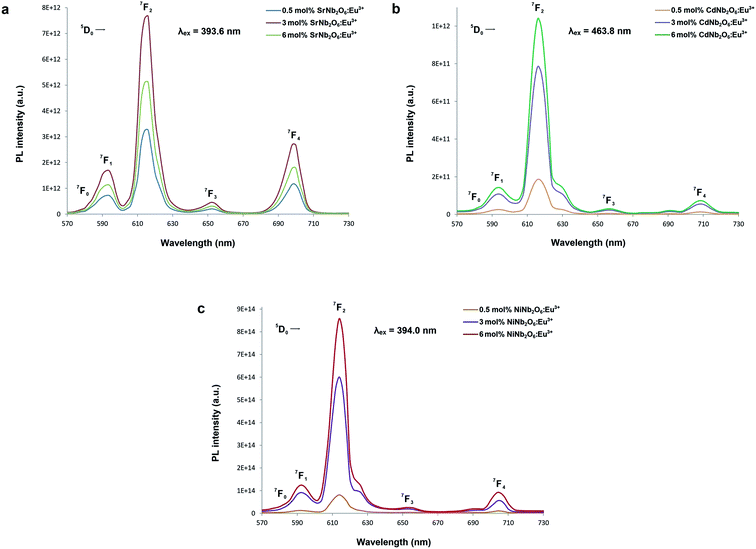 |
| | Fig. 6 PL emission spectra of the phosphors: (a) SrNb2O6:Eu3+, (b) CdNb2O6:Eu3+, and (c) NiNb2O6:Eu3+. | |
The radioluminescence (RL) emissions of MNb2O6:Eu3+ (M = Sr, Cd, Ni) phosphors were monitored with the 5D0 → 7F0, 7F1, 7F2, 7F3, 7F4 transitions under X-ray irradiation, as shown in Fig. 7(a–c). Also, the 5D0 → 7F5 and 5D0 → 7F6 transitions detected with RL are given in the inset figures in Fig. 7(a–c). The RL emissions of the phosphors showed a similarity as in the PL and decreased at 6 mol% of SrNb2O6:Eu3+. Additionally, in the RL emissions of SrNb2O6:Eu3+, an extra intensity increase or asymmetry (R) increase occurred at the 5D0 → 7F2 transition. Therefore both mechanisms could be compared based on the asymmetry, and the R-value variation of PL–RL emissions depending on the Eu3+ concentration is given Fig. 8. The R-values of MNb2O6:Eu3+ (M = Sr, Cd, Ni) phosphors were found to be 4.38–4.44, 6.58–7.13, 5.68–6.78 for PL, and 6.56–7.15, 6.38–7.42, 6.03–6.89 for RL, respectively. The R-value or (5D0 → 7F2)/(5D0 → 7F1) ratio can be used as an indicator to predict the symmetry of the local environment of Eu3+ ion; whereby a high R-value indicates an increase in Eu3+–O2− covalency and a low symmetry/more distorted environment.5 As seen in Fig. 8, the R-values of the PL–RL mechanism for CdNb2O6:Eu3+ and NiNb2O6:Eu3+ were close to each other. However, the R-value of RL for SrNb2O6:Eu3+ was about 50% higher than the R-value of PL. The relatively low asymmetry of SrNb2O6:Eu3+ in PL increased in RL and reached levels close to other phosphors. Although the same basic transitions occur in PL and RL emissions, they do not contribute equally to the excitation mechanisms. X-ray irradiation of RL does not excite the CTB of the host but instead causes the formation of electron–hole pairs in its conduction and valence bands that recombine at the emission center, in which the energy is ultimately deposited.7,21 X-ray irradiation can change the dipole moments and emission spectrum of Eu3+ in the host. Thus, although the symmetry of the Eu3+ local environment decreases to some extent with the high-energy photons of RL, the transformation will likely be temporary and the Eu3+ local environment symmetry will return to its initial state when X-ray irradiation is interrupted.7,21
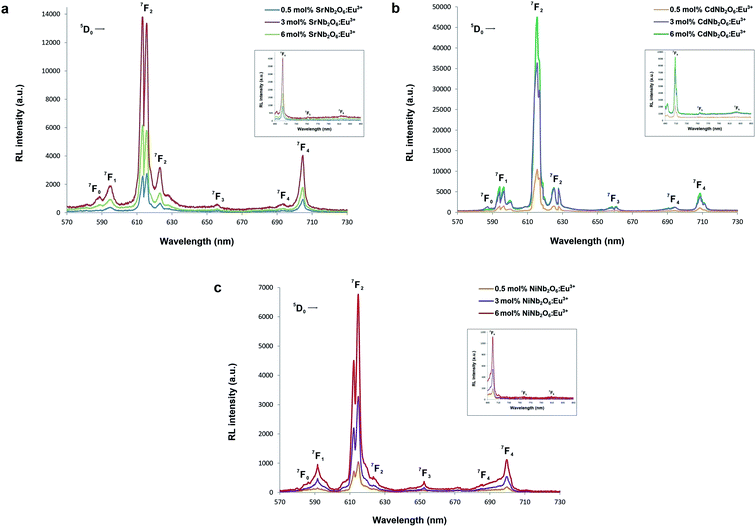 |
| | Fig. 7 RL emission spectra of the phosphors: (a) SrNb2O6:Eu3+, (b) CdNb2O6:Eu3+, and (c) NiNb2O6:Eu3+. The 5D0 → 7Fj (j = 0, 1, 2, 3, 4) transitions between 570–730 nm, and (inset figures) the 5D0 → 7Fj (j = 5, 6) transitions between 690–850 nm. | |
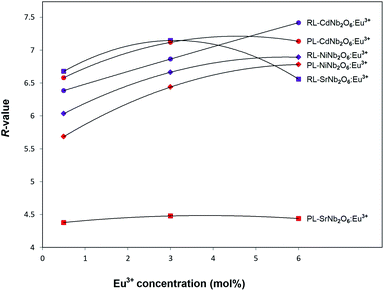 |
| | Fig. 8 R-Value variation for PL and RL mechanisms depending on the Eu3+ concentration. | |
The possible PL and RL mechanisms of MNb2O6:Eu3+ (M = Sr, Cd, Ni) phosphors are schematically illustrated in Fig. 9(a and b), respectively. Fig. 9(a) shows the PL mechanism and indicates the possible pathways in the PL process. Excitation may consist of two processes, either by transferring the valence band electrons to the charge-transfer band (CTB) or by jumping to the higher levels of Eu3+.6 Excitation with charge transfer takes place at 276–278 nm while direct excitation of Eu3+ occurs at 393.6, 463.8, 394.0 nm. After excitation, the excited electrons come to the lowest excited level (5D0) of Eu3+ by a nonradiative transition. Then it can make (5D0 → 7FJ) transitions to the lower levels, in which emissions of Eu3+ would occur. The RL possible mechanism of MNb2O6:Eu3+ (M = Sr, Cd, Ni) phosphors is presented in Fig. 9(b). The electrons of Eu3+ in the ground state (7FJ) promote the conduction band (CB), while the holes stay in the valence band (VB). X-ray induced electrons move in the CB and then part of them transfer to the excitation levels of Eu3+. Also, the formation of traps is possible in the RL mechanism, and a part of the electrons can be captured by the traps, although this is not shown in the figure. Finally, when X-ray-induced electrons move to the ground state, they would be released at the appropriate energy level in which RL emissions take place with the recombination of the electrons and holes.
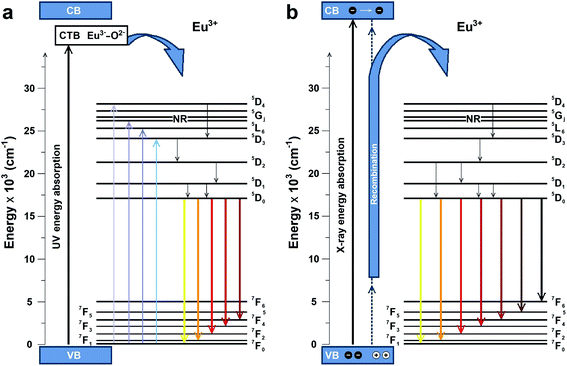 |
| | Fig. 9 Schematic energy level diagram to illustrate the possible (a) PL and (b) RL mechanisms. | |
3.3. Judd–Ofelt analysis and radiative properties
Judd–Ofelt (JO) intensity parameters are critical to evaluate the performance of luminescent materials.22,23 Among the RE3+ ions, Eu3+ has a unique feature for calculation of the JO intensity parameters due to the magnetic dipole transition (5D0 → 7F1) which is independent of the environment and can be used as a reference for transitions arising from the 5D0 level. Using the emission spectra for Eu3+-doped materials, the JO intensity parameters ΩJ (J = 2, 4, 6) can be calculated by eqn (1):24| |
 | (1) |
where V1, VJ and I1, IJ are the frequencies and integrated intensities of the 7F1 and 7FJ (J = 2, 4, 6) transitions respectively, e = 4.803 × 10⁻¹⁰ esu (1 esu = N−5/2 cm = gr1/2 cm3/2 s−1) is the elementary charge, n is the refractive index, SMD = 9.6 × 10−42 esu2 cm2 is the line strength of the magnetic dipole, which was taken from ref. 24, and |〈J‖UJ‖J〉|2 represent the double-reduced matrix elements of the unit tensor operators, which are independent of the local environment of the ion. All the reduced matrix elements (|〈J‖UJ‖J′〉|2) for electric-dipole (ED) transitions arising from the 5D0 level are zero, except for the levels 7FJ, (where J = 2, 4, 6) U2 = 0.0032, U4 = 0.0023, and U6 = 0.0002.24 The 5D0 → 7FJ (J = 1, 2, 4, 6) transitions are used in the calculation of the JO parameters for the radiative transition probability. However, the 5D0 → 7FJ (J = 0, 3, 5) transitions are forbidden and are not included in the determination of the transition probabilities.24 According to Judd–Ofelt theory, the spontaneous transition probability (A) is related to its magnetic dipole strength (SMD) and electric-dipole strength (SED), which can be calculated by eqn (2):22,23| |
 | (2) |
where J is the total angular momentum of the initial state, and h is Planck's constant. The electric-dipole line strengths (SED) can be calculated from the JO parameters by eqn (3):7| |
 | (3) |
where |〈J‖UJ‖J〉|2 is the symbol of the squared reduced matrix elements, and χED and χMD are the local field corrections for the ED and MD transitions, which can be found by eqn (4) and (5), respectively:| |
 | (4) |
where n is the refractive index. The n = 1.854 value for SrNb2O6 was taken from ref. 7. The n value for CdNb2O6 and NiNb2O6 can be estimated from the Lorenz–Lorentz formula eqn (6):25–29| |
 | (6) |
where M is the molar mass of the compound, li is the atomic number of the element in the nominal chemical formula of the compound, ρ is the density, and ri is the specific refraction of the compound. The refraction index (n) values for CdNb2O6 and NiNb2O6 were determined as 1.958 and 2.003, respectively.
The spectral results of the phosphors, JO intensity parameters (Ω2, Ω4), radiative transition probabilities (A(J,J′)), and total radiative transition probabilities ( or Ar) are given in Table 1. The Ω2 parameter shows the short-range effects, while the Ω4 parameter shows the long-range effects.25,31 The effects of the Ω2 parameter are short-range and are associated with the covalence and environmental changes of the Eu3+ ion symmetry.19,20 The high value of Ω2 or the trend Ω2 > Ω4 is evaluated to show the high covalence of the Eu3+–O2− bond character (ionic or covalent) and the high asymmetry or distortion of the local symmetry of Eu3+ sites.7,31 Accordingly, a high Ω2 parameter or Ω2 > Ω4 tendency for all the phosphors can be attributed to the low symmetry Eu3+ ion and the more covalent or less ionic character of the Eu3+–O2− bond. On the other hand, the effects of the Ω4 parameter are long-range and are not directly related to the symmetry of the Eu3+ ion, but the electron density on the surrounding ligands.30,31 In all phosphors, the parameter of Ω4 decreased with increasing Eu3+ concentration, which indicated an increase in electron density in the ligands.
Table 1 J–O parameters (Ω2, Ω4), radiative transition and total transition probabilities (A(J,J′), (Ar)), branching ratios ((βcal), (βexp)), and branching ratio differences (%) of the MNb2O6:Eu3+ (M = Sr, Cd, Ni) phosphors
| Phosphor |
Eu3+ conc. (mol%) |
Eu3+ transitions |
Ω2 (10−20 cm2) |
Ω4 (10−20 cm2) |
A(J,J′) (s−1) |
Ar (s−1) |
βcal (%) |
βexp (%) |
Difference (%) |
| SrNb2O6:Eu3+ |
0.5 |
5D0 → 7F1 |
7.148 |
5.837 |
92.101 |
694.935 |
13.25 |
14.13 |
6.20 |
| 5D0 → 7F2 |
429.055 |
61.74 |
63.24 |
2.37 |
| 5D0 → 7F4 |
173.779 |
25.01 |
22.63 |
9.49 |
| 3 |
5D0 → 7F1 |
7.209 |
5.818 |
92.026 |
697.946 |
13.19 |
14.05 |
6.16 |
| 5D0 → 7F2 |
432.719 |
61.99 |
63.49 |
2.35 |
| 5D0 → 7F4 |
173.201 |
24.82 |
22.46 |
9.50 |
| 6 |
5D0 → 7F1 |
7.172 |
5.779 |
92.194 |
694.717 |
13.27 |
14.15 |
6.80 |
| 5D0 → 7F2 |
430.474 |
61.96 |
63.44 |
2.33 |
| 5D0 → 7F4 |
172.049 |
24.77 |
22.41 |
9.52 |
| CdNb2O6:Eu3+ |
0.5 |
5D0 → 7F1 |
7.360 |
1.513 |
107.954 |
699.085 |
15.44 |
16.09 |
4.04 |
| 5D0 → 7F2 |
538.924 |
77.09 |
77.40 |
0.39 |
| 5D0 → 7F4 |
52.207 |
7.47 |
6.51 |
12.78 |
| 3 |
5D0 → 7F1 |
7.788 |
1.396 |
107.933 |
726.332 |
14.86 |
15.47 |
3.95 |
| 5D0 → 7F2 |
570.238 |
78.51 |
78.75 |
0.31 |
| 5D0 → 7F4 |
48.161 |
6.63 |
5.78 |
12.86 |
| 6 |
5D0 → 7F1 |
7.852 |
1.388 |
107.916 |
730.720 |
14.77 |
15.37 |
3.94 |
| 5D0 → 7F2 |
574.902 |
78.67 |
78.92 |
0.30 |
| 5D0 → 7F4 |
47.902 |
6.56 |
5.71 |
12.86 |
| NiNb2O6:Eu3+ |
0.5 |
5D0 → 7F1 |
8.529 |
3.235 |
116.395 |
926.132 |
12.57 |
13.19 |
4.75 |
| 5D0 → 7F2 |
685.886 |
74.06 |
75.00 |
1.25 |
| 5D0 → 7F4 |
123.851 |
13.37 |
11.81 |
11.72 |
| 3 |
5D0 → 7F1 |
9.658 |
2.270 |
116.375 |
979.958 |
11.88 |
12.40 |
4.21 |
| 5D0 → 7F2 |
776.661 |
79.25 |
79.82 |
0.70 |
| 5D0 → 7F4 |
86.922 |
8.87 |
7.79 |
12.21 |
| 6 |
5D0 → 7F1 |
10.023 |
2.726 |
116.340 |
1043.388 |
11.15 |
11.66 |
4.37 |
| 5D0 → 7F2 |
822.662 |
78.85 |
79.54 |
0.88 |
| 5D0 → 7F4 |
104.386 |
10.00 |
8.80 |
12.06 |
The branching ratio (β or βcal) of the Judd–Ofelt theory can be found from the radiative transition probability (A(J,J′)) and total radiative transition probability  by eqn (7):7
| |
 | (7) |
The branching ratios (βcal) of 5D0 → 7F2 transition for CdNb2O6:Eu3+ and NiNb2O6:Eu3+ were found as 77.09–78.67% and 74.06–79.25%, respectively. The SrNb2O6:Eu3+ had a relatively low branching ratio ranging from 61.74–61.99%, for which the results are given in Table 1. The βcal values of the 5D0 → 7F2 transition for all phosphors were over 60%. The high value of branching ratio (β > 50) indicated a potential laser emission.7,24 The branching ratios (βcal) of the Judd–Ofelt theory can be evaluated using experimental branching ratios (βexp), which can be obtained directly from the emission spectrum. On the other hand, the intrinsic error of the Judd–Ofelt theory in describing spectral intensities is usually about 15%.7,32 Accordingly, differences between the experimental (βexp) and calculated values (βcal) for all samples occurred between 0.3–12.86%, and they were all below 15% (Table 1).
In the Judd–Ofelt calculation, the Ω2 and Ω4 parameters were used, but the Ω6 parameter was not included since the 5D0 → 7F6 transition remaining in the infrared region could not be detected by PL. Similar studies have been reported using the Ω2 and Ω4 parameters for JO calculations.24,30 The 5D0 → 7F6 transition outside the visible spectrum is very weak in many materials.24 In this study, the weak intensity of the 5D0 → 7F6 transition detected by RL in Fig. 7(a–c) supports this situation. Based on the 5D0 → 7F6 transition observed by RL, the Ω6 parameters were determined for the samples with the highest emissions intensity. The Ω6 parameters and total radiative transition probabilities ( or Ar) of the 5D0 → 7F6 transition were estimated as 2.226 × 10⁻²⁰, 1.103 × 10⁻²⁰, 0.155 × 10⁻²⁰ cm2, and 3.636, 2.116, 0.341 s−1 for 3 mol% (SrNb2O6:Eu3+), 6 mol% (CdNb2O6:Eu3+), 6 mol% (NiNb2O6:Eu3+), respectively. The branching ratios (βcal) of the 5D0 → 7F6 transition (or the ratio of the 5D0 → 7F6 transition probability to the total radiative transition probability) were found in the range of 0.03–0.52%. Also, the branching ratios (βexp) of the 5D0 → 7F6 transition from the emission spectra were between 0.18–0.40%. Accordingly, based on the determination of the branching ratios using the RL spectra, the effect of the 5D0 → 7F6 transition on the quantum efficiency or other radiative parameters was negligibly minimal, and its exclusion will not have a significant effect.
Fig. 10(a–c) show the decay curves of MNb2O6:Eu3+ (M = Sr, Cd, Ni) phosphors for 5D0 → 7F2 transitions (λem = 615.7, 616.2, 614.0 nm) recorded with excitations at 393.6, 463.8, and 394.0 nm, respectively. The observed lifetime or average decay (τ) curves can be established by the following two-time temporal dependence in eqn (8):6
| |
 | (8) |
where the luminescence intensities are
IL(t) and
IL(0), the fitting constants are
B1 and
B2, and the short and long lifetimes for the exponential components are
τ1 and
τ2 respectively. The average (observed) lifetime (
τ) can be calculated through
eqn (9) according to the variables in
eqn (8):
6| |
 | (9) |
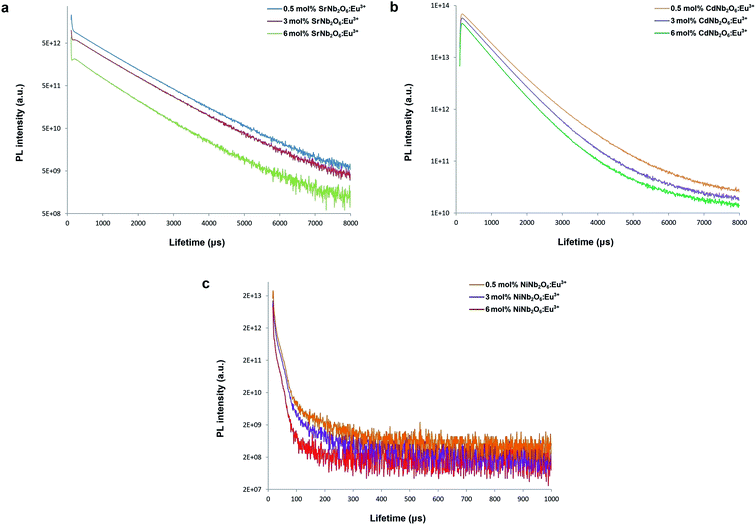 |
| | Fig. 10 PL lifetime curves for 5D0 → 7F2 transition of the phosphors: (a) SrNb2O6:Eu3+, (b) CdNb2O6:Eu3+, and (c) NiNb2O6:Eu3+. | |
The observed lifetimes (τ) of the MNb2O6:Eu3+ (M = Sr, Cd, Ni) phosphors for the 5D0 level varied from 914.36, 673.35, 119.08 to 828.69, 573.29, 113.75 μm, respectively (Table 2). The observed lifetime (τ) represents the sum of nonradiative (τnr) and the radiative (τr) lifetimes, which are expressed by eqn (10). The value of the radiative (experimental) lifetime (τr) can be determined from the total radiative transition probability (Ar) by eqn (11):
| |
 | (11) |
Table 2 The radiative lifetimes (τr), theoretical radiative lifetimes (τth), observed lifetimes (τ), quantum efficiencies (ηQE), theoretical quantum efficiencies (ηthQE), and quantum efficiency differences (%) of the MNb2O6:Eu3+ (M = Sr, Cd, Ni) phosphors
| Phosphor |
Eu3+ conc. (mol%) |
τr (μs) |
τth (μs) |
τ (μs) |
ηQE (%) |
ηthQE (%) |
Difference (%) |
| SrNb2O6:Eu3+ |
0.5 |
1438.98 |
1429.07 |
914.36 |
63.54 |
63.98 |
0.69 |
| 3 |
1432.78 |
1426.16 |
886.52 |
61.87 |
62.16 |
0.46 |
| 6 |
1439.43 |
1433.49 |
828.69 |
57.57 |
57.81 |
0.41 |
| CdNb2O6:Eu3+ |
0.5 |
1430.44 |
1344.79 |
673.35 |
47.07 |
50.07 |
5.99 |
| 3 |
1376.78 |
1308.06 |
609.02 |
44.24 |
46.56 |
4.99 |
| 6 |
1368.51 |
1302.47 |
573.29 |
41.89 |
44.02 |
4.83 |
| NiNb2O6:Eu3+ |
0.5 |
1080.76 |
1002.41 |
119.08 |
11.03 |
11.88 |
7.16 |
| 3 |
1020.45 |
989.21 |
115.91 |
11.36 |
11.72 |
3.06 |
| 6 |
958.42 |
930.47 |
113.75 |
11.87 |
12.22 |
2.92 |
The radiative lifetime can also be found theoretically by direct calculation from eqn (12), which is related to the emission spectrum of Eu3+.24,32
| |
 | (12) |
where
τth is the theoretical radiative lifetime,
I1 is the integrated intensity of the
5D
0 →
7F
1 transition,
Itot is the total integrated intensity, and
n is the refractive index. The quantum efficiency (
ηQE) of a phosphor can be defined by the ratio of the number of photons emitted (observed lifetime:
τ) to the number of photons absorbed (radiative lifetimes:
τr). Accordingly, the quantum efficiency (
ηQE) and theoretical quantum efficiency (
ηthQE) can be determined by
eqn (13) and
(14), respectively:
| |
 | (13) |
| |
 | (14) |
A comparison of the radiative lifetimes (τr, τth) and quantum efficiencies (ηQE, ηthQE) of MNb2O6:Eu3+ (M = Sr, Cd, Ni) phosphors was performed and the results are given in Table 2. The ηQE% values for the SnNb2O6:Eu3+ and CdNb2O6:Eu3+ were estimated as follows: 57.57–63.54% and 41.89–47.07%, respectively. However, the ηQE% value of NiNb2O6:Eu3+ showed a low efficiency and varied between 11.22–11.88%. The differences of the ηQE% (calculated-JO) and ηthQE (theoretical) for SnNb2O6:Eu3+ varied between 0.41–0.69%, whereas the compatibility of the efficiencies for CdNb2O6:Eu3+ and NiNb2O6:Eu3+ decreased somewhat and the difference varied between 4.83–5.99 and 2.92–7.16, respectively (Table 2).
The stimulated emission cross-section (σe) is an important factor to predict the laser performance of a material. The stimulated emission cross-section (σe) between the states J and J′ having a probability of A(J,J′) is given by eqn (15):7,20
| |
 | (15) |
where
c is the velocity of light,
λp is the emission peak wavelength, Δ
λeff is the effective bandwidth of the emission transition and
n is the refractive index of the matrix. The stimulated emission cross-section (
σe), gain bandwidth (
σe × Δ
λeff), the effective bandwidth of emission transition (Δ
λeff), and the optical gain (
σe ×
τ) results are given in
Table 3. The large
σe value for the potential laser performance at room temperature is an attractive feature for low threshold and high gain laser applications.
7 The
σe parameters of the MNb
2O
6:Eu
3+ (M = Sr, Cd, Ni) phosphors were found as
7F
2 >
7F
4 >
7F
1. The product of the
σe and Δ
λeff is another important parameter and helps predict the gain bandwidth (
σe × Δ
λeff) of the optical amplifier. The high values of the product are better for the performance of the amplifier.
7 The gain bandwidths (
σe × Δ
λeff) of the MNb
2O
6:Eu
3+ (M = Sr, Cd, Ni) phosphors with the highest emission were determined as follows: 24.182 × 10
−28, 28.674 × 10
−28, and 38.647 × 10
−28 cm
3, respectively, corresponding to
5D
0 →
7F
2 transition. The product of the
σe and observed lifetime (
τ) is an important consideration for high optical amplifier gain.
7,33 The optical gains (
σe ×
τ) of MNb
2O
6:Eu
3+ (M = Sr, Cd, Ni) varied between 19.283–21.750 × 10
−25, 13.790–15.859 × 10
−25, and 3.518–3.987 × 10
−25 cm
2 s, respectively. The large values of the stimulated emission cross-section, gain bandwidth, optical gain, and lifetime support that MNb
2O
6:Eu
3+ (M = Sr, Cd, Ni) phosphors can be helpful for the improvement of the red lasing and red color applications for display devices.
Table 3 The effective bandwidth of the emission transitions (Δλeff), stimulated emission cross-sections (σe), gain bandwidths (σe × Δλeff), and optical gains (σe × τ) of the MNb2O6:Eu3+ (M = Sr, Cd, Ni) phosphors
| Phosphor |
Eu3+ conc. (mol%) |
Eu3+ transitions |
Δλeff (nm) |
σe (×10−22 cm2) |
σe × Δλeff (×10−28 cm3) |
σe × τ (×10−25 cm2 s) |
| SrNb2O6:Eu3+ |
0.5 |
5D0 → 7F1 |
12.10 |
3.627 |
4.388 |
|
| 5D0 → 7F2 |
10.08 |
23.788 |
23.977 |
21.750 |
| 5D0 → 7F4 |
11.03 |
14.452 |
15.933 |
|
| 3 |
5D0 → 7F1 |
12.15 |
3.613 |
4.389 |
|
| 5D0 → 7F2 |
10.49 |
23.057 |
24.182 |
20.441 |
| 5D0 → 7F4 |
11.21 |
14.161 |
15.880 |
|
| 6 |
5D0 → 7F1 |
12.12 |
3.618 |
4.387 |
|
| 5D0 → 7F2 |
10.34 |
23.269 |
24.056 |
19.283 |
| 5D0 → 7F4 |
11.13 |
14.168 |
15.775 |
|
| CdNb2O6:Eu3+ |
0.5 |
5D0 → 7F1 |
14.36 |
3.233 |
4.641 |
|
| 5D0 → 7F2 |
11.41 |
23.552 |
26.880 |
15.859 |
| 5D0 → 7F4 |
12.42 |
3.683 |
4.574 |
|
| 3 |
5D0 → 7F1 |
15.19 |
3.055 |
4.642 |
|
| 5D0 → 7F2 |
11.50 |
24.727 |
28.442 |
15.059 |
| 5D0 → 7F4 |
12.80 |
3.297 |
4.219 |
|
| 6 |
5D0 → 7F1 |
15.85 |
2.929 |
4.643 |
|
| 5D0 → 7F2 |
11.92 |
24.055 |
28.674 |
13.790 |
| 5D0 → 7F4 |
12.91 |
3.251 |
4.197 |
|
| NiNb2O6:Eu3+ |
0.5 |
5D0 → 7F1 |
12.96 |
3.657 |
4.737 |
|
| 5D0 → 7F2 |
10.91 |
29.546 |
32.222 |
3.518 |
| 5D0 → 7F4 |
9.11 |
11.060 |
10.081 |
|
| 3 |
5D0 → 7F1 |
13.39 |
3.537 |
4.737 |
|
| 5D0 → 7F2 |
10.90 |
33.487 |
36.486 |
3.881 |
| 5D0 → 7F4 |
9.63 |
7.345 |
7.075 |
|
| 6 |
5D0 → 7F1 |
13.49 |
3.512 |
4.738 |
|
| 5D0 → 7F2 |
11.03 |
35.054 |
38.647 |
3.987 |
| 5D0 → 7F4 |
10.93 |
7.777 |
8.497 |
|
4. Conclusion
MNb2O6:Eu3+ (M = Sr, Cd, Ni) crystal powders synthesized by the molten salt method have an orthorhombic/monoclinic symmetry. SEM micrographs of Eu3+-doped SrNb2O6 exhibited characteristic nanorods for the grain structure, while the grain morphologies of Eu3+-doped CdNb2O6 and NiNb2O6 differed in size and shape. The emissions of the phosphors were monitored in PL and RL with the 5F0 → 7FJ (J = 0–4) and 5F0 → 7FJ (J = 0–6) transitions of Eu3+, respectively. The RL emissions of SrNb2O6:Eu3+ exhibited an extra increase at the 5D0 → 7F2 (electric dipole) transition, which was related to the decrease in local symmetry of Eu3+; however, this same effect was not seen for CdNb2O6:Eu3+ and NiNb2O6:Eu3+. By determining the Judd–Ofelt intensity parameters (Ω2, Ω4) from the emission spectrum, we calculated the radiative transition probabilities (A(J,J′)), branching ratios (βcal), and radiative lifetimes (τr). The branching ratio difference of the measured (βexp) from the emission spectrum and that calculated (βcal) from the JO parameters for all samples varied by 0.3–12.86%, which were all less than 15%. The high Ω2 value or Ω2 > Ω4 tendency for all the phosphors indicated the low symmetry Eu3+ ion and the more covalent character of the Eu3+–O2− bond. The order of quantum efficiencies (ηQE%) was found to be: SrNb2O6:Eu3+ > CdNb2O6:Eu3+ > NiNb2O6:Eu3+. The quantum efficiencies (ηQE) of the phosphors deviated slightly from the theoretically calculated quantum efficiencies (ηthQE). The bandwidths (σe × Δλeff) and optical gains (σe × τ) were found to follow the trend: SrNb2O6:Eu3+ < CdNb2O6:Eu3+ < NiNb2O6:Eu3+ and SrNb2O6:Eu3+ > CdNb2O6:Eu3+ > NiNb2O6:Eu3+, respectively. These results point out that MNb2O6:Eu3+ (M = Sr, Cd, Ni) phosphors with strong emissions at 5D0 → 7F2 transition could be interesting candidates for RE-doped red phosphor applications and for future study.
Conflicts of interest
There are no conflicts to declare.
Acknowledgements
We would like to thank to Marmara University Research Fund (Project No: FEN-A–110718–0393) for the financial support for this study.
References
- S. Saha, S. Das, U. K. Ghorai, N. Mazumder, B. K. Gupta and K. K. Chattopadhyay, Dalton Trans., 2013, 42, 12965–12974 RSC.
- C. Yu, B. Chen, X. Zhang, X. Li, J. Zhang, S. Xu, H. Yu, J. Sun, Y. Cao and H. Xia, Phys. Chem. Chem. Phys., 2020, 22, 7844–7852 RSC.
- Y. Zhang, B. Chen, S. Xu, X. Li, J. Zhang, J. Sun, X. Zhang, H. Xia and R. Hua, Phys. Chem. Chem. Phys., 2018, 20, 15876–15883 RSC.
- B. Tian, B. Chen, Y. Tian, X. Li, J. Zhang, J. Sun, H. Zhong, L. Cheng, S. Fu, H. Zhong, Y. Wang, X. Zhang, H. Xiac and R. Hua, J. Mater. Chem. C, 2013, 1, 2338–2344 RSC.
- M. İlhan, Synthesis, Int. J. Appl. Ceram. Technol., 2017, 14, 1134–1143 CrossRef.
- M. İlhan and İ. Ç. Keskin, Dalton Trans., 2018, 47, 13939–13948 RSC.
- M. İlhan and İ. Ç. Keskin, Phys. Chem. Chem. Phys., 2020, 22, 19769–19778 RSC.
- M. K. Ekmekçi, M. İlhan, A. Ege and M. Ayvacıklı, J. Fluoresc., 2017, 27, 973–979 CrossRef PubMed.
- J. Xue, Y. Guo, B. K. Moon, S. H. Park, J. H. Jeong, J. H. Kim and L. Wang, Opt. Mater., 2017, 66, 220–229 CrossRef CAS.
- R. C. Ropp, Encyclopedia of the Alkaline Earth Compounds, Elsevier Publications, Oxford, UK, 2013 Search PubMed.
- I. S. Cho, S. Lee, J. H. Noh, D. W. Kim, D. K. Lee, H. S. Jung, D. W. Kim and K. S. Hong, J. Mater. Chem., 2010, 20, 3979–3983 RSC.
- K. N. Singh and P. K. Bajpai, World J. Condens. Matter Phys., 2011, 1, 37–48 CrossRef CAS.
- M. K. Ekmekçi, M. Erdem, M. İlhan, A. S. Başak and A. Mergen, Optik, 2016, 127, 1918–1921 CrossRef.
- M. K. Ekmekçi, M. Erdem, A. S. Başak, M. İlhan and A. Mergen, Ceram. Int., 2015, 127, 9680–9685 CrossRef.
- M. G. B. Drew, R. J. Hobson and V. T. Padayatchy, J. Mater. Chem., 1993, 3, 889–892 RSC.
- M. Sato and Y. J. Hama, J. Solid State Chem., 1995, 118, 193–198 CrossRef CAS.
- I. S. Cho, S. Lee, J. H. Noh, D. W. Kim, H. S. Jung, D. W. Kim and K. S. Hong, Cryst. Growth Des., 2010, 10, 2447–2450 CrossRef CAS.
- K. L. Keester, R. R. Neurgaonkar, T. C. Lim and E. J. Staples, Mater. Res. Bull., 1980, 15, 821–826 CrossRef CAS.
- R. G. A. Kumar, S. Hata, K. Ikeda and K. G. Gopchandran, RSC Adv., 2016, 6, 67295–67307 RSC.
- R. Saraf, C. Shivakumara, S. Behera, H. Nagabhushana and N. Dhananjaya, RSC Adv., 2015, 5, 4109–4120 RSC.
- K. Wahid, M. Pokhrel and Y. Mao, J. Solid State Chem., 2017, 245, 89–97 CrossRef CAS.
- B. R. Judd, Phys. Rev., 1962, 127, 750 CrossRef CAS.
- G. S. Ofelt, J. Chem. Phys., 1962, 37, 511 CrossRef CAS.
- A. Ćirić, S. Stojadinović, M. Sekulić and M. D. Dramićanin, J. Lumin., 2019, 205, 351–356 CrossRef.
- M. Born and E. Wolf, Principles of Optics, Pergamon Press, Oxford, London, Edinburg, New York, Paris, Frankfurt, 1968 Search PubMed.
- S. S. Batsanov, Structurnaya refractometria, Visshaya Shkola, Moscow, 1976 Search PubMed.
- R. D. Shannon and R. X. Fischer, Phys. Rev. B: Condens. Matter Mater. Phys., 2006, 73, 235111 CrossRef.
- G. B. Bokii and M. A. P. Koshits, X-ray Structure Analysis, MSU, Moscow, 1964 Search PubMed.
- A. S. Korotkov and V. V. Atuchin, Opt. Commun., 2008, 281, 2132 CrossRef CAS.
- M. İlhan and İ. Ç. Keskin, Physica B, 2020, 85, 412106 CrossRef.
- S. Dutta, S. Som and S. K. Sharma, RSC Adv., 2018, 8, 53–67 RSC.
- M. H. V. Werts, R. T. F. Jukes and J. W. Verhoeven, Phys. Chem. Chem. Phys., 2002, 4, 1542–1548 RSC.
- R. J. M. Gopinath, S. Gopi, S. M. Simon, A. C. Saritha, P. R. Biju, C. Joseph and N. V. Unnikrishnan, RSC Adv., 2020, 10, 20057–20066 RSC.
|
| This journal is © The Royal Society of Chemistry 2021 |
Click here to see how this site uses Cookies. View our privacy policy here.  Open Access Article
 *a,
Mete Kaan Ekmekçib and
İlker Çetin Keskinc
![[thin space (1/6-em)]](https://www.rsc.org/images/entities/char_2009.gif) :
:![[thin space (1/6-em)]](https://www.rsc.org/images/entities/char_2009.gif) KCl, salt
KCl, salt![[thin space (1/6-em)]](https://www.rsc.org/images/entities/char_2009.gif) :
:![[thin space (1/6-em)]](https://www.rsc.org/images/entities/char_2009.gif) salt molar ratio 6
salt molar ratio 6![[thin space (1/6-em)]](https://www.rsc.org/images/entities/char_2009.gif) :
:![[thin space (1/6-em)]](https://www.rsc.org/images/entities/char_2009.gif) 1 and salt
1 and salt![[thin space (1/6-em)]](https://www.rsc.org/images/entities/char_2009.gif) :
:![[thin space (1/6-em)]](https://www.rsc.org/images/entities/char_2009.gif) oxide weight ratio 1
oxide weight ratio 1![[thin space (1/6-em)]](https://www.rsc.org/images/entities/char_2009.gif) :
:![[thin space (1/6-em)]](https://www.rsc.org/images/entities/char_2009.gif) 1, for cadmium niobate synthesis, Li2SO4
1, for cadmium niobate synthesis, Li2SO4![[thin space (1/6-em)]](https://www.rsc.org/images/entities/char_2009.gif) :
:![[thin space (1/6-em)]](https://www.rsc.org/images/entities/char_2009.gif) Na2SO4, salt
Na2SO4, salt![[thin space (1/6-em)]](https://www.rsc.org/images/entities/char_2009.gif) :
:![[thin space (1/6-em)]](https://www.rsc.org/images/entities/char_2009.gif) salt molar ratio 1
salt molar ratio 1![[thin space (1/6-em)]](https://www.rsc.org/images/entities/char_2009.gif) :
:![[thin space (1/6-em)]](https://www.rsc.org/images/entities/char_2009.gif) 1 and salt
1 and salt![[thin space (1/6-em)]](https://www.rsc.org/images/entities/char_2009.gif) :
:![[thin space (1/6-em)]](https://www.rsc.org/images/entities/char_2009.gif) oxide weight ratio 1
oxide weight ratio 1![[thin space (1/6-em)]](https://www.rsc.org/images/entities/char_2009.gif) :
:![[thin space (1/6-em)]](https://www.rsc.org/images/entities/char_2009.gif) 1, for nickel niobate synthesis, Li2SO4
1, for nickel niobate synthesis, Li2SO4![[thin space (1/6-em)]](https://www.rsc.org/images/entities/char_2009.gif) :
:![[thin space (1/6-em)]](https://www.rsc.org/images/entities/char_2009.gif) Na2SO4, salt
Na2SO4, salt![[thin space (1/6-em)]](https://www.rsc.org/images/entities/char_2009.gif) :
:![[thin space (1/6-em)]](https://www.rsc.org/images/entities/char_2009.gif) salt molar ratio 1
salt molar ratio 1![[thin space (1/6-em)]](https://www.rsc.org/images/entities/char_2009.gif) :
:![[thin space (1/6-em)]](https://www.rsc.org/images/entities/char_2009.gif) 1 and salt
1 and salt![[thin space (1/6-em)]](https://www.rsc.org/images/entities/char_2009.gif) :
:![[thin space (1/6-em)]](https://www.rsc.org/images/entities/char_2009.gif) oxide weight ratio 1
oxide weight ratio 1![[thin space (1/6-em)]](https://www.rsc.org/images/entities/char_2009.gif) :
:![[thin space (1/6-em)]](https://www.rsc.org/images/entities/char_2009.gif) 1. The starting materials for each compound group were mixed to produce the phosphor powders by the molten salt synthesis method and finely ground in an agate mortar to ensure homogeneity. After that, europium oxide (Eu2O3) dopant was added. The final powder mixture was thoroughly mixed in an agate mortar for a final time and re-ground to ensure greater homogeneity. Then, mixtures prepared by weighing for each compound were placed and calcined in alumina crucibles at 650 °C for 4 h for strontium niobate, or at 900 °C for 4 h for cadmium niobate and nickel niobate. Phosphor powders obtained as a result of the heat treatment were washed many times with ultrapure water to remove the ionic salts they contained and vacuum filtered several times. The presence of Cl-ions in the filtrate was checked using qualitative reactions.
1. The starting materials for each compound group were mixed to produce the phosphor powders by the molten salt synthesis method and finely ground in an agate mortar to ensure homogeneity. After that, europium oxide (Eu2O3) dopant was added. The final powder mixture was thoroughly mixed in an agate mortar for a final time and re-ground to ensure greater homogeneity. Then, mixtures prepared by weighing for each compound were placed and calcined in alumina crucibles at 650 °C for 4 h for strontium niobate, or at 900 °C for 4 h for cadmium niobate and nickel niobate. Phosphor powders obtained as a result of the heat treatment were washed many times with ultrapure water to remove the ionic salts they contained and vacuum filtered several times. The presence of Cl-ions in the filtrate was checked using qualitative reactions.
![[thin space (1/6-em)]](https://www.rsc.org/images/entities/char_2009.gif) 000× magnifications, respectively. The grain morphologies with rod-like shapes exhibited the characteristic structure of SrNb2O6.7,8 The thicknesses and lengths of the rods for all the samples varied between 0.06–0.68 and 0.21–12 μm, respectively. The grain shape and size of CdNb2O6:Eu3+ and NiNb2O6Eu3+ differed in the SEM micrographs given in Fig. 3(c and d) and at 20
000× magnifications, respectively. The grain morphologies with rod-like shapes exhibited the characteristic structure of SrNb2O6.7,8 The thicknesses and lengths of the rods for all the samples varied between 0.06–0.68 and 0.21–12 μm, respectively. The grain shape and size of CdNb2O6:Eu3+ and NiNb2O6Eu3+ differed in the SEM micrographs given in Fig. 3(c and d) and at 20![[thin space (1/6-em)]](https://www.rsc.org/images/entities/char_2009.gif) 000× magnification, respectively. While the grains of Eu3+-doped CdNb2O6 were irregular, agglomerated, and plate-like shape, the grain sizes varied in the range of 0.5–4 μm. The grain morphologies of Eu3+-doped NiNb2O6 were round-like shape and relatively less agglomerated, with small grain sizes in the range of 0.1–1 μm. The EDS spectra and elemental compositions (at% and wt%) for 3 mol% Eu3+-doped MNb2O6 (M = Sr, Cd, Ni) samples are given in Fig. 4(a–c), respectively. The EDS atomic compositions (%) of the samples are highly compatible with the theoretical atomic values (%).
000× magnification, respectively. While the grains of Eu3+-doped CdNb2O6 were irregular, agglomerated, and plate-like shape, the grain sizes varied in the range of 0.5–4 μm. The grain morphologies of Eu3+-doped NiNb2O6 were round-like shape and relatively less agglomerated, with small grain sizes in the range of 0.1–1 μm. The EDS spectra and elemental compositions (at% and wt%) for 3 mol% Eu3+-doped MNb2O6 (M = Sr, Cd, Ni) samples are given in Fig. 4(a–c), respectively. The EDS atomic compositions (%) of the samples are highly compatible with the theoretical atomic values (%).


 or Ar) are given in Table 1. The Ω2 parameter shows the short-range effects, while the Ω4 parameter shows the long-range effects.25,31 The effects of the Ω2 parameter are short-range and are associated with the covalence and environmental changes of the Eu3+ ion symmetry.19,20 The high value of Ω2 or the trend Ω2 > Ω4 is evaluated to show the high covalence of the Eu3+–O2− bond character (ionic or covalent) and the high asymmetry or distortion of the local symmetry of Eu3+ sites.7,31 Accordingly, a high Ω2 parameter or Ω2 > Ω4 tendency for all the phosphors can be attributed to the low symmetry Eu3+ ion and the more covalent or less ionic character of the Eu3+–O2− bond. On the other hand, the effects of the Ω4 parameter are long-range and are not directly related to the symmetry of the Eu3+ ion, but the electron density on the surrounding ligands.30,31 In all phosphors, the parameter of Ω4 decreased with increasing Eu3+ concentration, which indicated an increase in electron density in the ligands.
 by eqn (7):7
 or Ar) of the 5D0 → 7F6 transition were estimated as 2.226 × 10⁻²⁰, 1.103 × 10⁻²⁰, 0.155 × 10⁻²⁰ cm2, and 3.636, 2.116, 0.341 s−1 for 3 mol% (SrNb2O6:Eu3+), 6 mol% (CdNb2O6:Eu3+), 6 mol% (NiNb2O6:Eu3+), respectively. The branching ratios (βcal) of the 5D0 → 7F6 transition (or the ratio of the 5D0 → 7F6 transition probability to the total radiative transition probability) were found in the range of 0.03–0.52%. Also, the branching ratios (βexp) of the 5D0 → 7F6 transition from the emission spectra were between 0.18–0.40%. Accordingly, based on the determination of the branching ratios using the RL spectra, the effect of the 5D0 → 7F6 transition on the quantum efficiency or other radiative parameters was negligibly minimal, and its exclusion will not have a significant effect.


