 Open Access Article
Widening the applications of the Just-Dip-It approach: a solid contact screen-printed ion-selective electrode for the real-time assessment of pharmaceutical dissolution testing in comparison to off-line HPLC analysis†
Khadiga M. Kelaniab,
Osama M. Badranb,
Mamdouh R. Rezka,
Mohamed R. Elghobashyac and
Sherif M. Eid *c
*c
aAnalytical Chemistry Department, Faculty of Pharmacy, Cairo University, Kasr El-Aini Street, ET-11562 Cairo, Egypt
bAnalytical Chemistry Department, Faculty of Pharmacy, Modern University for Technology and Information, Cairo, Egypt
cAnalytical Chemistry Department, Faculty of Pharmacy, October 6 University, 6 October City, Giza, Egypt. E-mail: Sheriefmohammed@o6u.edu.eg; sherief055@icloud.com
First published on 9th April 2021
Abstract
Over past years, the field of pharmaceutical dissolution testing has significantly expanded to cover not only the quality control of dosage forms, but also to play an important role in the bioavailability testing paradigm and screening of most formulations. These tests usually need a very long time sampling and monitoring, so that the automation of sampling is laborsaving. Problems often occur with these automatic devices due to sampling lines that may disconnect, crimp, carry over, become mixed up, or are inadequately cleaned. Potentiometric sensors, such as liquid contact (LC-ISE) or solid contact ion-selective electrodes (SC-SP-ISE), can provide timely data to be used for the real-time tracking of the amount of active pharmaceutical ingredients (APIs) released in the dissolution medium without these problems. In this work, we adopted the Just-Dip-It approach as a process analytical technology solution with the ultimate goal of advancing the ion selective sensors to their most effective use in pharmaceutical analysis. Two sensors were fabricated, the traditional LC-ISE and SC-SP-ISE. The sensing poly-vinyl chloride membranes of two electrodes were prepared using 2-nitrophenyl octyl ether as a plasticizer to soften the membrane, and the reduction in resistance to pioglitazone ions (PIO) permeability was achieved through the incorporation of sodium tetraphenylborate and calix[8]arene as a cationic exchanger salt and inclusion complexing ligand, respectively. Finally, prepared membranes were turned into the flexible perm-selective slices of hydrophobic plastic, which work as a barrier to other compounds, except for the PIO cation in the concentration range of 1 × 10⁻⁶ to 1 × 10⁻² M and 1 × 10⁻⁵ to 1 × 10⁻² M for SC-SP-ISE and LC-ISE, respectively. The challenges and opportunities of both sensors in comparison to a developed HPLC method were discussed for the dissolution testing of the combination dosage forms of pioglitazone. Potentiometric methods were validated according to IUPAC guidelines, while HPLC was validated according to ICH guidelines to ensure accuracy and precision.
1. Introduction
Electroanalytical techniques have a great potential to become the technique of choice for the real-time tracking of active processes, such as drug release from nanoparticles,1,2 the kinetics and thermodynamics of formation and the decay of nanoparticles,3 cell apoptosis,4 dopamine release from brain tissue,5 and adsorption processes.6,7 Since 1970s, with the development of more sensitive electronics, the applications of ISEs have expanded tremendously. The solid contact screen printed ion-selective electrodes (SC-SP-ISE) have emerged as an essential technique of the potentiometric electrochemical analysis with hundreds of publications.8,9 This may be due to the fact that SC-SP-ISE has many principle advantages concerning the small electrode area, small thickness, high-temperature tolerance, elimination of the liquid filling solution that is found in the traditional liquid contact ion selective electrode (LC-ISE), the fact that many substances (such as catalysts) can be incorporated in the screen-printing paste, and it is disposable and cheap so that the statistical validation of experimental results can be performed easily due to the presence of several electrode replicates.10The Just-Dip-It approach provides the highest level of real-time monitoring using ion selective electrodes (ISE), in which the potentiometric method is fully integrated with the medium unit under investigation. This integration is a vital tool for tracking bio/chemical changes with time without losing information due to sampling intervals.3 The sensing membrane is just dipped into the medium in question to obtain instant results. Abd El-Rahman et al.11 described a detailed study considering the Just-Dip-It approach for the inline quantitative determination of ipratropium bromide using ISEs in comparison to HPLC techniques in light of the 12 principles of green analytical chemistry. This study showed equivalent analytical results like HPLC, while significantly reducing the amount of solvent, energy consumption, and waste generation.
Another study12 described the use of a dip-it sampler as an extraction device in mass spectrometry. The ISEs capability of providing continuously updated information during the real-time tracking of bio/chemical changes3,13 opened the way for its utilization for inline quantitative determinations and the dissolution testing of pharmaceutical preparations.
Dissolution testing can provide key information about the release of active pharmaceutical ingredients (API) from the market dosage forms, and this information is associated with the API bioavailability.14 The dissolution parameters and procedures are described in the European and Japanese pharmacopeias. In these procedures, when multiple sampling times are required, frequent samples have to be withdrawn for analysis. The withdrawn samples have to be replaced by a fresh dissolution medium at the specified temperatures.15 These tedious protocols may lead to frequent sampling for long periods, frequent solution replacement, re-adjustment of dissolution conditions after each measurement, the consumption of a large number of solvents, the generation of a large amount of waste, high energy consumption due to long operation periods, and great effort from the operator. Most of the traditional methods used for dissolution monitoring such as HPLC chromatographic separations or UV/VIS spectroscopy suffer from these obstacles that may lead to discontinuous dissolution profiles of drugs. Moreover, HPLC devices consume large amounts of samples, solvents, energy, and time during operation and trials.16 Great efforts have been spent to overcome these obstacles, such as using dissolution devices attached to UV/VIS detectors with automatic samplers or potentiometric ion-selective electrodes.17–19
ISE electrodes offer many advantages over the traditional techniques for quantitative real-time tracking of the dissolution of pharmaceutical preparations due to their simplicity, portability, economical operation, and being unaffected by excipients and colors. Moreover, these electrodes are insensitive towards possible air bubbles or undissolved substances in the dissolution solution in contrast to UV/VIS measurements, where these may lead to serious light scattering.19 Although the traditional LC-ISE has an inner filling solution that may be subjected to evaporation in the case of immersion in analyte solutions at high temperatures, it showed good performance for tracking the API release from their dosage forms.20,21 SC-SP-ISE can provide better performance for the real-time tracking of dissolution testing.
In the current work, pioglitazone hydrochloride (IUPAC name: 5-(11methyl)-1,3-thiazolidine-2,4-dione) was selected as a model drug for this study (Fig. 1S†). It is mostly administered in combination dosage forms as an antidiabetic agent that acts primarily by decreasing insulin resistance. A single graphitic carbon disc SC-SP-ISE has been selected, as it creates a solid contact between the electron-conducting substrate and the sensing membrane to replace the liquid contact solution in the LC-ISE, working as an ion-to-electron transducer.22 This approach eliminates the solutions inside the electrode, permitting the usage of SC-SP-ISE for quantification at different conditions (such as high temperatures) with a better response in comparison to the traditional LC-ISE.
This work aimed to fabricate a sensitive sensor, such as an SC-SP-ISE and LC-ISE. Then, the performance of each electrode was tested towards the real-time tracking of the dissolution profile of pioglitazone in its combined dosage form to highlight the opportunities and obstacles of each sensor. The obtained results were compared with the results of a newly developed HPLC method to validate the results and discuss the performance of the proposed methods, and this was compared to the traditional technique. This work could greatly enhance the predictions of the in vivo dissolution performance of oral dosage forms, and be considered as a step forward toward the biowaiver concept.
2. Experiment section
2.1. Chemicals and reagents
Pioglitazone (PIO), alogliptin (ALG), calix[8]arene, and sodium tetrakis[3,5-bis(trifluoromethyl)phenyl]borate (Na-TFPB), 2-nitrophenyl octyl ether (2-NPOE) were purchased from Sigma-Aldrich. Polyvinyl chloride (PVC), sodium phosphomolybdate hydrate (PM), sodium phosphotungstate tribasic (PT), and dibutyl sebathate (DBS) were obtained from Fluka (St. Louis, MO, USA). Tetrahydrofuran (THF) was obtained from (Poole, England). Methanol (HPLC grade) was obtained from Fischer Scientific (UK). Potassium chloride (KCl) and potassium dihydrogen phosphate (analytical grade) were obtained from Oxford Laboratory (Mumbai, India). Orthophosphoric acid was obtained from El-Nasr Pharmaceutical Company (Egypt). All other reagents were of analytical grade, and bi-distilled water was used throughout the work. The pharmaceutical dosage form; Oseni® tablets (alogliptin, 25 mg/pioglitazone, 45 mg per tablet), a product of Takeda Pharmaceuticals (USA) was purchased from the local market.2.2. Instrumentation
2.3. Standard solutions
![[thin space (1/6-em)]](https://www.rsc.org/images/entities/char_2009.gif) :
:![[thin space (1/6-em)]](https://www.rsc.org/images/entities/char_2009.gif) methanol (30
methanol (30![[thin space (1/6-em)]](https://www.rsc.org/images/entities/char_2009.gif) :
:![[thin space (1/6-em)]](https://www.rsc.org/images/entities/char_2009.gif) 70, v/v)], and the volumes were made to the mark using the same solvent.
70, v/v)], and the volumes were made to the mark using the same solvent.2.4. The process of fabrication of the sensors and their optimization
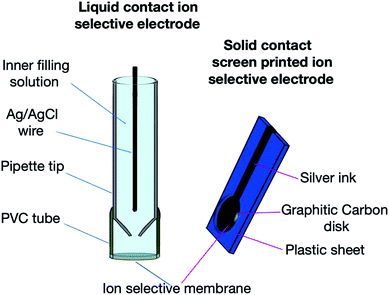
The LC-ISE membrane was fabricated using the same components in the same ratio by mixing the weights of Na-TFPB, 2-NPOE, and PVC in a 5 cm diameter clean glass Petri dish, followed by mixing with THF using a glass rod. Calix[8]arene was added to the mixture, and covered by paper to allow for slow solvent evaporation. The Petri dish components were left to dry for 12 hours at 25 °C. The obtained membrane with a thickness of about 0.1 mm in diameter is considered as a master membrane, from which a small disk with an appropriate size (about 8 mm in diameter) has been cut and glued by THF onto the flat end of the PVC tube. Then, the PVC tube was attached to a glass micropipette from the other end to form an electrode body (LC-ISE), which was filled with equal concentrations (1 × 10⁻² M) of PIO and KCl aqueous solution as an inner filling solution.
Fig. 1 describes the design of the two sensors. The conditioning of the two sensors was performed through overnight soaking of the membranes with a 1 × 10⁻² M pioglitazone solution.
where the potentiometric selectivity coefficient is symbolized (kpotion interferent). “S” is the slope of the calibration plots for each sensor. “E1 and E2” are potentials measured in 1 × 10⁻³ M of under-investigation ions and interferent ions, respectively. “A and B” represent the charges of the under-investigation and the interferent ions, respectively. “a” is the activity of the under-investigation ions.
2.5. HPLC separation conditions and calibration
The ideal performance was obtained using a filtered and degassed mobile phase consisting of 20 mM phosphate buffer solution (pH 3)![[thin space (1/6-em)]](https://www.rsc.org/images/entities/char_2009.gif) :
:![[thin space (1/6-em)]](https://www.rsc.org/images/entities/char_2009.gif) methanol (30
methanol (30![[thin space (1/6-em)]](https://www.rsc.org/images/entities/char_2009.gif) :
:![[thin space (1/6-em)]](https://www.rsc.org/images/entities/char_2009.gif) 70, v/v), with isocratic elution at a flow rate of 1.35 mL min−1, oven temperature at 30 °C, and the eluent was monitored at 265 nm. The separation was done using an Inertsil C18 (150 × 4.6 mm, 5 μm) column.
70, v/v), with isocratic elution at a flow rate of 1.35 mL min−1, oven temperature at 30 °C, and the eluent was monitored at 265 nm. The separation was done using an Inertsil C18 (150 × 4.6 mm, 5 μm) column.
The linearity range was determined by transferring different volumes from the ALG and PIO standard solutions (100 μg mL−1) into a series of 10 mL volumetric flasks. Then, the volumetric flasks were completed to the mark using the mobile phase to get a concentration range of (10–80 μg mL−1) and (5–40 μg mL−1) for PIO and ALG, respectively. About 10 μL from each volumetric flask was injected and separated under the chromatographic condition. A linear relationship was obtained by graphing the peak areas against the corresponding concentrations of PIO and ALG, and then the actual concentrations were computed from the corresponding regression equations.
2.6. Real-time tracking of pioglitazone HCl release from the pharmaceutical dosage form (dissolution testing)
Drug absorption from the oral tablet dosage form depends on the drug release and dissolution under different physiological conditions and permeability through the gastrointestinal tract. Because of the crucial nature of these conditions, in vitro dissolution testing can be deemed relevant to try to expect the in vivo performance. Based on that, the dissolution test for PIO was carried out. The dissolution analysis was carried out in 0.01 M HCl as a recommended medium in FDA guidelines. The dissolution test was conducted by dropping one of the Oseni® tablets in one of the vessels (n = 6) containing 900 mL of 0.01 M HCl preheated to 37 °C ± 0.5 °C using the paddle (USP apparatus II), at a speed of stirring equal to 75 rpm. Then, the dissolution testing was constructed using the following steps, as outlined in the next sub-sections.3. Results and discussion
3.1. The performance characteristics of the fabricated sensors
• Initially, polyvinyl chloride (PVC) was selected because of its high lipophilicity (log![[thin space (1/6-em)]](https://www.rsc.org/images/entities/char_2009.gif) P = 0.593) and high molecular weight.26 Moreover, its ability to increase the dielectric constant was beneficial.
P = 0.593) and high molecular weight.26 Moreover, its ability to increase the dielectric constant was beneficial.
• Different types of commonly used plasticizers, such as DBS, 2-NPOE, and DOP, were examined to obtain the most appropriate one. 2-NPOE was selected as the best plasticizer to obtain the optimum Nernstian slope of the monovalent cations. This may be due to the higher dielectric constant of 2-NPOE compared to DOP or DBS, which reaches 24, and its ability to increase the polarity of the membrane compared to the others. Moreover, 2-NPOE can solubilize the ionophore, soften the PVC membrane, and it is inert to ion exchangers and insoluble in water.27
• Since the studied drug (PIO) acts as a cation, this fact suggests the selection of a suitable cationic exchanger. Several cationic exchangers have been tested, such as PT, Na-TFPB, and PM. However, non-Nernstian slopes were obtained using PM and PT, in addition to the non-reproducible response, poorer selectivity, lower sensitivity, and short life-time. On the other hand, the sensory membrane prepared using Na-TFPB provided a rapid response, reproducible Nernstian slope, and lower LOD. Therefore, it was elected as a suitable ion exchanger.
• Selectivity enhancement was performed through the incorporation of an ionophore. Two ionophores were examined, calix[8]arene and β-cyclodextrin (β-CD). Both ionophores have a large number of OH groups, which are considered as high donation sites that provide the ability for the formation of complementary hydrogen or ionic bonds and inclusion complexes with the positive PIO ions.28 The two ionophores were incorporated in the fabrication of two different membranes, and their performance was tested. The incidence of appropriate chelation does not occur with β-CD, while with calix[8]arene, a stabilized host–guest complex occurs by the electrostatic attraction between the anionic calix[8]arene and the cationic PIO. Moreover, the internal cavity size of calix[8]arene (9.5 Å) is larger than that of β-CD (6 Å). As a result, calix[8]arene was suggested as a suitable ionophore for LC-ISE and SC-SP-ISE.
After the election of 2-NPOE and calix[8]arene as the suitable plasticizer and ionophore, respectively, their appropriate molar ratio of calix[8]arene to 2-NPOE was prepared to be 1![[thin space (1/6-em)]](https://www.rsc.org/images/entities/char_2009.gif) :
:![[thin space (1/6-em)]](https://www.rsc.org/images/entities/char_2009.gif) 2 mole percent (mol%) (i.e., the molar ratio of the ion exchanger is 50% relative to the used ionophore). This molar ratio follows many studies,3,29 which proved the fitting of the analyte (PIO) in the inclusion sites of calix[8]arene.
2 mole percent (mol%) (i.e., the molar ratio of the ion exchanger is 50% relative to the used ionophore). This molar ratio follows many studies,3,29 which proved the fitting of the analyte (PIO) in the inclusion sites of calix[8]arene.
The membrane polymeric matrix (PVC) is an impermeable layer due to its hydrophobic characteristics (log![[thin space (1/6-em)]](https://www.rsc.org/images/entities/char_2009.gif) P = 0.593), which necessitates the incorporation of hydrophobic 2-NPOE (log
P = 0.593), which necessitates the incorporation of hydrophobic 2-NPOE (log![[thin space (1/6-em)]](https://www.rsc.org/images/entities/char_2009.gif) P = 4.858) as a plasticizer to soften the membrane. Further reduction in the resistance to ion permeability was achieved through the incorporation of Na-TFPB (log
P = 4.858) as a plasticizer to soften the membrane. Further reduction in the resistance to ion permeability was achieved through the incorporation of Na-TFPB (log![[thin space (1/6-em)]](https://www.rsc.org/images/entities/char_2009.gif) P = 12.971) and calix[8]arene (log
P = 12.971) and calix[8]arene (log![[thin space (1/6-em)]](https://www.rsc.org/images/entities/char_2009.gif) P = 10.729) as the cationic exchanger salt and inclusion complexing ligand, respectively. Finally, the prepared membrane was turned into a flexible perm-selective slice of hydrophobic plastic, which works as a barrier to other compounds except for the PIO cation (log
P = 10.729) as the cationic exchanger salt and inclusion complexing ligand, respectively. Finally, the prepared membrane was turned into a flexible perm-selective slice of hydrophobic plastic, which works as a barrier to other compounds except for the PIO cation (log![[thin space (1/6-em)]](https://www.rsc.org/images/entities/char_2009.gif) P = 3.328). The membranes for LC-ISE and SC-SP-ISE were fabricated using the same membrane components.
P = 3.328). The membranes for LC-ISE and SC-SP-ISE were fabricated using the same membrane components.
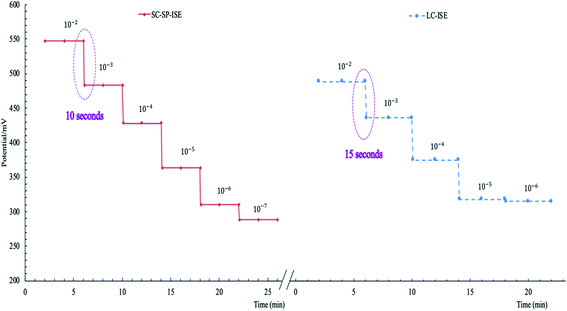
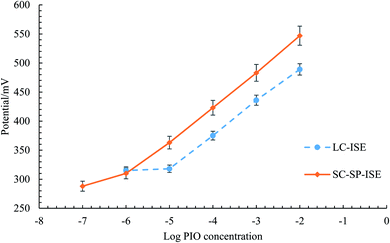 | ||
| Fig. 4 Profile of the potential in mV versus log concentrations of PIO in mol L−1 obtained with (—) SC-SP-ISE and (- - -) LC-ISE. | ||
The potentiometric performance was validated following the guidelines of IUPAC.30 The accuracy of the potentiometric readings of both sensors was confirmed by measuring blind PIO concentrations of (1 × 10⁻⁵, 1 × 10⁻⁴, and 1 × 10⁻³ M). Repeatable and precise measurements were obtained, while applying the method on the same day to the same concentrations using the same conditions. Moreover, the intermediate precision was ensured by measuring the same concentrations on different days, and the calibration regression equations were used to calculate the unknown concentrations. Table 1 summarizes the calculated results, indicating high accuracy and precision from the calculated values of RSD ≥ 2 and the mean recovery percent within the range of 97–101%. The results indicate good performance of the potentiometric analysis for the detection of unknown PIO concentrations with high accuracy and precision.
| Parameters | SC-SP-ISE | LC-ISE | HPLC | ||
|---|---|---|---|---|---|
| a * is the average recoveries of three determinations of both PIO and ALG using: (a) mobile phase at pH = 2.8, instead of 3; (b) mobile phase contains 67% methanol, instead of 70%; (c) flow rate at 1.15, instead of 1.35; and (d) column temperature at 28 instead of 30 °C. | |||||
| Analytes | PIO | PIO | PIO | ALG | |
| Slope | 59.40 | 57.20 | 864.64 | 1464.70 | |
| Intercept | 663.80 | 604.80 | −33.57 | 188.20 | |
| The correlation coefficient (R2) | 0.9990 | 0.9990 | 0.9999 | 0.9998 | |
| The linear range (molar) | 1 × 10⁻⁶ to 1 × 10⁻² | 1 × 10⁻⁵ to 1 × 10⁻² | 2.55 × 10⁻⁵ to 20.36 × 10⁻⁵ | 1.27 × 10⁻⁵ to 10.18 × 10⁻⁵ | |
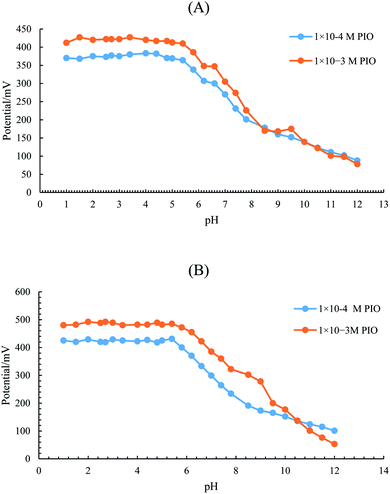
| Working pH range | 1–5.5 | 1–5.5 | — | — | |
| Response time (s) | 10 | 15 | — | — | |
| Retention time (min) | — | — | 2.824 | 1.179 | |
| Validation parameters | |||||
| Accuracy (mean recovery ± SD) | 99.27 ± 0.38 | 99.67 ± 0.78 | 100.07 ± 0.48 | 100.13 ± 0.95 | |
| Repeatability (RSD%) | 0.66 | 0.73 | 0.75 | 0.55 | |
| Intermediate precision (RSD%) | 0.61 | 0.52 | 0.98 | 0.47 | |
| LOD | 2.4 × 10⁻⁷ M | 1.7 × 10⁻⁶ M | |||
| Robustness* | a | — | — | 100.05 ± 0.80 | 99.94 ± 0.32 |
| b | 99.15 ± 0.58 | 100.24 ± 0.91 | |||
| c | 100.87 ± 0.63 | 99.84 ± 0.72 | |||
| d | 100.61 ± 0.78 | 99.08 ± 0.23 | |||
| Interferentb | Selectivity coefficient (mean ± S.D.) | |||
|---|---|---|---|---|
| LC-ISE | SC-SP-ISE | |||
| a Each value is the average of three determinations.b All interferents are in the form of 1 × 10⁻³ mol L−1 solution. | ||||
| Mannitol | 1.41 × 10⁻³ | ±0.65 | 8.32 × 10⁻⁴ | ±0.11 |
| Cellulose | 5.91 × 10⁻³ | ±0.78 | 6.98 × 10⁻⁴ | ±1.09 |
| Magnesium stearate | 7.91 × 10⁻³ | ±1.23 | 11.07 × 10⁻³ | ±0.56 |
| Talc | 6.81 × 10⁻³ | ±0.34 | 1.82 × 10⁻³ | ±0.88 |
| Lactose | 5.14 × 10⁻³ | ±0.44 | 3.83 × 10⁻⁴ | ±1.23 |
| Ferric oxide | 2.94 × 10⁻³ | ±0.89 | 2.81 × 10⁻³ | ±0.76 |
| Starch | 10.37 × 10⁻³ | ±1.20 | 9.93 × 10⁻³ | ±0.58 |
| Ca2+ | 11.07 × 10⁻³ | ±1.32 | 8.18 × 10⁻³ | ±0.90 |
| Mg2+ | 9.24 × 10⁻⁴ | ±0.77 | 5.19 × 10⁻⁴ | ±1.11 |
| Alogliptin benzoate | 8.86 × 10⁻³ | ±0.56 | 7.67 × 10⁻⁴ | ±0.67 |
3.2. HPLC method calibration and validation
Chromatographic methods are widely used for the quantitative analysis of active pharmaceutical ingredient release profiles. Therefore, the establishment and validation of an efficient, robust, and reliable RP-HPLC method for tracking the rate of drug release from the Oseni® tablet was one of the goals of our study. Different chromatographic conditions have been tested, including different pH values, mobile phase components, flow rate, buffer components, and stationary phase aiming for the separation of ALG from PIO with high resolution. The selected pH values at which the good resolution and sharp peaks for the two studied drugs were obtained was 3. The optimum separation of ALG and PIO was ideally performed utilizing the degassed mobile phase of 20 mM phosphate buffer solution (pH 3)![[thin space (1/6-em)]](https://www.rsc.org/images/entities/char_2009.gif) :
:![[thin space (1/6-em)]](https://www.rsc.org/images/entities/char_2009.gif) methanol (30
methanol (30![[thin space (1/6-em)]](https://www.rsc.org/images/entities/char_2009.gif) :
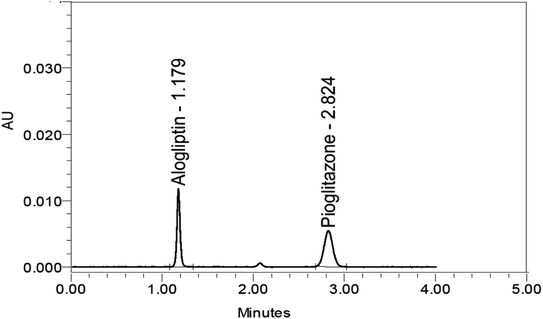
:![[thin space (1/6-em)]](https://www.rsc.org/images/entities/char_2009.gif) 70, v/v), isocratic elution, flow rate at 1.35 mL min−1, column temperature of 30 °C, and the eluent was monitored at a wavelength of 265 nm (the wavelength at which ALG and PIO have appropriate absorbance). The separation was done using an Inertsil C18 (150 × 4.6 mm, 5 μm) column. The ALG and PIO retention times were 1.1 and 2.8 minutes, respectively, Fig. 5.
70, v/v), isocratic elution, flow rate at 1.35 mL min−1, column temperature of 30 °C, and the eluent was monitored at a wavelength of 265 nm (the wavelength at which ALG and PIO have appropriate absorbance). The separation was done using an Inertsil C18 (150 × 4.6 mm, 5 μm) column. The ALG and PIO retention times were 1.1 and 2.8 minutes, respectively, Fig. 5.
A linear relationship was obtained in the concentration range of (10–80 μg mL−1), as shown in Fig. 2S.† The obtained linearity range was from 20–160% of the expected released PIO in a dissolution medium. The actual amount released from PIO in the dissolution medium at the first and last interval is completely covered by the range.
The HPLC method was validated according to the ICH guideline.31 Adequate accuracy for the proposed chromatographic method was established through the calculation of the mean recovery and RSD for different pure PIO concentrations. Assessment of precision was also employed, and the findings from inter-day and intra-day precision indicate that the chromatographed method was highly precise. The method's robustness has been assessed by evaluating the effect of small changes in the experimental conditions, such as flow rate, mobile phase composition, oven temperature, and pH. In all of the deliberate varied chromatographic conditions, good recoveries were obtained, as shown in Table 1. Also, the resolution between the two drugs was slightly affected, indicating a highly robust method. Table 1S† shows the system suitability parameters, and the results indicate that the method is suitable. Thus, it can be used for quantification of the drugs using representative chromatograms.
3.3. Tracking of pioglitazone ion activity during the dissolution test
Pioglitazone and alogliptin were formulated in a combination dosage form called Oseni® tablets. Oseni® tablets are film-coated tablets that have been listed as an oral dosage form that should not be crushed before swallowing, as their content must be slowly released in the stomach. The tracking of its active component slow-release using traditional methods that require frequent sampling, such as HPLC, is a tedious process. Thus, the use of inline monitoring by ion-selective electrodes is advantageous. In particular, pioglitazone is more lipophilic (log![[thin space (1/6-em)]](https://www.rsc.org/images/entities/char_2009.gif) P = 2.12) than alogliptin (log
P = 2.12) than alogliptin (log![[thin space (1/6-em)]](https://www.rsc.org/images/entities/char_2009.gif) P = −1.88), which increases the selectivity of the prepared lipophilic membrane towards pioglitazone. Also, the different lipophilicities facilitated the chromatographic separation.
P = −1.88), which increases the selectivity of the prepared lipophilic membrane towards pioglitazone. Also, the different lipophilicities facilitated the chromatographic separation.
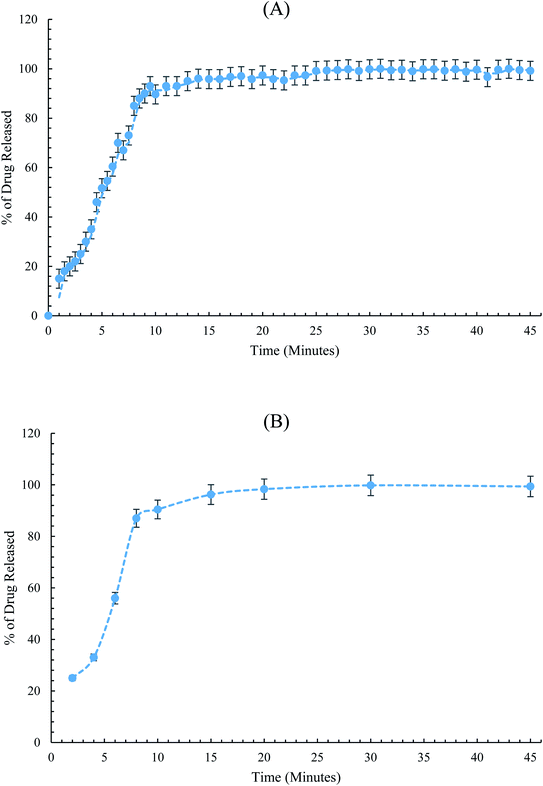
The conditioned SC-SP-ISE was dipped in conjunction with the reference electrode into the dissolution medium, and the emf was recorded in a continuous manner. Then, the percentage of release was determined using the related regression equation. The construction of the dissolution curve was traditionally performed via plotting the percentage of dissolution versus release time in minutes, Fig. 6.
The dissolution testing showed a complete release of PIO, where more than 90% of PIO was released from the dosage form after 15 minutes. The results are consistent with the acceptance dissolution criteria, as stated by USP.35 From Fig. 6, it can be easily concluded that SC-SP-ISE has equivalent performance to the traditional HPLC for tracking the PIO release from the pharmaceutical preparations.
4. Conclusion
It can be concluded from the results of the proposed method that the solid contact single carbon screen-printed electrodes (SC-SP-ISE) have shown higher performance over the liquid contact ion-selective electrodes (LC-ISE) for the real-time tracking of the release of PIO from its commercial tablets. This may be due to the elimination of the inner filling solution that is present in the LC-ISE, which is susceptible to evaporation during analysis or the undesirable fluxes through the membrane from the internal filling concentrated components to the outer surface of the membrane, causing deterioration of the analytical sensitivity and selectivity with time. The results obtained using the SC-SP-ISE showed a full profile of PIO release with high selectivity and accuracy in the presence of the expected interfering substances, such as the excipients and ALG.In comparison to the developed HPLC method, the proposed method showed reliable performance with a very good result, contentious profiles of release, lower solvent consumption, lower generation of solvents, and environmentally friendly technique. Finally, using SP-ISEs could greatly open the door for simple performance of the forthcoming dissolution studies, delineating them as an outstanding alternative to other offline techniques commonly utilized for monitoring the dissolution profile.
Conflicts of interest
The authors declare no conflict of interest.Acknowledgements
We would like to express our deep thanks to Prof. Dr Mohamed K. Abd El-Rahman, a Visiting Scholar at the Whitesides group, Harvard University, and a Professor of Analytical Chemistry, Faculty of Pharmacy, Cairo University, for his guidance and valuable discussions during replying to review comments on this work. Also, Dr Sherif M Eid would like to thank his supervisor, Prof. Dr M. K. Abd El-Rahman, for the patient guidance, discussions and advices he has provided throughout the time as his electrochemistry student.References
- L. Mora, K. Chumbimuni-Torres, C. Clawson, L. Hernandez, L. Zhang and J. Wang, J. Controlled Release, 2009, 140, 69–73 CrossRef CAS PubMed.
- A. Ensafi, E. Heydari-Bafrooei and B. Rezaei, Electroanalysis, 2014, 26, 776–785 CrossRef CAS.
- S. M. Eid, Talanta, 2020, 218, 121135 CrossRef CAS PubMed.
- S. Takano, S. Shiomoto, K. Inoue, K. Ino, H. Shiku and T. Matsue, Anal. Chem., 2014, 86, 4723–4728 CrossRef CAS PubMed.
- M. Sun, S. Kaplan, R. Gehringer, R. Limbocker and M. Johnson, Anal. Chem., 2014, 86, 4151–4156 CrossRef CAS PubMed.
- M. Antilen, F. Amiama, M. Otaiza, F. Armijo, M. Escudey, C. Pizarro and N. Arancibia-Miranda, J. Nanopart. Res., 2015, 17, 212 CrossRef.
- D. Araujo, A. Faria, R. Takeuchi and A. Santos, Electroanalysis, 2016, 28, 596–600 CrossRef CAS.
- M. Li, Y.-T. Li, D.-W. Li and Y.-T. Long, Anal. Chim. Acta, 2012, 734, 31–44 CrossRef CAS PubMed.
- M. K. Abd El-Rahman, S. M. Eid, M. R. Elghobashy and K. M. Kelani, Sens. Actuators, B, 2019, 285, 216–223 CrossRef CAS.
- C. Zuliani and D. Diamond, Electrochim. Acta, 2012, 84, 29–34 CrossRef CAS.
- M. El-Rahman, H. Zaazaa, N. ElDin and A. Moustafa, ACS Sustainable Chem. Eng., 2016, 4, 3122–3132 CrossRef.
- X. Wang, X. Li, Y. Bai and H. Liu, Chem. Commun., 2015, 51, 4615–4618 RSC.
- K. Y. Chumbimuni-Torres, E. Bakker and J. Wang, Electrochem. Commun., 2009, 11, 1964–1967 CrossRef CAS PubMed.
- V. Shah, in Pharmaceutical Dissolution Testing, 2005, pp. 81–96 Search PubMed.
- W. Brown, in Pharmaceutical Dissolution Testing, 2005, pp. 69–80 Search PubMed.
- S. Eid, K. Kelani, O. Badran, M. Rezk and M. Elghobashy, Anal. Chim. Acta, 2020, 1117, 60–73 CrossRef CAS PubMed.
- M. Petruševska, M. Horvat, L. Peternel and K. Kristan, Drug Dev. Ind. Pharm., 2015, 42, 1149–1157 CrossRef PubMed.
- Z. Legnerova, Talanta, 2002, 58, 1151–1155 CrossRef CAS PubMed.
- K. Peeters, R. De Maesschalck, H. Bohets, K. Vanhoutte and L. Nagels, Eur. J. Pharm. Sci., 2008, 34, 243–249 CrossRef CAS PubMed.
- M. K. A. El-Rahman, R. A. Sayed, M. S. El-Masry, W. S. Hassan and A. Shalaby, J. Electrochem. Soc., 2018, 165, B143–B149 CrossRef.
- E. S. Elzanfaly and A. S. Saad, ACS Sustainable Chem. Eng., 2017, 5, 4381–4387 CrossRef CAS.
- M. R. Rezk, A. S. Fayed, H. M. Marzouk and S. S. Abbas, J. Electrochem. Soc., 2017, 164, H628–H634 CrossRef CAS.
- A. Kumar, Y. Zhang, D. Li and R. Compton, Electrochem. Commun., 2020, 121, 106867 CrossRef.
- Y. Umezawa, K. Umezawa and H. Sato, Pure Appl. Chem., 1995, 67, 507–518 Search PubMed.
- W. E. Morf, The Principles of Ion-Selective Electrodes and of Membrane Transport, Elsevier, 2012 Search PubMed.
- R. D. Armstrong and M. Todd, J. Electroanal. Chem. Interfacial Electrochem., 1987, 237, 181–185 CrossRef CAS.
- D. Wang, J. Hu, Y. Li, M. Fu, D. Liu and Q. Chen, J. Membr. Sci., 2016, 501, 228–235 CrossRef CAS.
- I. A. Pechenkina and K. N. Mikhelson, Russ. J. Electrochem., 2015, 51, 93–102 CrossRef CAS.
- Z. Yan, Y. Lu and X. Li, Sens. Actuators, B, 2007, 122, 174–181 CrossRef CAS.
- Y. Umezawa, P. Bühlmann, K. Umezawa, K. Tohda and S. Amemiya, Pure Appl. Chem., 2000, 72, 1851–2082 CAS.
- I. H. T. Guideline, Q2 (R1), 2005, vol. 1, pp. 1–15 Search PubMed.
- M. Sohail and R. De Marco, in Reference Module in Chemistry, Molecular Sciences and Chemical Engineering, 2013 Search PubMed.
- J. Hu, A. Stein and P. Bühlmann, TrAC, Trends Anal. Chem., 2016, 76, 102–114 CrossRef CAS.
- H. M. Mohamed, TrAC, Trends Anal. Chem., 2016, 82, 1–11 CrossRef CAS.
- J. L. Cohen, B. B. Hubert, L. J. Leeson, C. T. Rhodes, J. R. Robinson, T. J. Roseman and E. Shefter, Pharm. Res., 1990, 07, 983–987 CrossRef CAS PubMed.
Footnote |
| † Electronic supplementary information (ESI) available. See DOI: 10.1039/d1ra00040c |
| This journal is © The Royal Society of Chemistry 2021 |

