 Open Access Article
Natural and magnetic circular dichroism spectra of nucleosides: effect of the dynamics and environment†
Jakub Kaminský *,
Valery Andrushchenko
 * and
Petr Bouř
 *
*
Institute of Organic Chemistry and Biochemistry, Academy of Sciences, Flemingovo náměstí 2, 16610, Prague, Czech Republic. E-mail: kaminsky@uochb.cas.cz; andrushchenko@uochb.cas.cz; bour@uochb.cas.cz
First published on 23rd February 2021
Abstract
Chiroptical spectroscopic methods are excellent tools to study structure and interactions of biomolecules. However, their sensitivity to different structural aspects varies. To understand the dependence of absorption, electronic and magnetic circular dichroism (ECD, MCD) intensities on the structure, dynamics and environment, we measured and simulated spectra of nucleosides and other nucleic acid model components. The conformation space was explored by molecular dynamics (MD), the electronic spectra were generated using time dependent density functional theory (TDDFT). The sum over state (SOS) method was employed for MCD. The results show that accounting for the dynamics is crucial for reproduction of the experiment. While unpolarized absorption spectroscopy is relatively indifferent, ECD reflects the conformation and geometry dispersion more. MCD spectra provide variable response dependent on the wavelength and structural change. In general, MCD samples the structure more locally than ECD. Simple computational tests suggest that the optical spectroscopies coupled with the computational tools provide useful information about nucleic acid components, including base pairing and stacking.
Introduction
Electronic spectroscopy, including its chiral variants, electronic (natural) and magnetic circular dichroism (ECD, MCD), significantly contributed to our understanding of nucleic acids.1–6 The spectra reveal the conformational features, report on the electronic structure and nature of the electronic transitions. However, interpretation of band energies and intensities is not straightforward. Spectral shapes are formed by many factors, including equilibrium geometry, environment, conformer equilibria, and molecular flexibility. Some spectral bands originate from local chirality, while others reflect less localized conformational aspects or even macromolecular condensation.In the past, the quantum-chemical procedures have been tested to provide universal basis for understanding the shapes and position of observed spectral bands.4,7 In the present study, we focus on the dependence of ECD and MCD spectra on molecular flexibility and interactions. The long-time goal is to increase the amount of information obtainable from the experimental data. We chose a series of molecules allowing to estimate contributions of individual nucleic acid components (e.g., guanine → guanosine → guanosine monophosphate), the effect of base substitution (uridine vs. methyluridine), and the difference between purine and pyrimidine bases (e.g. guanosine vs. cytidine). Conformational equilibria and dynamics appeared to modulate significantly all spectral features.
Previous experience shows that an average of “snapshot” (conformer) geometries obtained from molecular dynamics (MD) well-represents the time averaging and leads to realistic band shapes for solid state, liquids and solutions.8–10 Although the averaging is computationally demanding, it has been possible by efficient averaging scripts, the time-dependent DFT methodology for ECD11,12 and time-efficient sum-over state (SOS)13,14 MCD calculations.
While ECD has been used for studies of nucleic acids for a long time,15,16 MCD is used less frequently and its full potential for nucleic acid studies is rather unexplored. In early research, MCD bands were assigned mostly empirically.17 Today, more accurate simulations are possible and MCD can provide very useful data complementary to absorption and ECD. For example, some MCD bands were found to be quite sensitive to the environment of the nucleotides.4
The understanding of nucleotide spectroscopic behavior is also required for modeling of longer nucleic acid polymers, where the nucleotide data can be used as parameters in simplified computational procedures. Other computational possibilities are provided by the embedding techniques,18,19 which in the recent years provided useful information on the chromophore behavior including ECD20 and MCD spectra.21
Our results show that accounting for the geometry dispersion during thermal molecular motion is particularly important for realistic ECD and MCD theoretical intensities. We follow a “bottom-up” approach, first characterizing spectral properties of bare nucleobases. Then spectra of the nucleosides are analyzed. The theory can also well indicate sensitivity of different spectral types to molecular interactions, such as base pairing and stacking. We believe that such mapping of factors affecting spectral shapes will help to increase reliability of the simulations, desirable for establishing a closer link between spectral shapes and molecular structure and dynamics.
Methods
Spectra measurement
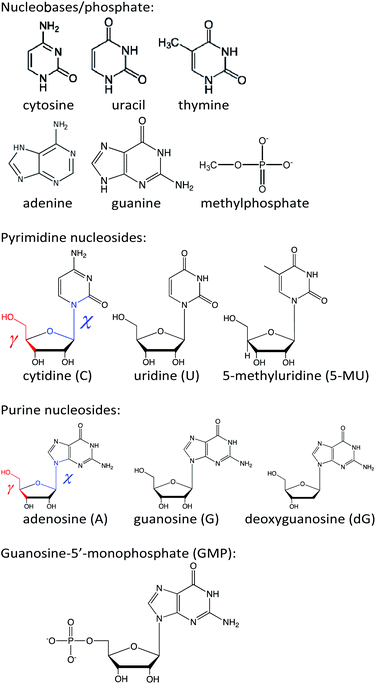
Commercial nucleosides (Sigma-Aldrich, Fig. 1) were dissolved in water to concentrations of 5 × 10⁻⁵ M (for A, G and dG), 3 × 10⁻⁵ M (C) and 1 × 10⁻⁴ M (U and 5-MU). The guanine base was virtually insoluble in water and 1 M KOH solution was used as a solvent to a final concentration of 1 × 10⁻⁴ M. Guanosine-5′-monophosphate was measured as 1 × 10⁻⁵ M aqueous solution. Absorption, ECD and MCD spectra were recorded as averages of three scans within 190–320 nm on a JASCO J-815 spectrometer, equipped with a permanent magnet of 1.5 T. Optical path length was 1 cm, scanning speed 20 nm min−1, temperature 20 °C, and response time 4 s. Spectra of polyuridylic and polyadenylic acid (polyU, polyA) and sodium salt of salmon testes DNA (all from Sigma-Aldrich) were also recorded to explore behavior of longer biopolymers. PolyU and polyA (0.27 mg mL−1 and 0.18 mg mL−1, resp.) were measured in water using 1 mm cell and 16 scans. The DNA was dissolved in cacodilic buffer (10−2 M sodium cacodylate + 0.1 M NaCl, pH 7.0) and its spectra (16 scan averages) measured within 320–220 nm and 220–190 nm using 1 mm (0.82 mg mL−1 concentration) and 0.1 mm (1.38 mg mL−1 concentration) path lengths, respectively. Other settings were the same as for the smaller molecules.Computations
In the simplest approach, geometries of adenosine (A), uridine (U), 5-methyluridine (5-MU), cytidine (C), guanine, guanosine (G), deoxyguanosine (dG), and guanosine-5′-monophosphate (GMP) (Fig. 1) were optimized in local minima by energy minimization using the B3LYP22/6-311++G**/CPCM23 method with the D3 dispersion correction and Becke–Johnson damping function (GD3BJ).24 The CAM-B3LYP25 functional extension was tried but did not improve the results. Preliminary conformer searches were made using a lower, 6-31G** basis set. The Gaussian program26 was used for the DFT and TDDFT computations, i.e. for the geometry optimization and generation of absorption and ECD spectra. MCD spectra were generated by using the sum over state (SOS) method13,14 and the Guvcde program.27 Guvcde uses the TDDFT excitation coefficients and energies calculated by Gaussian. Smooth spectra were generated using Gaussian functions of 20 nm full width at half height and normalized to one nucleotide unit.In an alternate model, selected spectra for geometries obtained from MD were averaged. For MD, the investigated molecule was put in a cubic box with approximately 700 water molecules using the Desmond software.28 The OPLS-2005 force field29 was employed in 100 ns simulations, using 1 fs time step, NpT ensemble, pressure of 1 bar, and temperature was kept at 300 K by the Nose–Hoover thermostat. The TIP3P force field30 was used to treat water molecules. We recorded the snapshot geometries each 0.5 ns.
In metadynamics simulations free energy of the nucleosides as dependent on the χ and γ torsional angles (Fig. 1) was determined. The angles were scanned with 10 degree increment using the Maestro graphical interface.31 The simulations were run in Desmond with default parameters (100 ns for each, NpT ensemble, height of the Gaussian kernel was 0.03 kcal mol−1, interval of dropping the kernel in phase space was 0.09 ps).
Solute–solvent clusters containing waters closer than 3.6 Å to the solute were extracted from the MD snapshot geometries. The 3.6 Å limit has been based on previous experience, as it allows to include molecules from the first solvation shell.32,33 Apart from the raw MD geometries, to explore optimization effects, selected clusters were subjected to constrained optimization in vibrational normal coordinates; modes with energies below 300 cm−1 were fixed.34,35 As shown below, the optimization did not lead to qualitatively different results. For the spectra calculations, explicit water molecules were deleted and replaced with the CPCM23,36 continuous model. Calculations in which water molecules in the first solvation sphere were kept and the others treated by CPCM were also tried.
Result and discussion
Flexibility of the nucleosides
All spectra strongly depend on the conformation. The PCM solvent representation alone does not seem to reliably describe nucleoside flexibility and interactions with the environment.37,38 For guanosine, for example, a conformer with intramolecular hydrogen bond is strongly favored, which is not probable because of the competition of extramolecular hydrogen bonding to water. Nevertheless, we can see that absorption and MCD are less affected by the conformational variations, whereas ECD is susceptible more (Fig. S1†). This is a consequence of the planarity of the main chromophore, the aromatic base. It is not chiral, so that the whole ECD signal comes from the interaction with the sugar residue. On the other hand, a large part of the absorption and MCD intensities is present already in the “unperturbed” base. The sugar electrons/molecular orbitals start to participate more substantially in the electronic transitions below 200 nm, which leads to increased conformational sensitivity of absorption and MCD in this region.The MD simulations treat the intra- and intermolecular hydrogen bonds more consistently than PCM. Example of the dependence of free energy on the (χ, γ) torsion angles is plotted for cytidine in Fig. 2. Potential energy surfaces of other nucleosides and GMP are analogous (Fig. S2†). All species generate six local energy minima (I–VI) with very similar (χ, γ) values. As discussed previously,39 the sugar rotation around glycosidic bond generates syn and anti-conformers, differing in the χ-angle, and each of them can additionally adopt one of three orientations of the methoxy (–CH2OH) group (γ ∼ ±60°, 180°). The free energy surfaces suggest that for most nucleosides only conformers with γ ∼ −60° are populated at room temperature, except for U preferring γ ∼ 60°. The relative energies and corresponding geometries of the six local minima are listed in Table S1.† Interestingly, the uridine methylation results in a flip of the χ angle, from anti (−171°, conformer VI of uridine) to syn (52°, 55° conformers I and II of 5-methyluridine) values. This can be explained by a steric clash of the methyl group with the sugar.
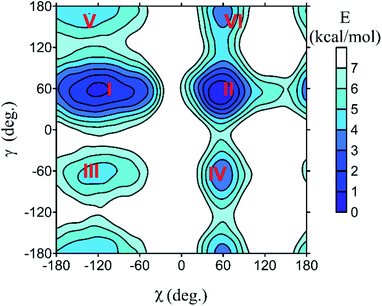 | ||
| Fig. 2 Dependence of cytidine free energy on the torsion angles (χ, γ, Fig. 1), as obtained from the metadynamic simulations. Numbers I–VI denote local minima of the energy. | ||
Electronic transitions
Within the experimentally accessible region (approximately 200–700 nm), the main contributions to all the three types of spectra (absorption, ECD and MCD) come from the base chromophores. The strongest electronic bands of bare bases and other molecules are listed in Table S2.† They predominantly involve the π–π* aromatic transitions. Absorption and MCD spectra of the bases and the methylphosphate model are simulated in Fig. S3,† participating molecular orbitals are depicted in Fig. S4.† The default B3LYP/6-311++G**/CPCM DFT method used in the present study seems to give reasonable representation of the electronic transition energies if compared to experimental data,40 previous DFT computations involving explicit water molecules,4 or coupled-cluster methods.7 The main features of the MCD spectra generated using the SOS-DFT procedure13,14 also agree with those obtained using the DFT-based quadratic response theory4 or the coupled-cluster formalism.7The biggest transition dipole moments lie in the plane of the bases, i.e. the transitions belong to the A′ symmetric representation of the Cs point group. The A′′ transitions with transition dipole moments perpendicular to the plane are weak and nearly invisible within 190–300 nm. Some studies also indicate transitions to delocalized Rydberg states in this region.7 These, however, are not included in our model of a limited basis set and their contribution to the spectra is supposed to be small due to the small overlap between the ground and excited states. We also neglect the vibrational splitting of the electronic bands41–44 as it is not apparent in the experiment, except for a band broadening.
The pyrimidine bases (cytosine, uracil, thymine, Fig. S3†) all provide a strong absorption band around 260 nm associated with a negative MCD; below 240 nm the spectra of cytosine differ more from the other two and MCD is mostly positive. The purine bases, adenine and guanine, provide two strong MCD bands of opposite signs around 260 nm. The phosphate group starts to contribute significantly to the absorption and MCD spectra below 240 nm.
Experimental and theoretical spectra, static model
The calculated and experimental spectra of the C, U, 5-MU, A, G and dG nucleosides are plotted in Fig. 3, main peak positions and intensities are summarized in Table 1. The calculated spectra were obtained as weighted averages over the I–VI local minima (Fig. 2 and S2, Table S1†), using CPCM to model the environment. Compared to plane bases (Fig. S3†), the calculated absorption spectra of corresponding nucleosides are nearly the same. This corresponds to the dominance of the aromatic chromophore and relative locality of the electronic transitions. The locality can be also documented on molecular orbitals involved in typical electronic transitions in guanine systems. For example, HOMO and LUMO orbitals in guanosine are almost completely positioned at the guanine base (Fig. S5†).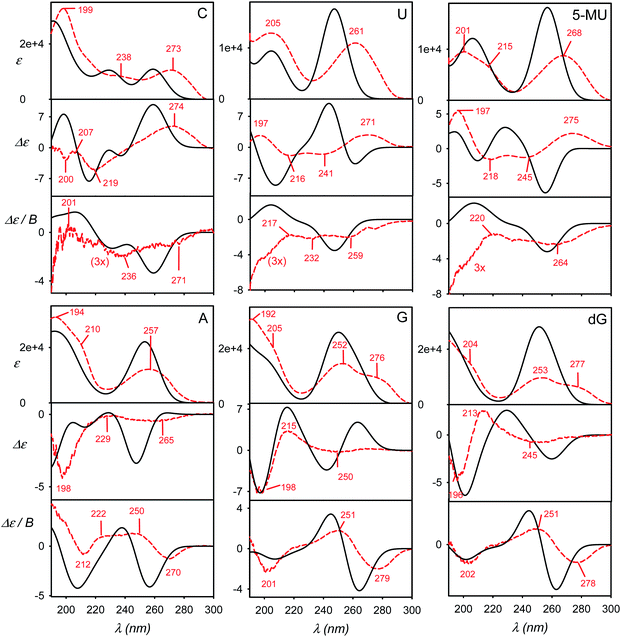 | ||
| Fig. 3 Calculated (black, solid) and experimental (red, dashed) absorption (ε), ECD (Δε) and MCD (Δε/B) spectra of six nucleosides, a B3LYP/6-311++G**/CPCM weighted average over six geometries representing minima I–VI defined in Fig. 2 and S2.† | ||
| λABS | ε | λECD | Δε | λMCD | Δε/B | ||
|---|---|---|---|---|---|---|---|
| a Ref. 40.b CAM-B3LYP. | |||||||
| C | Exp. | 273, 270a | 10![[thin space (1/6-em)]](https://www.rsc.org/images/entities/char_2009.gif) 425 425 |
274 | 4.82 | 271 | −0.44 |
| 238 | 8217 | 219 | −4.99 | 236 | −0.66 | ||
| 199 | 32![[thin space (1/6-em)]](https://www.rsc.org/images/entities/char_2009.gif) 493 493 |
207 | −0.98 | 201 | 0.34 | ||
| 200 | −2.71 | ||||||
| Calc. | 259, 245b | 10![[thin space (1/6-em)]](https://www.rsc.org/images/entities/char_2009.gif) 655 655 |
258 | 9.76 | 259 | −3.36 | |
| 229 | 10![[thin space (1/6-em)]](https://www.rsc.org/images/entities/char_2009.gif) 409 409 |
236 | −1.82 | 242 | −1.08 | ||
| 191 | 28![[thin space (1/6-em)]](https://www.rsc.org/images/entities/char_2009.gif) 348 348 |
227 | −0.74 | 229 | −1.31 | ||
| 214 | −7.48 | 207 | 1.65 | ||||
| 198 | 7.52 | ||||||
| U | Exp. | 261, 261a | 11![[thin space (1/6-em)]](https://www.rsc.org/images/entities/char_2009.gif) 022 022 |
271 | 2.77 | 259 | −0.65 |
| 205 | 12![[thin space (1/6-em)]](https://www.rsc.org/images/entities/char_2009.gif) 942 942 |
241 | −1.50 | 232 | −0.81 | ||
| 216 | −1.82 | 217 | −0.58 | ||||
| 197 | 2.57 | ||||||
| Calc. | 247, 234b | 17![[thin space (1/6-em)]](https://www.rsc.org/images/entities/char_2009.gif) 602 602 |
259 | −3.61 | 246 | −3.57 | |
| 203 | 9360 | 242 | 9.91 | 204 | 1.63 | ||
| 207 | −8.58 | ||||||
| 5-MU | Exp. | 268 | 8772 | 275 | 2.20 | 264 | −0.74 |
| 215 | 6985 | 245 | −1.24 | 220 | −0.42 | ||
| 201 | 9503 | 218 | −1.58 | ||||
| 197 | 5.39 | ||||||
| Calc. | 256, 243b | 17![[thin space (1/6-em)]](https://www.rsc.org/images/entities/char_2009.gif) 976 976 |
251 | −6.32 | 256 | −3.14 | |
| 206 | 12![[thin space (1/6-em)]](https://www.rsc.org/images/entities/char_2009.gif) 084 084 |
228 | 3.00 | 207 | 2.30 | ||
| 209 | −1.78 | ||||||
| 194 | 2.31 | ||||||
| A | Exp. | 257, 257a | 12![[thin space (1/6-em)]](https://www.rsc.org/images/entities/char_2009.gif) 142 142 |
265 | −0.37 | 270 | −1.31 |
| 210 | 22![[thin space (1/6-em)]](https://www.rsc.org/images/entities/char_2009.gif) 751 751 |
229 | −0.12 | 250 | 1.22 | ||
| 194 | 30![[thin space (1/6-em)]](https://www.rsc.org/images/entities/char_2009.gif) 806 806 |
198 | −4.28 | 222 | 0.83 | ||
| 212 | −0.92 | ||||||
| Calc. | 254, 239b | 21![[thin space (1/6-em)]](https://www.rsc.org/images/entities/char_2009.gif) 897 897 |
247 | −3.39 | 256 | −4.14 | |
| 194 | 25![[thin space (1/6-em)]](https://www.rsc.org/images/entities/char_2009.gif) 679 679 |
228 | 0.09 | 237 | 1.81 | ||
| 204 | −0.53 | 207 | −4.19 | ||||
| 187 | −3.8 | ||||||
| G | Exp. | 276, 275a | 9426 | 250 | −0.32 | 279 | −1.99 |
| 252, 253a | 14![[thin space (1/6-em)]](https://www.rsc.org/images/entities/char_2009.gif) 508 508 |
215 | 3.27 | 251 | 1.74 | ||
| 205 | 20![[thin space (1/6-em)]](https://www.rsc.org/images/entities/char_2009.gif) 878 878 |
198 | −7.13 | 201 | 2.24 | ||
| 192 | 30![[thin space (1/6-em)]](https://www.rsc.org/images/entities/char_2009.gif) 749 749 |
||||||
| Calc. | 250, 249b | 25![[thin space (1/6-em)]](https://www.rsc.org/images/entities/char_2009.gif) 679 679 |
263 | 4.74 | 264 | −4.17 | |
| 232b | 16![[thin space (1/6-em)]](https://www.rsc.org/images/entities/char_2009.gif) 065 065 |
241 | −3.34 | 245 | 3.37 | ||
| 202 | 26![[thin space (1/6-em)]](https://www.rsc.org/images/entities/char_2009.gif) 850 850 |
215 | 7.19 | 206 | −1.05 | ||
| 179 | 197 | −7.27 | |||||
| dG | Exp. | 277 | 6522 | 245 | −0.75 | 278 | −1.39 |
| 253 | 9765 | 213 | 2.51 | 251 | 1.10 | ||
| 204 | 14![[thin space (1/6-em)]](https://www.rsc.org/images/entities/char_2009.gif) 836 836 |
196 | −4.51 | 202 | −1.49 | ||
| Calc. | 251, 250b | 28![[thin space (1/6-em)]](https://www.rsc.org/images/entities/char_2009.gif) 091 091 |
259 | −2.64 | 262 | −3.27 | |
| 232b | 29![[thin space (1/6-em)]](https://www.rsc.org/images/entities/char_2009.gif) 262 262 |
229 | 2.58 | 245 | 2.50 | ||
| 183 | 200 | −6.30 | 202 | −1.03 | |||
| polyU | Exp. | 260 | 9640 | 274 | 7.75 | 272 | −1.54 |
| 202 | 11![[thin space (1/6-em)]](https://www.rsc.org/images/entities/char_2009.gif) 381 381 |
242 | −3.33 | 243 | 0.20 | ||
| 209 | −0.56 | 214 | 0.34 | ||||
| 192 | 2.31 | ||||||
| polyA | Exp. | 257 | 8641 | 264 | 16.48 | 272 | −1.03 |
| 210 | 12![[thin space (1/6-em)]](https://www.rsc.org/images/entities/char_2009.gif) 388 388 |
247 | −11.79 | 251 | 1.09 | ||
| 193 | 16![[thin space (1/6-em)]](https://www.rsc.org/images/entities/char_2009.gif) 405 405 |
232 | 0.77 | 226 | −0.28 | ||
| 221 | 5.79 | 212 | −1.94 | ||||
| 205 | −20.58 | 198 | 0.97 | ||||
| DNA | Exp. | 258 | 7858 | 277 | 3.17 | 267 | −0.52 |
| 211 | 7995 | 245 | −3.52 | 249 | 0.16 | ||
| 201 | 9531 | 222 | 1.33 | 209 | −0.52 | ||
| 210 | −0.51 | 193 | 2.16 | ||||
| 197 | 7.56 | ||||||
ECD spectra (middle panels in Fig. 3) reflect the non-aromatic nucleoside parts more than the absorption. The experimental spectra of the pyrimidine derivatives (C, U and 5-MU) exhibit a positive band around the strong HOMO–LUMO absorption band within 263–273 nm. ECD tends to be negative around 230 nm, and the sign changes again below 200 nm. For C and U, the simulations capture this trend reasonably well, although the position of the highest-wavelength absorption band is calculated too low. A wrong sign at the longest wavelengths is predicted for 5-MU, likely because of an error in the conformer energies obtained from MD. Indeed, experimental ECD spectra of U and 5-MU are quite similar, i.e. the effect of the methylation seems to be overestimated in the simulations. Part of this inconsistency can also be explained by the main absorption band (exp. ∼ 268 nm) calculated too low (∼256 nm).
Purine-based A, G and dG compounds have much weaker mostly negative experimental ECD within 230–300 nm, with a stronger negative band around 195 nm. The overall trend seems to be reasonably predicted by the computations, particularly below 230 nm; yet the simulated intensities at higher wavelengths are overestimated. The best agreement is observed for dG. The U/5-MU and G/dG pairs show similar experimental but different computed spectra, which may indicate problems with the MD force field providing too different relative free energies.
As for the absorption, all nucleosides have calculated MCD spectra very similar to those of the parent bases (cf. Fig. 3 and S3†). This has been also observed experimentally.40 The simulations provide the basic MCD sign pattern correctly, although for the pyrimidine bases (C, U, 5-MU) the simulated intensities are overestimated. The MCD intensity overestimation seems to be occurring both within the DFT framework4 and wavefunction approaches.7 For the purine A, G and dG nucleosides the simulated curves follow the experiment more closely than for C, U and 5-MU.
Accuracy of simulated spectra
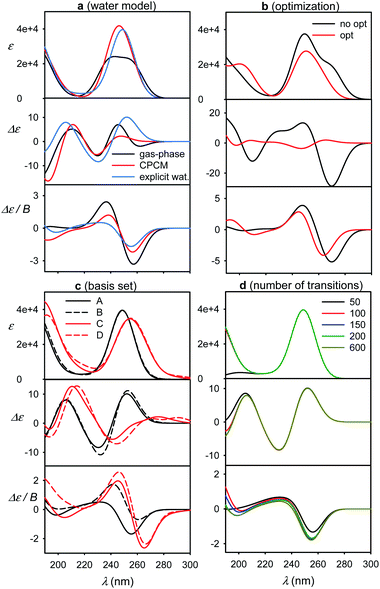
Some factors affecting the error of simulated spectra are investigated in Fig. 4 for a guanosine–water cluster obtained during the MD run. Similarly as found before,4,7 the aqueous solvent does not seem to radically change the spectral sign patterns. Nevertheless, it causes minor shifts of peak positions and large variations (∼20–100%) of spectral intensities (Fig. 4a). At longer wavelengths, a negative ECD band calculated around 260 nm disappears when the explicit or CPCM solvent model is applied. Below 180 nm, water participates directly in the electronic transitions, but this region is not accessible with conventional CD instrumentation. Similar results were obtained with 5-MU (Fig. S6†).The optimized geometry provided significantly different ECD spectra than raw MD structures, whereas absorption and MCD are affected less (Fig. 4b). This brings in the necessity to average many MD geometries to obtain converged simulated ECD pattern. For the average, the effect of the partial optimization was much smaller (Fig. 5). ECD is also very sensitive to the basis set size; the 6-31G**/6-311++G** basis set change causes significant changes in the ECD pattern around 260 nm (Fig. 4c). On the other hand, the results are rather indifferent if the basis set varies on water atoms only. The CAM-B3LYP functional provided similar results as B3LYP, giving transition wavelengths even shorter, further from the experiment, although for G and dG it gave more realistic splitting of the longest-wavelength band (Table 1 and Fig. S7†).
Finally, we investigate the dependence of the spectra on the number of transitions involved in the TDDFT calculations (Fig. 4d). This is of practical importance as the computational time steeply increases with it. The experimentally accessible region (∼200–300 nm) comprises about 50 electronic transitions, and few more, centered below 200 nm, may also contribute due to the inhomogeneous band broadening.45 In addition, the MCD signal of a particular transition, unlike for absorption and ECD, is formed by all the electronic transitions in the molecule within the SOS scheme.14,46–48 Fortunately, the contribution of high-energy transitions/electronic states fades rapidly and within 200–300 nm the MCD spectral shape is affected by the short-wavelength transitions only in a minor way. This has been observed also in previous studies.44,49–51 Therefore, we find it reasonable to simulate all spectra with 200 transitions as a default.
Molecular flexibility and spectral averaging
The effect of geometry variations during the MD on the spectra is documented in Fig. 5 for guanosine. 50 geometries (MD snapshots) occurring close to the minimum I were selected. The ten conformers shown in the left part of the figure indicate that ECD spectra significantly vary; the absorption and MCD are affected less. On the right hand side of the figure we see that the optimization effect on the structure is rather modest, partially hidden in the averaging.To account both for the weighting of the six energy minima (presented in Fig. 3) and the geometry dispersion within each conformer class, we generated the spectra for C, 5-MU, A and G as averages of 200 MD structures in Fig. 6. The snapshots were taken during a 100 ns free dynamic run. In general, this approach provides more realistic shapes than the more static model. The absorption intensity of the HOMO–LUMO band still remained overestimated compared to the experiment, but its position moved right, closer to the measured wavelength. Even more beneficial was the averaging for ECD spectra, intensity of which overall decreased and better followed the experimental curves. An extreme example is guanosine (G), where the ECD intensity within 240–300 nm nearly zeroed-out, in agreement with the observation.
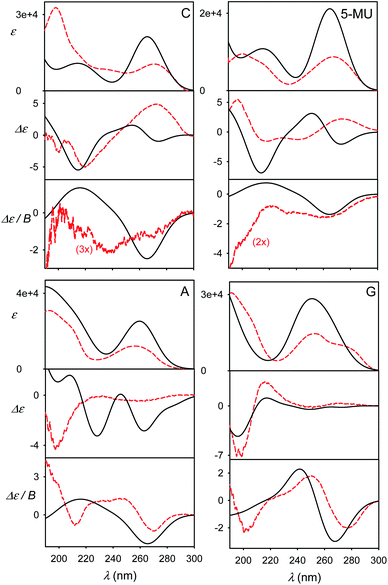 | ||
| Fig. 6 Calculated (black solid) and experimental (red dashed) spectra of four nucleosides, obtained as an average of 200 MD geometries (B3LYP/6-311++G**/CPCM calculation, no explicit waters). | ||
However, the more extensive averaging did not always improve the static result. For example, it predicts two negative ECD bands at 230 nm and 260 nm for A, while the static approach provided only one (250 nm), which better described the broad experimental signal in this region. The remaining inconsistencies can be attributed to an error of the force field/conformational sampling and extreme sensitivity of ECD to the conformation shown in this and previous studies.45,52 Perhaps surprisingly, also the MCD intensities, presumably not so dependent on the conformation, significantly diminished and became more realistic in the more extensive MD averaging. This can be explained by the wavelength shift to longer values for non-equilibrium MD geometries and a reduced coupling between different electronic states determining MCD rotational strengths.13,14,47
As the next step to the two presented computational approaches (Fig. 3 – geometry minima + CPCM, and Fig. 6 – solute geometry averaging + CPCM), an explicit involvement of the solvent to the quantum mechanical computation would be probably desirable.53 However, we find it currently computationally too expensive. In addition, for a guanosine–water cluster, where the solvent was explicitly included, the results were not radically different (Fig. 4, part a). The solvent does affect electronic properties of the chromophores, but the effect can be smaller after the averaging.45 Another increase of accuracy in the future may come from using polarizable54 or ab initio32 force fields, again too expensive at the present stage.
Effects of base pairing and stacking
Different sensitivity of different spectral types can be helpful in nucleic acid structural studies. For example, MCD has been proposed to quantify the content of aromatic residues in proteins55 and similar usage in nucleic acids would presume its relative independence of conformation. For common bases, we compare monomer spectra with those of stacked and planar dimers in Fig. 7. The absorption is clearly not much sensitive to dimer formation, causing typically less than ∼10% intensity changes. As expected, strong ECD signal arises upon the stacking, which is in agreement, for example, with previous measurements on dinucleotides.56 Unlike for adenine, MCD undergoes relatively large changes during the guanine and thymine stacking. Thus, it might potentially serve as a useful indicator of this event. Although average MCD signal might be proportional to the content of aromatic residues, for more precise estimations one has to consider the stacking dependence. Watson–Crick pairs (Fig. 7, bottom) do not provide MCD significantly different from a sum of individual bases, except for the region below 200 nm for guanine/cytosine.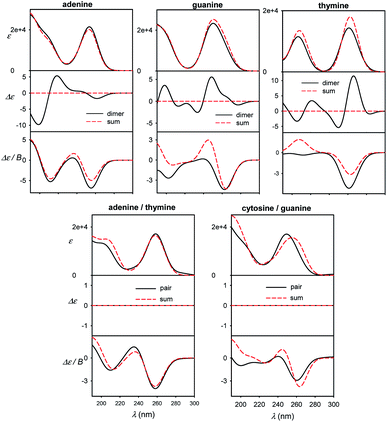 | ||
| Fig. 7 Calculated spectra of B-DNA like stacked dimers (top) and planar Watson–Crick pairs (bottom), compared to plain sums of the bases' spectra, normalized to one base. | ||
In Fig. S8† a similar effect of the pairing is documented for dA–dT and dC–dG Watson–Crick dimers, and homonucleoside dimers d(A)2, (dG)2, (dT)2 mimicking stacking in B-DNA geometry. The sensitivity of the spectra to molecular interactions documents the potential of the optical spectroscopy, once the experimental data can be supported by reliable simulations. The planar pairing of nucleosides has even a bigger effect on absorption and MCD than for the plain bases, suggesting that the sugar part can amplify some interaction effects of the bases on the spectra, maybe through increased molecular polarizabilities.
Further experimental models
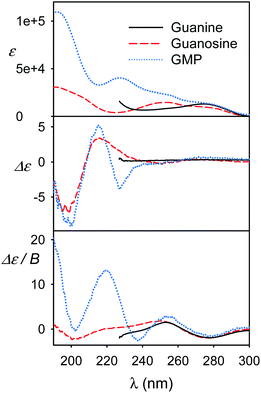
We view the current study as a step on a path to use the full power of the electronic chiral spectroscopy and computations for understanding nucleic acid behavior. It is clear that the accuracy of the simulation method is currently rather limited. Nevertheless, in the light of the results discussed above we can, for example, interpret the guanine, guanosine and GMP spectra in Fig. 8. At wavelengths above ∼240 nm the aromatic signal dominates MCD and all the three compounds have a similar negative signal. The absorption spectra of guanine and guanosine are rather similar, with differences attributed to different experimental conditions (KOH solution for guanine) and perturbation of the π–π* aromatic transitions by the sugar. For GMP, the phosphate group absorption (cf. Fig. S3†) starts to grow strongly below 240 nm. ECD above 240 nm is nearly zero (exactly zero for guanine), because of the plane symmetry of the guanine chromophore. Similar ECD of guanosine and GMP below 240 nm suggests similar conformations. However, MCD spectra differ, perhaps because of the coupling of phosphate and guanine transitions in GMP.Finally, spectra comparison of polyU and polyA with their respective nucleoside monomers (U and A) in Fig. 9 confirms the predicted sensitivity of MCD and particularly ECD to the base stacking. Thus, ECD spectra of polyU and U are generally similar, which suggests a disordered conformation of polyU, where the main source of chirality is local interaction of uridine base with the sugar. Much bigger differences are between ECD spectra of A and polyA, the latter giving strong signals, indicating partially helical arrangement with stacked bases. This is in agreement with previous study based on vibrational circular dichroism.57 Adenosine and polyA MCD is quite similar, in accord with the simulation on the adenine base (Fig. 7). The salmon testes DNA spectra exhibit several features of the simpler systems, although detailed analysis goes beyond the scope of the present study.
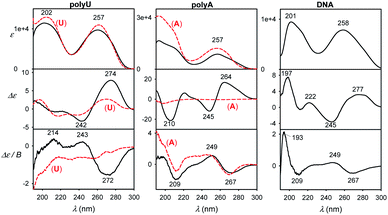 | ||
| Fig. 9 Experimental spectra of longer DNA models normalized to one nucleotide residue (black) and single U or A nucleosides (red, dashed). | ||
Conclusions
We measured absorption, ECD and MCD spectra of several models related to nucleic acids and interpreted them based on combined molecular dynamics and density functional theory models. We found that the effect of conformational averaging and water environment is a dominant factor and must be considered when interpreting the data. For example, some ECD intensities simulated with and without the averaging differed almost by an order of magnitude. The estimation of the factors affecting accuracy of the simulations followed the long-time objective to broaden the application range of optical spectroscopy and better understand the molecular behavior. The simulated spectra reproduced well the main experimental features, although future increase in accuracy is needed for more faithful band-to-band comparison. When this is achieved, the combined experimental/electronic approach will take the electronic spectroscopy in nucleic acid studies to a qualitatively new level. Compared to the static six conformer model, the more extensive MD-based averaging led to an improvement in most cases. The sum-over-state methodology proved to be a handy tool to simulate MCD intensities, which provide additional information on nucleic acid conformation and folding. The combination of multiple spectroscopies and theoretical analysis is a powerful tool for DNA and RNA studies.Conflicts of interest
There are no conflicts to declare.Acknowledgements
We thank Dr Karthick Thangavel for the help with the computations. The project was supported by Ministry of Education (LTAUSA18085, e-INFRA LM2018140, and CZ.02.1.01/0.0/0.0/16_019/0000729) and the Czech Science Foundation (20-10144S).References
- H. Follmann, I. Kuntz and W. Zacharias, Eur. J. Biochem., 1975, 58, 31–41 CrossRef CAS.
- P. Norman, J. Parello, P. L. Polavarapu and M. Linares, Phys. Chem. Chem. Phys., 2015, 17, 21866–21879 RSC.
- F. Di Meo, M. N. Pedersen, J. Rubio-Magnieto, M. Surin, M. Linares and P. Norman, J. Phys. Chem. Lett., 2015, 6, 355–359 CrossRef CAS.
- T. Fahleson, J. Kauczor, P. Norman, F. Santoro, R. Improta and S. Coriani, J. Phys. Chem. A, 2015, 119, 5476–5489 CrossRef CAS.
- D. M. Gray, R. L. Ratliff and M. R. Vaughan, Methods in Enzymology, Academic Press, 1992, vol. 211, pp. 389–406 Search PubMed.
- J. Kypr, I. Kejnovská, D. Renčiuk and M. Vorlíčková, Nucleic Acids Res., 2009, 37, 1713–1725 CrossRef CAS.
- S. K. Khani, R. Faber, F. Santoro, C. Hättig and S. Coriani, J. Chem. Theory Comput., 2019, 15, 1242–1254 CrossRef.
- S. A. Corcelli and J. L. Skinner, J. Phys. Chem. A, 2005, 109, 6154–6165 CrossRef CAS.
- J. Stare, J. Panek, J. Eckert, J. Grdadolnik, J. Mavri and D. Hadži, J. Phys. Chem. A, 2008, 112, 1576–1586 CrossRef CAS.
- P. Bouř, D. Michalík and J. Kapitán, J. Chem. Phys., 2005, 122, 144501 CrossRef.
- F. Furche, R. Ahlrichs, C. Wachsmann, E. Weber, A. Sobanski, F. Vögtle and S. Grimme, J. Am. Chem. Soc., 2000, 122, 1717–1724 CrossRef CAS.
- F. Furche and R. Ahlrichs, J. Chem. Phys., 2002, 117, 7433–7447 CrossRef CAS.
- P. Štěpánek and P. Bouř, J. Comput. Chem., 2015, 36, 723–730 CrossRef.
- P. Štěpánek and P. Bouř, J. Comput. Chem., 2013, 34, 1531–1539 CrossRef.
- G. D. Fasman, B. Schaffhausen, L. Goldsmith and A. Adler, Biochemistry, 1970, 9, 2814–2822 CrossRef CAS.
- W. C. Johnson Jr, in Landolt Bornstein Numerical Data and Functional Relationships in Science and Technology, ed. W. Saenger, Springer-Verlag, Berlin, 1990, vol. 1, pp. 1–24 Search PubMed.
- W. Voelter, R. Records, E. Bunnenberg and C. Djerassi, J. Am. Chem. Soc., 1969, 91, 6165–6172 CrossRef CAS.
- D. Loco, S. Jurinovich, L. Bari and B. Mennucci, Phys. Chem. Chem. Phys., 2016, 18, 866–877 RSC.
- S. Jurinovich, L. Viani, I. G. Prandi, T. Renger and B. Mennucci, Phys. Chem. Chem. Phys., 2015, 17, 14405–14416 RSC.
- M. S. Nørby, J. M. H. Olsen, C. Steinmann and J. Kongsted, J. Chem. Theory Comput., 2017, 13, 4442–4451 CrossRef.
- P. Reinholdt, M. S. Nørby and J. Kongsted, J. Chem. Theory Comput., 2018, 14, 6391–6404 CrossRef CAS.
- A. D. Becke, J. Chem. Phys., 1993, 98, 5648–5652 CrossRef CAS.
- Y. Takano and K. N. Houk, J. Chem. Theory Comput., 2005, 1, 70–77 CrossRef.
- S. Grimme, S. Ehrlich and L. Goerigk, J. Comput. Chem., 2011, 32, 1456–1465 CrossRef CAS.
- T. Yanai, D. Tew and N. C. Handy, Chem. Phys. Lett., 2004, 393, 51–57 CrossRef CAS.
- M. J. Frisch, G. W. Trucks, H. B. Schlegel, G. E. Scuseria, M. A. Robb, J. R. Cheeseman, G. Scalmani, V. Barone, G. A. Petersson, H. Nakatsuji, X. Li, M. Caricato, A. V. Marenich, J. Bloino, B. G. Janesko, R. Gomperts, B. Mennucci, H. P. Hratchian, J. V. Ortiz, A. F. Izmaylov, J. L. Sonnenberg, D. Williams-Young, F. Ding, F. Lipparini, F. Egidi, J. Goings, B. Peng, A. Petrone, T. Henderson, D. Ranasinghe, V. G. Zakrzewski, J. Gao, N. Rega, G. Zheng, W. Liang, M. Hada, M. Ehara, K. Toyota, R. Fukuda, J. Hasegawa, M. Ishida, T. Nakajima, Y. Honda, O. Kitao, H. Nakai, T. Vreven, K. Throssell, J. A. Montgomery Jr, J. E. Peralta, F. Ogliaro, M. J. Bearpark, J. J. Heyd, E. N. Brothers, K. N. Kudin, V. N. Staroverov, T. A. Keith, R. Kobayashi, J. Normand, K. Raghavachari, A. P. Rendell, J. C. Burant, S. S. Iyengar, J. Tomasi, M. Cossi, J. M. Millam, M. Klene, C. Adamo, R. Cammi, J. W. Ochterski, R. L. Martin, K. Morokuma, O. Farkas, J. B. Foresman and D. J. Fox, Gaussian 16 Rev. A.03, Gaussian, Inc., Wallingford, CT, 2016 Search PubMed.
- P. Bouř, Guvcde, electronic spectra calculations, Academy of Sciences, Prague, 2019 Search PubMed.
- D. E. Shaw, Desmond Molecular Dynamics System, D. E. Shaw Research, New York, 2020 Search PubMed.
- G. A. Kaminski, R. A. Friesner, J. Tirado-Rives and W. L. Jorgensen, J. Phys. Chem. B, 2001, 105, 6474–6487 CrossRef CAS.
- W. L. Jorgensen, J. Chandrasekhar and J. D. Madura, J. Chem. Phys., 1983, 79, 926–935 CrossRef CAS.
- Schrödinger Release 2020-4: Maestro, Schrödinger, New York, 2020 Search PubMed.
- K. H. Hopmann, K. Ruud, M. Pecul, A. Kudelski, M. Dračínský and P. Bouř, J. Phys. Chem. B, 2011, 115, 4128–4137 CrossRef CAS.
- V. Palivec, V. Kopecký, P. Jungwirth, P. Bouř, J. Kaminský and H. Martinez-Seara, Phys. Chem. Chem. Phys., 2020, 22, 1983–1993 RSC.
- P. Bouř and T. A. Keiderling, J. Chem. Phys., 2002, 117, 4126–4132 CrossRef.
- S. Yamamoto, X. Li, K. Ruud and P. Bouř, J. Chem. Theory Comput., 2012, 8, 977–985 CrossRef CAS.
- A. Klamt and G. Schuurmann, J. Chem. Soc., Perkin Trans. 2, 1993, 799–805 RSC.
- M. Buděšínský, P. Daněček, L. Bednárová, J. Kapitán, V. Baumruk and P. Bouř, J. Phys. Chem. A, 2008, 112, 8633–8640 CrossRef.
- M. Elstner, K. J. Jalkanen, M. Knapp-Mohammady, T. Frauenheim and S. Suhai, Chem. Phys., 2000, 256, 15–27 CrossRef CAS.
- J. D. Yoneda, M. G. Albuquerque, K. Zaccur, P. R. Seidl, R. A. Wheeler, S. E. Boesch, R. B. de Alencastro, M. C. de Souza and V. F. Ferreira, J. Mol. Struct.: THEOCHEM, 2006, 778, 97–103 CrossRef CAS.
- W. Voelter, R. Records, E. Bunnenberg and C. Djerassi, J. Am. Chem. Soc., 1968, 90, 6163–6170 CrossRef CAS.
- N. Lin, H. Solheim, X. Zhao, F. Santoro and K. Ruud, J. Chem. Theory Comput., 2013, 9, 1557–1567 CrossRef CAS.
- F. J. A. Ferrer and F. Santoro, Phys. Chem. Chem. Phys., 2012, 14, 13549–13563 RSC.
- F. Santoro and V. Barone, Int. J. Quantum Chem., 2010, 110, 476–486 CrossRef CAS.
- J. Kaminský, J. Chalupský, P. Štěpánek, J. Křiž and P. Bouř, J. Phys. Chem. A, 2017, 121, 9064–9073 CrossRef.
- J. Šebek, Z. Kejík and P. Bouř, J. Phys. Chem. A, 2006, 110, 4702–4711 CrossRef.
- P. J. Stephens, Adv. Chem. Phys., 1976, 35, 197–264 CAS.
- P. J. Stephens, J. Chem. Phys., 1970, 52, 3489–3516 CrossRef CAS.
- P. J. Stephens, Annu. Rev. Phys. Chem., 1974, 25, 201–232 CrossRef CAS.
- P. Štěpánek, M. Straka, J. Šebestík and P. Bouř, Chem. Phys. Lett., 2016, 647, 117–121 CrossRef.
- P. Štěpánek, M. Straka, V. Andrushchenko and P. Bouř, J. Chem. Phys., 2013, 138, 151103 CrossRef.
- P. Štěpánek, V. Andrushchenko, K. Ruud and P. Bouř, J. Phys. Chem. A, 2012, 116, 778–783 CrossRef.
- J. Kaminský, J. Kubelka and P. Bouř, J. Phys. Chem. A, 2011, 115, 1724–1742 Search PubMed.
- B. Mennucci, C. Cappelli, R. Cammi and J. Tomasi, Chirality, 2011, 23, 717–729 CrossRef CAS.
- C. Zhang, C. Lu, Z. Jing, C. Wu, J. P. Piquemal, J. W. Ponder and P. Ren, J. Chem. Theory Comput., 2018, 14, 2084–2108 CrossRef CAS.
- G. Barth, E. Bunnenberg and C. Djerassi, Anal. Biochem., 1972, 48, 471–479 CrossRef CAS.
- C. R. Cantor, M. M. Warshaw and H. Shapiro, Biopolymers, 1970, 9, 1059–1077 CrossRef CAS.
- V. Andrushchenko, H. Wieser and P. Bouř, J. Phys. Chem. B, 2004, 108, 3899–3911 CrossRef CAS.
Footnote |
| † Electronic supplementary information (ESI) available: Further computational test and details. See DOI: 10.1039/d1ra00076d |
| This journal is © The Royal Society of Chemistry 2021 |

