 Open Access Article
A smart diagnostic tool based on deep kernel learning for on-site determination of phosphate, calcium, and magnesium concentration in a hydroponic system
Vu Ngoc Tuan abc,
Trinh Dinh Dinh
 de,
Wenxin Zhangab,
Abdul Mateen Khattakbf,
Anh Tuan Lebc,
Iftikhar Ahmed Saeedag,
Wanlin Gao*ab and
Minjuan Wang*ab
aKey Laboratory of Agricultural Informatization Standardization, Ministry of Agriculture and Rural Affairs, Beijing 100083, China
bCollege of Information and Electrical Engineering, China Agricultural University, Beijing 100083, China. E-mail: minjuan@cau.edu.cn; gaowlin@cau.edu.cn
cFaculty of Electrical and Electronic Engineering, Nam Dinh University of Technology Education, Nam Dinh 420000, Vietnam
dQuality Testing Lab, Center for Research and Development Science Technology Tien Nong, Thanh Hoa, 442410, Vietnam
eCollege of Chemistry and Chemical Engineering, Beijing Institute of Technology, Beijing, 102488, China
fDepartment of Horticulture, The University of Agriculture, Peshawar 25120, Pakistan
gDepartment of Computer Science, The University of Lahore, Pakistan
First published on 16th March 2021
Abstract
Calcium, phosphate, and magnesium are essential nutrients for plant growth. The in situ determination of these nutrients is an important task for monitoring them in a closed hydroponic system where the nutrient elements need to be individually quantified based on ion-selective electrode (ISE) sensing. The accuracy issue of calcium ISEs due to interference, drift, and ionic strength, and the unavailability of phosphate and magnesium ISEs makes the development of these ion detecting tools hard to set up in a hydroponic system. This study modeled and evaluated a smart tool for recognising three ions (calcium, phosphate, and magnesium) based on the automatic multivariate standard addition method (AMSAM) and deep kernel learning (DKL) model. The purpose was to improve the accuracy of calcium ISEs, determining phosphate through cobalt electrochemistry, and soft sensing of magnesium ions. The model provided better performance in on-site detecting and measuring those ions in a lettuce hydroponic system achieving root mean square errors (RMSEs) of 12.5, 12.1, and 7.5 mg L−1 with coefficients of variation (CVs) below 5.0%, 7.0%, and 10% for determining Ca2+, H2PO4−, and Mg2+ in the range of 150–250, 100–200, and 20–70 mg L−1 respectively. Furthermore, the DKL was implemented for the first time in the third platform (LabVIEW) and deployed to determine three ions in a real on-site hydroponic system. The open architecture of the SDT allowed posting the measured results on a cloud computer. This would help growers monitor their plants' nutrients conveniently. The informative data about the three mentioned ions that have no commercial sensors so far, could be adapted to the other components to develop a fully automated fertigation system for hydroponic production.
1. Introduction
Managing nutrients and monitoring plant growth in a hydroponic system are essential tasks in the modern farming industries. In a soilless cultivation, the total nutrient can be easily manipulated by regularizing electrical conductivity (EC) and pH values. However, the EC, pH based hydroponic systems have issues of imbalanced nutrients caused by the unequal uptake of nutrient ions from a hydroponic solution by different plants species. This is one of the major reasons for reduction in crop productivity and quality in the closed-loop hydroponic systems.1 Therefore, the nutrient management systems need to be equipped with real-time diagnostics, controlling essential nutrient elements individually. Thus far, such a system is not available commercially because of the lack of feasible ISEs, and the complexity of the on-site measurement of individual ions.A periodical analysis was used as a temporary solution to minimize imbalance in nutrients by adjusting nutrient ratios in the solutions.2 However, this method was inefficient to induce extra water and loss of nutrient control because of no real-time feedback. The ISEs were used as an efficient method to overcome this problem. They supply timely feedback to the system on individual ions for on-line regularization of ion ratio in the nutrient solution. Nevertheless, the ISEs based hydroponic systems face other problems, such as interferences (other ions, temperature), changing ionic strength, potential drifts, etc. These negative impacts reduce the accuracy of ISEs measurements and the efficiency of ISEs-based closed-loop hydroponic systems. Especially, a substantial impact is observed on bivalent ions, such as, calcium and magnesium. In this regard, several solutions for improving the accuracy of calcium ISE were proposed. These include, using calibration techniques to reduce drift,3–5 using machine learning techniques (PLS, PCR) to resolve interferences,6 deploying neural network,7 applying the sampling technique and the processing model.4,8 A combination of the sampling technique and advanced model was recently proposed to overcome interferences, drift, and ionic strength.4 However, calcium is a major element that plants require and is difficult to measure with high accuracy in a hydroponic solution, especially in the on-site scenario. Therefore, further validation needs to be done to measure calcium ion with high precision in a hydroponic solution.
Phosphate is one of the essential plants nutrients that needs to be diagnosed in the hydroponic solution for precision cultivation. Although various studies have focused on developing phosphate sensing, only a few have been able to directly measure phosphate because of its short lifetime, drastically losing sensitivity,9 and crucial interference of other ions.10 Cobalt-wire (Co) was a significant milestone for developing a phosphate selective electrode. It was quite useful in field analyses11 and was cheap, simple, and robust. However, in the wide range of pH states, phosphate anion species (PO43−, HPO42−, H2PO4−) changed, which affected the accuracy phosphate detection. Therefore, quantifying phosphate ion concentration in a hydroponics solution is complicated and less accurate, even with a Co-based electrode10 due to the unstable electrode signal band. Several approaches have been devised to resolve this issue, such as sensing data fusion for detecting H2PO4− concentration in a paprika nutrient solution based on the near-infrared (NIR) spectroscopy technique, cobalt electrochemistry, and artificial neural network (ANN) model.12 Spectroscopy sensing technique aided with the machine learning models is a relatively satisfactory method to detect phosphate ion. However, it is expensive and infeasible for the on-line measurement system.13 Recently Tuan et al.14 proposed an approach combining the multivariate standard addition sampling method and the ANN model for data fusion of four cobalt electrodes. They achieved satisfactory results in determining phosphate ion in eggplant hydroponic solution. Nonetheless, an on-line and feasible phosphate measurement system has not been proposed yet.
Like phosphate, there were many obstacles in developing magnesium ion sensing mechanisms. Several studies devised ionophores for detecting magnesium.15–17 However, due to drift and interference of other ions such as calcium, sulphate, etc., no commercial magnesium ISE was introduced for determining Mg2+ efficiently. This inspired researchers to develop magnesium sensing more efficiently by applying the ISEs with advanced processing techniques. For example, using a solid contact ISE array supported by independent component analysis (ICA) with the genetic algorithm and back-propagation neural network (BPNN).18 This study achieved comparable results. However, it also used complicated processing methods and only worked well in an ideal environmental scenario, where pH, ion strength, temperature, and other forms of interference (from unknown ions) were relatively constant. Atas et al.19 proposed an ISE array electronic tongue that supported the partial least squares (PLS) model for determining magnesium and other elements in solution samples. This provided satisfactory results in determining magnesium, as well as, calcium. However, this approach is still challenging as the lifetime of the electrode is very limited (to almost a single analysis). The analysis time is extended using of a number of solutions. Some studies were recently proposed that combined special sampling techniques and advanced processing models to predict magnesium and phosphate from the raw data of an array of ISEs of other ions. For example, Cho et al.8 used the two-point sampling procedure and ANN to predict the concerned ions from a three ISEs array. However, the prediction magnesium and phosphate detection of the study did not meet the requirements of the actual hydroponic system. Tuan et al.4 combined the multivariate variate standard addition method (MSAM) and the deep kernel learning (DKL) model to improve the prediction results of two unavailable ions (magnesium and phosphate) and six other available ISEs ions. This approach provided a relatively comprehensive solution to resolve the problems of ISEs. With the model, although the prediction of phosphate and magnesium improved considerably, the results are still incomparable with those achieved through actual ISEs. Moreover, the DKL based model of that study was slightly complicated (especially in the case of big data). Implementing DKL in the on-site measurement system has been a challenge because of the computational cost of DKL core. No DKL model has been introduced in the actual system, i.e. the real hydroponic system. Therefore, deploying ISEs and DKL in hydroponics need further studies on evaluating their feasibility in real-time and on-site nutrients monitoring in hydroponic systems.
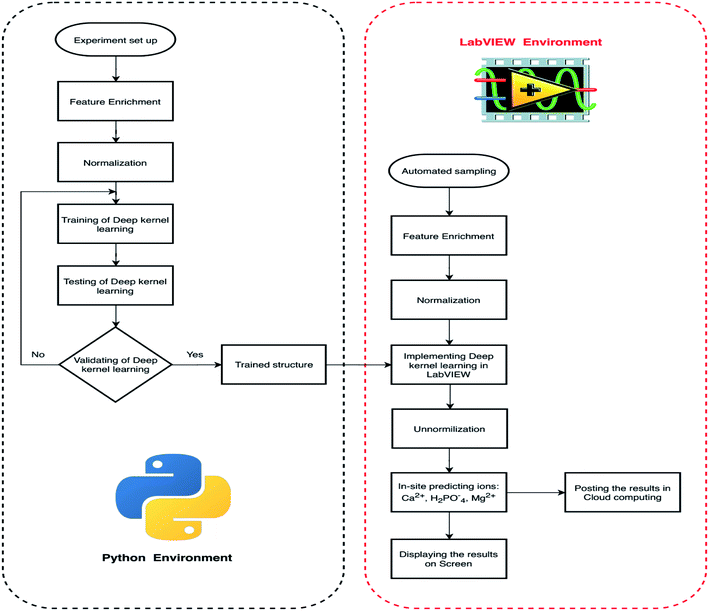
This study proposes a smart diagnostic tool (SDT) for on-site determination of three essential ions in a lettuce hydroponic solution. The multivariate standard addition sampling technique14 was applied to acquire data from one calcium ISE, four cobalt-based phosphate ISEs, and one temperature probe. The DKL, novel processing model,4 was used to improve the accuracies of Ca2+, H2PO4− ISEs and enhance performance of Mg2+ ion prediction. The proposed model was trained and validated with 100 imitated real hydroponic solution samples in a Python environment. The sampling procedure based on the automated multivariate standard addition method (AMSAM) and trained DKL model were implemented in LabVIEW program for real-time monitoring concentrations of three ions in the hydroponic solution. Implementing a smart diagnostic tool based on the automated multivariate standard addition method (AMSAM) and DKL in LabVIEW is a novel approach for on-site monitoring of ions concentration in a hydroponic system. The computational challenge of applying the DKL model in the on-site monitoring system was alleviated by optimizing and implementing the fitted architecture in LabVIEW. Moreover, the predicted concentration values are also posted to the cloud computing as an online database. This cloud database was developed to validate the feasibility of this study in the real hydroponic system, where several modules continuously exchange data and supply information to manage the entire system (Fig. 1).
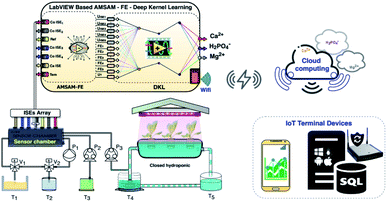 | ||
| Fig. 1 The novel smart diagnostic tool (SDT) based on AMSAM-FE-deep kernel learning for determining calcium, phosphate, and magnesium concentration in a hydroponic system. | ||
2. Materials and methods
2.1. Experiment preparation
| Components | Specification | Manufacturer |
|---|---|---|
| Calcium ISE: Orion 9720BNWP | 0.02–40![[thin space (1/6-em)]](https://www.rsc.org/images/entities/char_2009.gif) 000 mg L−1; PVC membrane 000 mg L−1; PVC membrane |
Thermo Fisher, USA |
| Phosphate ISE1 | Co-metal membrane | Lab design |
| Phosphate ISE2 | Co-metal membrane | Lab design |
| Phosphate ISE3 | Co-metal membrane | Lab design |
| Phosphate ISE4 | Co-metal membrane | Lab design |
| Reference electrode: Orion 900200 | Double conjunction electrode | Thermo Fisher, USA |
| Temperature probe: Pt100 | 0–100 °C; power 24VDC | Yuace, China |
| Electromagnetic valve (V1, V2) | FFY23 series TR-6; 24VDC | Wuxi Teradyne, China |
| Electric pump (P1) | KLP05-6; power 6VDC; flow rate 450 mL min−1 | Kamoer, China |
| Peristaltic pump A (P2) | NKP-DA-S10B; power 24VDC; flow rate 80 mL min−1 | Kamoer, China |
| Peristaltic pump B (P3) | S300-2B-JZ15B; power 24VDC; flow rate 192.39 mL min−1 | Di Chuang, China |
| Acquisition device | NI USB 6218 | National Instrument Corporation, USA |
| Buffer ISEs' signals | INA116 | Texas Instrument, USA |
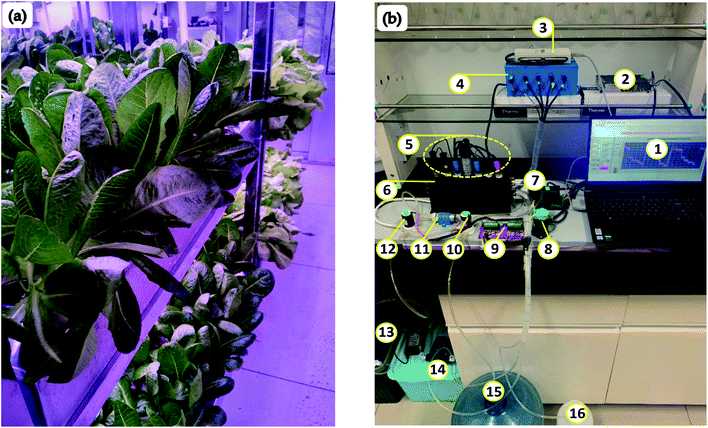
Fig. 2 depicts the progress to develop a smart diagnostic tool to determine three ions in a hydroponic system. The process of developing SDT was divided into two parts, (i) modeling the DKL core model of SDT in Python environment and (ii) implementing the automated multivariate standard addition sampling module and DKL in LabVIEW platform. In the Python environment, the training samples were prepared manually, acquired by a task in the LabVIEW program first, and the data were exported to a comma-separated-values (CSV) file for the DKL model training. To improve the model performance, the raw data features were enriched deploying the feature enrichment technique,14 explained in Section 2.2.2. The dataset was then normalized into a range of [−1, 1] to increase training speed. The normalized dataset was introduced to develop the DKL model. The DKL model was trained, tested, and evaluated by a modeling program based on Python and several Libraries. The trained parameters (including weights, biases, and kernel matrices) were exported to .txt files for implementing the DKL in LabVIEW. In the LabVIEW platform, an automated sampling module based on multivariate standard addition method-MSAM4,14 was developed for an on-site measurement in the actual hydroponic system (see the detail of this module in Section 2.2.1). The samples were enriched with features, normalized, and introduced into the DKL implemented in LabVIEW. The DKL predicts and transfers the outcome of the considered ions concentration via the un-normalized processing. The concentrations of three ions are displayed and also posted to the cloud computing database of ThingSpeak21 open service (Matwork, Natick, MA, USA) for distributed monitoring and manipulating purposes. The real concentration values of the actual samples were analyzed at the Laboratory of Agricultural Informatization Standardization, Ministry of Agriculture and Rural Affairs, CAU, Beijing, China, at the International Joint Research Center of Aerospace Biotechnology and Medical Engineering, Beihang University, Beijing, China, and at Quality Testing Lab, Center for Research and Development Science Technology Tien Nong, Thanh Hoa, Vietnam.
| Ions | Level 1 | Level 2 | Level 3 | Level 4 | Level 5 | Level 6 | Level 7 | Level 8 | Level 9 | Level 10 |
|---|---|---|---|---|---|---|---|---|---|---|
| Calcium (mg L−1) | 10 | 25 | 50 | 75 | 100 | 125 | 175 | 225 | 275 | 350 |
| Phosphate (mg L−1) | 10 | 20 | 45 | 70 | 100 | 150 | 225 | 350 | 500 | 668 |
| Magnesium (mg L−1) | 5 | 15 | 25 | 35 | 45 | 55 | 70 | 85 | 105 | 125 |
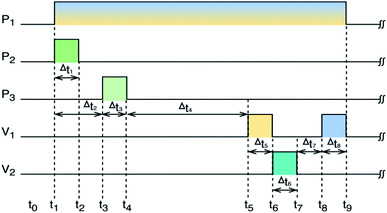
To mimic the matrix background of real hydroponic samples, a basic solution (BS), mixing Hoagland standard solution22 and tap water (1/1 v/v), was used to prepare the training samples. Standard solutions (SS) of 10 mL were prepared by mixing BS solution with appropriate amounts of stock solutions of potassium dihydrogen phosphate, magnesium sulfate, calcium nitrate to range the concentration of concerned ions from the first to the tenth level of 10–350, 10–668 mg L−1, and 5–125 mg L−1 for Ca2+, H2PO4−, and Mg2+, respectively (Table 2). A training sample set for developing the proposed model, having 100 samples, was prepared by using the MSAM technique. KHP buffer solution (25 mL, 0.035 M) was first injected into the sensor chamber. The solution inside the sensor chamber was then cycled by an electric pump (KLP05-6, Kamoer Company, China) until the ISEs' EMFs (U0) were stabilized (about 60 seconds). The standard solution was injected into the chamber. For 3 minutes of cycling, the potentials of the electrodes (Ux) were stabilized. The data acquisition program based on LabVIEW (LabVIEW 2017, National Instrument Corporation, USA) collected the stabilized EMF values and exported them to the CSV file for developing the model. The DKL model was developed by Python 3.6.2, Scikit-Learn library, SciPy, and several third-party libraries, and then implemented by using LabVIEW for the on-site monitoring stage (Fig. 3).
2.2. Development of the smart diagnostic tool
| UFEij = Uxij − U0ij | (1) |
The DKL was modeled by the cross-validation technique with k-fold (k = 10). The dataset was divided into a training set D = {Xi,yi}, i = 1, 2, …,n and a testing set D* = {Xk*,yk*}, k = 1, 2, …, n*. The Gaussian process was defined by three covariance matrices K(X,X) at training locations X, K(X*,X*) at testing locations, and K(X*,X) at training locations and testing locations.26
 | (2) |
The GP stage in DKL has a functional equivalent as an infinite number of nodes Bayesian neural network.27 Therefore, the posterior distribution of the input data was used to predict the expected target ions.
| f(X*)|y(X) ∼ N(μ*,Σ*) | (3) |
| μ* = m(X*) + K(X*,X)[K(X,X) + σ2I]−1(y(X) − m(X)) | (4) |
| μ* = f(X*) = K(X*,X)[K(X,X) + σ2I]−1y(X) | (5) |
Eqn (5) was used to compute the prediction of the outputs of DKL. To conveniently implement the DKL and calculate the predictions in a different environment (for example, LabVIEW), we can compute the predictions as follows26
| μ* = f(X*) = K(X*,X)α | (6) |
The given data were processed in two stages. First, in the forward stage of the neural network, the high-dimensional input vector was propagated to the lower-dimensional vector. The low-dimensional data were then processed by the GP stage. The DKL architecture is also considered as a stand-alone deep kernel-based GP.25 Thus we can use expression (7) to describe the structure of DKL with a base kernel k(x[i],x[j]|θ) and kernel parameters θ.
| k(x[i],x[j]|θ) → k(g(x[i],w),g(x[j],w)|θ,w) | (7) |
The neural network performs a non-linear mapping by g(x,w), and the weight parameter (w). Kernel RBF, dot-product, and Matérn kernel (Table 3) were used to estimate the fitted architecture of the DKL model. The maximizing log marginal likelihood of the targets y was used to perform kernel learning algorism for DKL. The probability of the data conditioned only on kernel parameters θ is given as;
log![[thin space (1/6-em)]](https://www.rsc.org/images/entities/char_2009.gif) p(Y|θ,X) ∝ −YT(Kθ(X,X) + σ2I)−1Y − log|Kθ(X,X) + σ2I| p(Y|θ,X) ∝ −YT(Kθ(X,X) + σ2I)−1Y − log|Kθ(X,X) + σ2I|
| (8) |
Modelling DKL concerns optimizing learnable parameters, such as network weights and kernel parameters, and tweaking the hyper-parameters, i.e., the learning rate, number of iterations, and number of neurons (nodes) in each layer of the neural network. First, the hyper-parameters were chosen with appropriate values. Cross-validation over a small hyper-parameter search-space and a systematic optimization-based procedure was then applied to train the model. The main hyper-parameters were tuned, including the number of neurons of each hidden layer, the number of epochs, training iterations, the learning rate, and the prior white-noise level of the Gaussian process (Table 4).
| Parameters | Values |
|---|---|
| Number of layers | 1, 2, 3, 4, 5, 6 |
| Size of hidden layer | 1 to 1000 |
| Transfer function f(x) of hidden layers | Tansig, logsig, linear, ReLU |
| Transfer function of the output layer | ReLU |
| Optimization algorithm | Stochastic gradient descent (SGD), Broyden–Fletcher–Goldfarb–Shanno (BFGS), Adam |
| Dropout rate | 0.5 to 0.99 |
| Learning rate | 0.001 to 0.1 |
| Max number of epochs | 2000 |
| Prior white noise level | 0.001 to 1 |
| Kernel | Radial basic function (RBF), dot-product, Matérn kernel |
| Training goal | 10–6 |
The parameters of the neural stage (w) and kernel parameters of GP (θ) were jointed to all parameters of the DKL, γ = {w,θ}, and eqn (8) was deployed to maximize the log posterior marginal likelihood. The standard back-propagation technique was employed to compute the derivatives concerning the weight variables  . The dropout algorithm was used to resolve the overfitting and local minima problems. The dropout rate ranged from 0.5 to 0.99.28
3. Results
3.1. Determining the core structure of the smart diagnostic tool
DKL model is the core of the smart diagnostic tool. Numerous trials were conducted to determine the major parameters and the hyper-parameters network (Table 4) for the best-fit DKL architecture. Five DKL core structures were considered (Table 5). The DKL model structure was tuned within five layers of the neural network and an RBF kernel-based Gaussian process. The ANN stage of DKL was constructed by the Tanh, ReLU, and linear activation functions. The dropout algorithm was applied to train the network to eliminate overfitting problems and local minima. Adam optimizer and standard mean squared error loss function were adopted for tuning the model.29 Furthermore, to evaluate the most effective model for determining the three ions in the hydroponic nutrient solution, five DKL (DKL1 to DKL5) structures with layers, and nodes were explicitly tuned to determine the suite DKL structure for developing the SDT architecture (Table 6).| Models | Layer 1 | Layer 2 | Layer 3 | Layer 4 | Layer 5 | Opt | LR | N.o.E | KF | ||||||||||
|---|---|---|---|---|---|---|---|---|---|---|---|---|---|---|---|---|---|---|---|
| N.o.N | AF | DR | N.o.N | AF | DR | N.o.N | AF | DR | N.o.N | AF | DR | N.o.N | AF | DR | |||||
| a Number of neurons – N.o.N, activation function – AF, dropout rate – DR, optimizer – Opt, learning rate – LR, number of epochs – N.o.E, kernel function – KF. | |||||||||||||||||||
| DKL1 | 600 | Tanh | 0.99 | 4 | Linear | — | — | — | — | — | — | — | — | — | — | Adam | 0.005 | 1750 | RBF |
| DKL2 | 160 | Tanh | 0.99 | 600 | Tanh | 0.99 | 4 | Linear | — | — | — | — | — | — | — | Adam | 0.005 | 1750 | RBF |
| DKL3 | 160 | Tanh | 0.99 | 160 | Tanh | 0.99 | 600 | ReLU | 0.99 | 4 | Linear | — | — | — | — | Adam | 0.005 | 1750 | RBF |
| DKL4 | 160 | Tanh | 0.99 | 160 | Tanh | 0.99 | 600 | ReLU | 0.99 | 600 | ReLU | 0.99 | 4 | Linear | — | Adam | 0.005 | 1750 | RBF |
| DKL5 | 160 | Tanh | 0.99 | 600 | Tanh | 0.99 | 600 | ReLU | 0.99 | 600 | ReLU | 0.99 | 4 | Linear | — | Adam | 0.005 | 1750 | RBF |
A comparison of the loss values of five cases of DKL architectures corresponding with the number of epochs change is depicted in Fig. 5a. The DKL3 was the best fit structure for SDT because of its lowest loss value. The number of neurons of the last layer of the ANN stage was determined by trading-off the root mean square error values of predicting three ions and the coefficient of principal component (PC) analyzed from the high dimensional data of the AMSAM-FE. Removing PCs from the raw allows the models to eliminate the noise30 and improve predicting targeted ions. The relationship between the number of PCs and the prediction RMSEs of three ions are illustrated in Fig. 5b. The RMSEs of the models achieved the minima values at 4 PCs, and the DKL3's RMSEs values are the lowest (Fig. 5b).
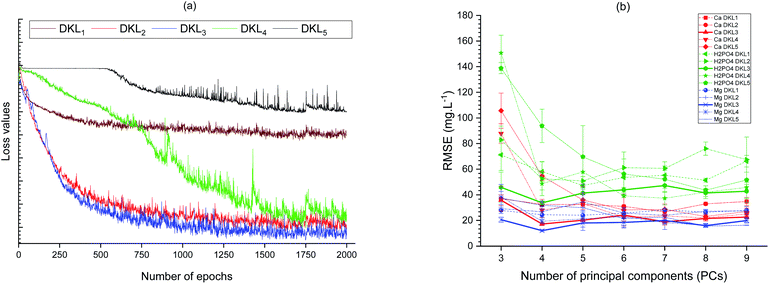 | ||
| Fig. 5 Relationship between the number of epochs and loss values of the models (a), and between PC components and variance of the dataset with RMSEs (b). | ||
3.2. Performance of DKL with lab samples
The prediction of calcium ion was more stable and linear for DKL3 (RMSE 17.63 mg L−1, R2 0.99, and slope 1.005) than for other DKL structures (Fig. 6a). The DKL1 showed a slightly good linear relationship (RMSE 27.02 mg L−1, R2 0.97, and slope 0.93), which was approximate to that of DKL4 (RSME 28.02 mg L−1, R2 0.96, and slope 0.97) but relatively better than those of the DKL2 (RSME 32.52 mg L−1, R2 0.96, and slope 0.97) and DKL5 (RSME 54.91 mg L−1, R2 0.92, and slope 0.86) models.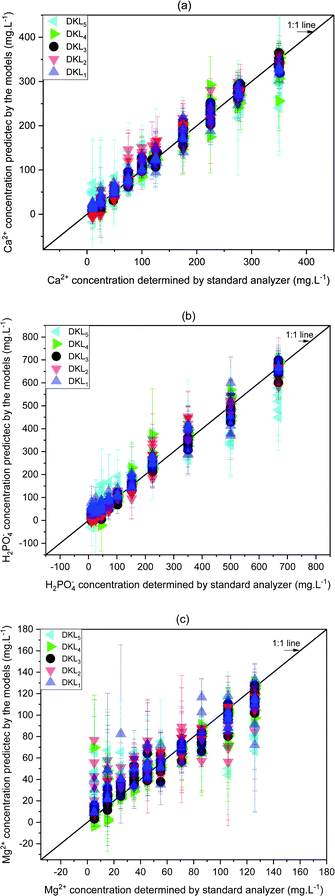 | ||
| Fig. 6 Relationships between predicted ion concentrations of the DKL model and standard analyzers. (a) Ca2+, (b) H2PO4−, and (c) Mg2+. Error bars are three replicates' standard deviations. | ||
Akin to calcium, the phosphate prediction of DKL3 was good too. The DKL3 exhibited enhanced results with lower RMSEs (33.71 mg L−1), higher performance coefficient (0.99), and better slope (0.98). The performance of DKL4 for predicting phosphate was better than those of DKL1, DKL2, and DKL5. The phosphate prediction of DKL5 was the worst with the highest RMSEs and the low linear relationship (RSME 93.79 mg L−1, R2 0.92, and slope 0.82).
The DKL3 exhibited good prediction results not only for available ISE ions (Ca2+, H2PO4−) but also for unavailable ISE ion (Mg2+). The magnesium prediction of DKL3 was satisfactory with relatively low RMSEs, good performance coefficient, and slightly higher slope (RSME 12.51 mg L−1, R2 0.92, and slope 0.86). The magnesium prediction result of DKL4 was better than those of DKL1, DKL2, and DKL5. However, the performance of DKL4 (RSME 17.36 mg L−1, R2 0.91, and slope 0.88) was still lower than that of DKL3. The relationships of the predicted concentrations (y) and the actual values (x) of the models are summarized in Table 6.
| Species | Models | Predicting equation | RMSEa (mg L−1) | Coefficient of performanceb (R2) |
|---|---|---|---|---|
a The  , where n is the total number of data in the training set or test set, yi is the actual ion concentration value, and ŷi is the predicted ion concentration value.b the , where n is the total number of data in the training set or test set, yi is the actual ion concentration value, and ŷi is the predicted ion concentration value.b the  , where ȳi is the average of the test set. , where ȳi is the average of the test set. |
||||
| Calcium | DKL1 | y = 0.93x + 11.81 | 27.02 | 0.97 |
| DKL2 | y = 0.97x + 9.92 | 32.52 | 0.96 | |
| DKL3 | y = 1.005x − 0.21 | 17.63 | 0.99 | |
| DKL4 | y = 0.97x + 4.08 | 28.02 | 0.96 | |
| DKL5 | y = 0.86x + 19.58 | 54.91 | 0.92 | |
| Phosphate | DKL1 | y = 0.93x + 27.17 | 58.22 | 0.97 |
| DKL2 | y = 1.006x + 2.24 | 52.48 | 0.97 | |
| DKL3 | y = 0.98x − 1.28 | 33.71 | 0.99 | |
| DKL4 | y = 1.02x + 3.58 | 48.67 | 0.98 | |
| DKL5 | y = 0.82x + 35.99 | 93.79 | 0.92 | |
| Magnesium | DKL1 | y = 0.74x + 17.07 | 22.43 | 0.85 |
| DKL2 | y = 0.66x + 22.76 | 24.25 | 0.80 | |
| DKL3 | y = 0.86x + 7.65 | 12.51 | 0.92 | |
| DKL4 | y = 0.88x + 5.17 | 17.36 | 0.91 | |
| DKL5 | y = 0.51x + 30.24 | 29.79 | 0.65 | |
3.3. In-line application of the smart diagnostic tool in lettuce hydroponic system
The implementation of these blocks in LabVIEW are explained with the help of mathematical equations as follows.
(a) Normalization input process. As mentioned above, the dataset fed DKL was scaled in the range of [−1 to 1] based on MinMaxScaler of the Scikit Learn library. In the LabVIEW platform, the scaled data (dscaled) was also calculated from the maximum value of data (dmax), the minimum value of data (dmin), the range between dmax and dmin (drange = dmax − dmin), the minimum of scaled value (scalemin = −1), and the maximum of scaled value (scalemax = 1). The dscaled is computed as follows
 | (9) |
Eqn (9) is implemented in LabVIEW for the scaling of input vectors. The implementation is done using mathematical pallets such as divider, subtracter, adder, minima, and maxima.
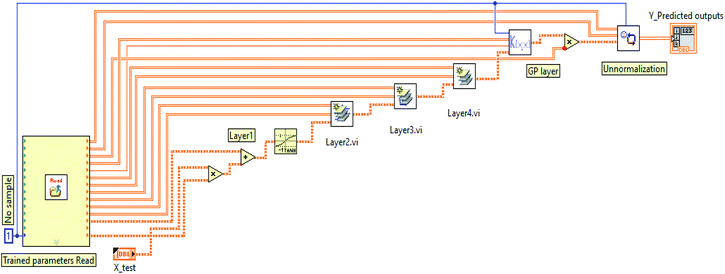
(b) Layer 1. The output (dscaled = X1) of the normalization input processing stage was given to the inputs of layer 1. The weight and bias matrices of layer 1 of the trained DKL were saved as .txt files for implementing the model in LabVIEW. The first layer of DKL performed by sub-program in LabVIEW follows eqn (10)
| Olayer1 = Tanh(W1X1 + b1) | (10) |
Some math tools from the numeric pallet in LabVIEW were used. The weights (W1) were multiplied with the inputs data X1. The production result was added with the biases. The result of this addition was then transformed with a Tanh activation function  .
.
(c) Layer 2. Weight (W2) and bias (b2) matrices of layer 2 saved in .text files were imported in LabVIEW for calculating the second layer of DKL. The output of layer 1 (Olayer1 = X2) was given to layer 2. Thus the output of layer 2 is given by eqn (11)
| Olayer2 = Tanh(W2X2 + b2) | (11) |
The sub-program was also implemented in LabVIEW using the numeric pallet, such as a multiplier, adder, and Tanh function.
(d) Layer 3. Weight (W3) and bias (b3) matrices of layer 3 saved in .text files were further imported in LabVIEW for calculating the third layer of DKL. The output of layer 2 (Olayer2) was given to layer 3 input (X3). Hence the output of layer 3 is presented by eqn (12)
| Olayer3 = ReLU(W3X3 + b3) | (12) |
The sub-program was also implemented in LabVIEW using the numeric pallet, such as multiplier, adder, and ReLU function  .
.
(e) Layer 4. Similarly, weight (W3) and bias (b3) matrices of layer 4 saved in .text files were imported in LabVIEW for calculating the fourth layer of DKL. The output of layer 3 (Olayer3) was given to layer 4 (X4). So the output of layer 4 is shown by eqn (13). The sub-program was also implemented in LabVIEW using the numeric pallet, such as multiplier, adder, and linear function.
| Olayer4 = linear(W4X4 + b4) | (13) |
(f) GP stage. The predicted outputs are computed following eqn (15). That is the product of the covariance matrix of testing data (X*) and training data (X) and the trained hyperparameter (αtrained)
| ypredicted = K(X*,X)[K(X,X) + δn2I]−1y | (14) |
| ypredicted = K(X*,X)αtrained | (15) |
The sub-program was also implemented in LabVIEW by using the numeric pallet, such as product matrix function.
(g) Un-normalization output process. This stage was used to un-normalize the signal from GP output. The values of targets (dunscaled) were calculated by simple functions (i.e., division, subtraction, multiplication, and addition), as the following eqn (16).
 | (16) |
The block diagram of the DKL of the SDT is depicted in Fig. 7. Where X_test = d_scaled comes from the normalization subprogram, Y_predicted output is the target.
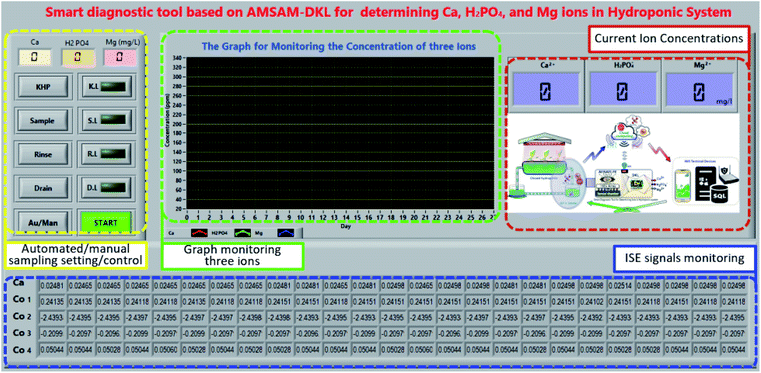
Fig. 8 reveals the front panel of the SDT. The sample setting area, including the numeric controls and the button controls could be used to set the standard concentrations of the three considered ions, and pump the solutions (KHP, sample, and rinse solutions) in automated/manual (Au/Man) mode. The predicted concentrations of the three target ions were displayed on the numeric indicators (current ion concentrations area) and the graph (graph monitoring the three ions area). Besides, the ISEs' EMF was indicated on the ISE signals monitoring area.
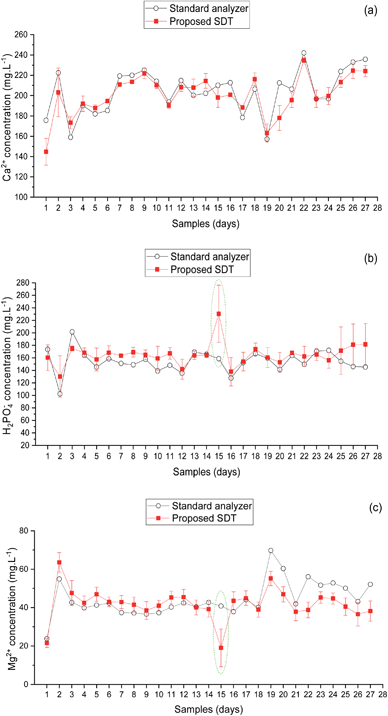 | ||
| Fig. 9 Comparison between predicted ion concentrations of the smart diagnostic tool and standard analyzers. (a) Ca2+, (b) H2PO4−, and (c) Mg2+. Error bars are three replicates' standard deviations. | ||
| Considered Ions | Range of concentration (mg L−1) | Models | Accuracy (RMSE, mg L−1) | Precision (CVa,%) |
|---|---|---|---|---|
a  with the standard deviation (SD), the average concentration of samples (ȳs), the average concentration of measurements (ȳN), and the number of samples (N). with the standard deviation (SD), the average concentration of samples (ȳs), the average concentration of measurements (ȳN), and the number of samples (N). |
||||
| Calcium | 150 to 250 | DKL1 | 29.2 | 8.9 |
| DKL2 | 17.9 | 8.8 | ||
| DKL3 | 12.4 | 4.1 | ||
| DKL4 | 19.3 | 9.2 | ||
| DKL5 | 25.1 | 11.2 | ||
| Phosphate | 100 to 200 | DKL1 | 25.7 | 12.1 |
| DKL2 | 18.2 | 9.8 | ||
| DKL3 | 12.1 | 6.2 | ||
| DKL4 | 24.1 | 10.8 | ||
| DKL5 | 27.8 | 26.6 | ||
| Magnesium | 20 to 70 | DKL1 | 17.2 | 18.1 |
| DKL2 | 10.5 | 11.9 | ||
| DKL3 | 7.5 | 9.6 | ||
| DKL4 | 11.0 | 16.3 | ||
| DKL5 | 13.8 | 56.6 | ||
The calcium prediction results are illustrated in Fig. 9a and Table 7. The results of four DKL showed a relatively accurate prediction with RMSE of 29.2, 17.9, 19.3, and 25.1 mg L−1 and CV of 8.9, 8.8, 9.2, and 11.2%, for DKL1, DKL2, DKL4, and DKL5, respectively. The result of DKL3 was the best with the lowest RMSE of 12.4 mg L−1 and a CV of 4.1%.
Fig. 9b and Table 7 present the prediction results of phosphate ion of the proposed models. The graphs have a trend similar to that of calcium. However, the accuracy of phosphate prediction was slightly lower than that of calcium. The RMSEs were 25.7, 18.2, 12.1, 24.1, and 27.8 mg L−1 with CVs of 12.1, 9.8, 6.2, 10.8, and 26.6%, for DKL1, DKL2, DKL3, DKL4, and DKL5, respectively. Specifically, the error prediction of phosphate at the 15th sample raised sharply. Nevertheless, the precision of phosphate prediction was satisfactory for determining H2PO4− element in the hydroponic system.
The magnesium prediction results are shown in Fig. 9c and Table 7. The results of four DKL models (RMSEs of 17.2, 10.5, 11.0, and 13.8 mg L−1 with respective CVs of 18.1, 11.9, 16.3, and 56.6%, for DKL1, DKL2, DKL4, and DKL5, respectively) showed lower accuracies than those of the DKL3 (RMSE of 7.5 mg L−1 with CV of 9.6%). At the 15th sample, the prediction error of magnesium was substantially higher than those of other samples. The fluctuated magnesium prediction trend was similar to phosphate. However, the trends were opposite (Fig. 9b and c).
4. Discussion
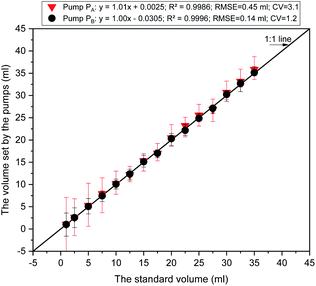
We modeled and implemented a smart diagnostic tool for on-site concentrations measurement of the three ions in a hydroponic system. The core of the SDT was a combination of the AMSAM-FE sampling method and the DKL model. The novel on-site measurement with this approach could overcome the drawbacks of ISEs for determining the concentration of available ISEs ion (Ca) and unavailable ISEs ions (P and Mg). The results showed that the SDT could be used to online-measure three ions in the hydroponic system with a relatively satisfactory accuracy. However, at the 15th sample, the achieved phosphate and magnesium predictions were not high accuracies (see Fig. 9b and c). These errors may be due to an issue with the reference electrode (RE). The inner solution of RE ran out in order to reach the lowest level. That affected the EMF of Co-electrodes over the trained range and caused the inaccuracy predictions. The variating EMF of Co-ISEs also induced inaccuracy in magnesium prediction since magnesium concentration was predicted by fusing the signals from Co-electrodes and calcium electrode (CE). However, the calcium prediction was still stable because CE is a combination electrode (i.e., it has its own independent RE). This is an advantage of the combination electrode technique.The accuracy predictions of the three ions in the on-site measurement task were considerably high. Although slightly lower than those of the training stage, the results showed that the AMSAM developed by low-cost and straightforward components (such as, a Lab 3D printed sensor chamber and a low-cost peristaltic pump (pump A), etc.), was still efficient for developing an affordable and applicable SDT architecture. Fig. 10 illustrates the characteristics of the pump-based sample quantification. Significant linear relationships were found between volumes set by the pumps and the standard volume having small RMSEs of 0.45 and 0.14 mL, CV of 3.1 and 1.2%, and high R2 of 0.9986 and 0.9996 for pump A, pump B, respectively. Furthermore, the results of calcium and phosphate prediction proved that the automated sampling technique based on AMSAM contributed significantly towards the improvement in the prediction accuracy of the two elements. Pre-processing based AMSAM-FE eliminated negative factors, for example, the interferences of ionic strength fluctuation, the matrix background of solution change,4,14 the variation of EMFs (i.e. the fluctuated potentials of ISEs while moving them from the sample to the other solutions32). The samples were regulated at ∼5.0 pH, which facilitated calcium and phosphate ISEs to work well. The feature enrichment signals furnished extra information to the DKL model to improve the three ions prediction accuracies.
The burden of computation was an inherent disadvantage of the general DKL.25 Due to this drawback, DKL was not deployed effectively in the real-time application. On the other hand, LabVIEW is a powerful graphic (G) language that works well with data flow architecture, visual programming, parallel processing, and special real-time interface with the semi-nature system (a system that combines both physical and virtual equipment).31 In this study, LabVIEW was utilized to implement and alleviate the shortcoming of the proposed DKL. Tuning the hyper-parameters (number of hidden layers, number of nodes in each layer, etc.) is the most complicated task in developing the machine learning models. In this experiment, the relationship between the principal components (PCs) of the raw ISEs' data and the RMSEs of the performed models was evaluated to visualize the models' optimizing targets. That can be used to reduce the modeling progress's optimization burden. In general, the fewer the nodes of the last layer of the DNN, the quicker computation of DKL was. Nevertheless, the number of neurons in the last layer of the DNN also affected the DKL performances. Specifically in this scenario, the magnesium is not an available ISEs element. The predicted concentration of magnesium ion depended on both the available ISEs' signals (calcium and phosphate). Therefore, in the few PCs case, original magnesium information in the DNN's output data (the GP input data) may be reduced. That reduces the accuracy of magnesium prediction (Fig. 5 at PCs = 3). Whereas in the 9-PCs case, the model performance was not satisfactory either. The high numbers of PCs mean that the dimensions of given data to the GP stage were high, affecting the DKL models' accuracies.4 The fitted PCs were four at which the RMSEs of the models were minima (Fig. 5b). Moreover, comparing five DKL structures supplied the basis to choose the suitable DKL architecture for the SDT. The DKL1 and DKL2 were constructed with a relatively small DNN core that allows deploying conveniently and fast. However, their performances were not satisfactory because they could not generalize the targets with slightly small data samples in this scenario. The DKL4 and DKL5 architectures achieved relatively satisfactory results. Nevertheless, their big DNN core makes implementing the DKL more complicated and unsuitable for real-time processing requirements. DKL3 was the best model for the SDT. It was a slightly compactable architecture 160-160-600-4-GP (a 160-160-600-4 neural network and a GP stage). The DKL3-based SDT was implemented successfully in LabVIEW platform and worked well with just about 100 milliseconds processing time based on a personal computer (Asus K401L, CPU core i5 2.7 GHz). The DKL3 core was combined with an AMSAM sampling module to build up the SDT by which the three ions (calcium, phosphate, and magnesium) were determined on-site timely.
The fitted DKL structure was verified using the lab samples (Fig. 6) and the real on-site samples (Fig. 9). The performance of DKL3 was better, linear and with lower errors than the other models. Specifically, the results of the training stage (Fig. 6 and Table 6) exhibited that DKL3 was the accomplished model for the SDT, and was trained well with a high coefficient of performance R2 (0.99) and a slope (∼1.0) for calcium. Although the big error occurred at the 15th sample (see Fig. 9) by the draining out of the RE's filling solution, this error could be eliminated by maintaining the inner solution at a suitable level. Therefore, the results of SDT with the real on-site sample from the lettuce hydroponic system were evaluated with 26 samples. DKL3 was the suitable core with the lowest RMSE of 12.4, 12.1, and 7.5 mg L−1 and the lowest CVs of 4.1, 6.2, and 9.6% for predicting calcium, phosphate, and magnesium, respectively (Fig. 9, and Table 7). The satisfying results of DKL3 for determining the concentration of the three ions in the real on-site lettuce hydroponic system proved that DKL-based SDT was implemented entirely in the LabVIEW platform based on the regular functions and Virtual Instruments (VIs). DKL-LabVIEW-based SDT results demonstrate that DKL could be deployed efficiently in the third environment without the complicated machine learning toolkits.
Moreover, the opened connectivity capability of the proposed SDT allows to update data (with determined ions concentration) to cloud computing based on Thingspeak, an open internet of things (IoT) service (IoBridge, Marlborough, MA, USA). The growers can access SDT's database from any static or mobile device (computers or smartphones etc.) via the Web platform. The posted data from SDT are updated per every 15 seconds of time. It is entirely applicable for deploying the remote monitoring system, the IoT-based control system in big modern agricultural projects. SDT can also work well as an intelligent edge computing supplied diagnosed nutrient information and plant growth stage for the 4.0 technology-based agriculture systems.21 Fig. 11 presents the application of SDT in the lettuce hydroponic system (Fig. 11a) and the predicted concentration of the three ions (Fig. 11b).
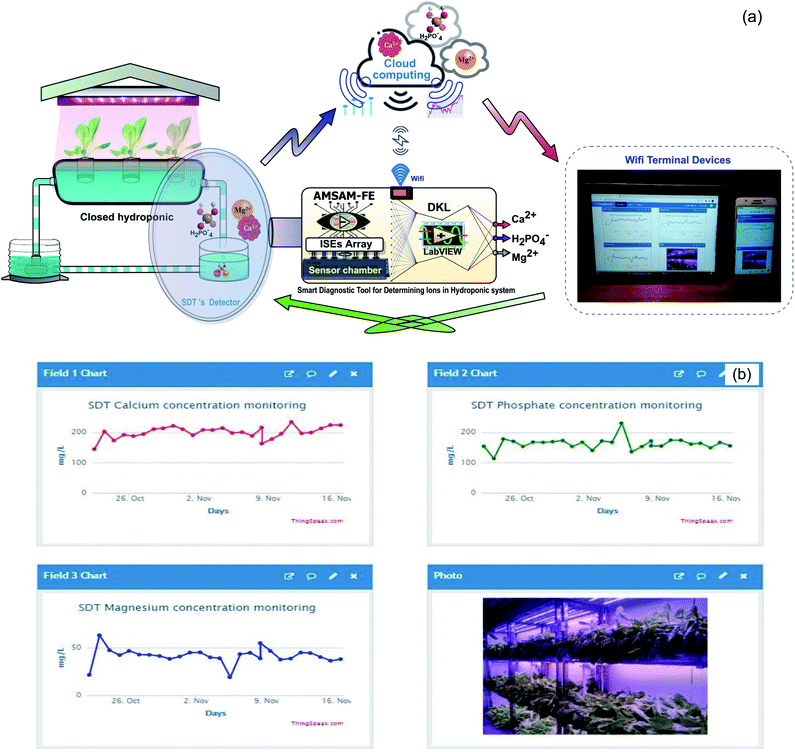 | ||
| Fig. 11 Concentrations of the three ions updated on Thingspeak Web verified SDT feasibility in the field. | ||
5. Conclusion
We developed a smart diagnostic tool for on-site determination of three ions concentration in lettuce hydroponic nutrient solution. The DKL model core of SDT was developed in Python and implemented in the real-time environment (LabVIEW) to undertake the real on-site diagnostic tasks. The AMSAM-FE based acquiring and preprocessing of data and the DKL model were incorporated for developing the SDT that could quantify the concentration of calcium, phosphate, and magnesium on-site. Hardware sampling technique and software signal processing were applied in combination to improve the accuracy of the measurements by resolving the disadvantages of ISEs, for example, signal drifts, interferences, and ionic strength.4The AMSAM developed by the low cost and simple components, such as a 3D printed sensor chamber, two electromagnetic valves, a tiny electric pump, and two peristaltic pumps, effectively sampled and significantly contributed towards improving the accuracy of the SDT. Moreover, the DKL model supported by the MSAM-FE could be modeled satisfactorily with only 100 Lab-synthesized samples. The SDT structure's feasibility was evaluated in the actual lettuce hydroponic system with the real hydroponic solution.
The complicated computation of deploying the DKL in the field was implemented successfully in the LabVIEW for the first time. This exhibits that the DKL can be exploited in solving problems in on-site ions (Ca, P, Mg) concentrations measurement in the actual hydroponic system. This study also showed that the three ions were effectively and accurately diagnosed in real-time by the smart diagnostic tool. The SDT could be used as a component for automated monitoring of plants nutrients in a hydroponic system. It could also be employed in smart sensing that would supply useful information of the three elements to growers or managers for manipulating the hydroponic system through the cloud computing database of on-site measurement of these ions. Moreover, this study suggests that the SDT can be deployed for improving the quality of modern agriculture based on hydroponics and internet of things (IoT) backbone.
This approach proved that the DKL could be implemented in the third environment without the complicated Toolkits or Libraries. That also paved the way for applying the DKL in a real system based on low-cost and straightforward hardware and software platforms.
The results of the proposed approach were rather good with RMSE of 12.5, 12.1, and 7.5 mg L−1 and the CV% of 4.1, 6.2, 9.8 for predicting calcium, phosphate, and magnesium in the range of 150–250, 100–200, and 20–70 mg L−1, respectively. The accuracy of magnesium prediction was slightly lower than those of calcium and phosphate. However, in the unavailable magnesium ISE condition, this approach could still supply magnesium trace for improving the fertilizer management efficiency in a real hydroponic system.
Author contributions
The manuscript was written through contributions of all authors. All authors have given approval to the final version of the manuscript.Funding
This work was supported in part by the Liquor Making Biological Technology and Application of Key laboratory of Sichuan Province (Grant No. NJ2019-02).Conflicts of interest
The authors declare no conflict of interest.Acknowledgements
The authors express their sincere gratitude to the teachers and students of the College of Information and Electrical Engineering, China Agricultural University, Beijing, China, and of International Joint Research Center of Aerospace Biotechnology and Medical Engineering, Beihang University, Beijing, China, and the technicians of Quality Testing Lab, Center for Research and Development Science Technology Tien Nong, Thanh Hoa, Vietnam. for donations in preparing Lab-synthesized samples, and analyzing the hydroponic samples.References
- H. Zekki, L. Gauthier and A. Gosselin, J. Am. Soc. Hortic. Sci., 1996, 121, 1082–1088 Search PubMed.
- M. T. Ko, T. I. Ahn, Y. Y. Cho and J. E. Son, Hortic., Environ. Biotechnol., 2013, 54, 412–421 CrossRef CAS.
- D. H. Jung, H. J. Kim, W. J. Cho, S. H. Park and S. H. Yang, Comput. Electron. Agric., 2019, 156, 660–668 CrossRef.
- T. Vu Ngoc, A. M. Khattak, H. Zhu, W. Gao and M. Wang, Sensors, 2020, 20, 5314 Search PubMed.
- H.-J. Kim, W.-K. Kim, M.-Y. Roh, C.-I. Kang, J.-M. Park and K. A. Sudduth, Comput. Electron. Agric., 2013, 93, 46–54 CrossRef.
- J. Saurina, E. López-Aviles, A. Le Moal and S. Hernández-Cassou, Anal. Chim. Acta, 2002, 464, 89–98 CrossRef CAS.
- L. Wang, Y. Cheng, D. Lamb, P. J. Lesniewski, Z. L. Chen, M. Megharaj and R. Naidu, J. Chemom., 2017, 31, e2870 CrossRef.
- W. J. Cho, H. J. Kim, D. H. Jung, H. J. Han and Y. Y. Cho, Sensors, 2019, 19, 17 Search PubMed.
- A. C. Wilson and K. H. Pool, Anal. Chim. Acta, 1979, 109, 149–155 CrossRef CAS.
- S. A. Glazier and M. A. Arnold, Anal. Chem., 1991, 63, 754–759 CrossRef CAS PubMed.
- R. Marco and P. Alexander, Anal. Commun., 1997, 34, 93–95 RSC.
- D.-H. Jung, H.-J. Kim, H. S. Kim, J. Choi, J. D. Kim and S. H. Park, Sensors, 2019, 19, 2596 CrossRef CAS PubMed.
- W. J. La, K. A. Sudduth, H. J. Kim and S. O. Chung, Trans. ASABE, 2016, 59, 787–794 CrossRef CAS.
- V. N. Tuan, T. D. Dinh, A. M. Khattak, L. Zheng, X. Chu, W. Gao and M. Wang, IEEE Access, 2020, 8, 28289–28300 Search PubMed.
- J. Saurina, E. Lopez-Aviles, A. Le Moal and S. Hernandez-Cassou, Anal. Chim. Acta, 2002, 464, 89–98 CrossRef CAS.
- M. Maj-Zurawska and A. Lewenstam, Talanta, 2011, 87, 295–301 CrossRef CAS PubMed.
- W. Zhang, L. Jenny and U. E. Spichiger, Anal. Sci., 2000, 16, 11–18 CrossRef CAS.
- L. Wang, D. Yang, C. Fang, Z. L. Chen, P. J. Lesniewski, M. Mallavarapu and R. Naidu, Talanta, 2015, 131, 395–403 CrossRef CAS PubMed.
- H. B. Atas, A. Kenar and M. Tastekin, Talanta, 2020, 217, 121110 CrossRef CAS PubMed.
- R. De Marco, B. Pejcic and Z. L. Chen, Analyst, 1998, 123, 1635–1640 RSC.
- ThingSpeak, https://thingspeak.com/, accessed on 8th October 2020.
- L. I. Trejo-Téllez and F. C. Gómez-Merino, in Hydroponics-A Standard Methodology for Plant Biological Researches, InTech, 2012 Search PubMed.
- A. Conagin, D. Barbin, S. S. Zocchi and C. G. B. Demétrio, Rev. Bras. Biomet., 2014, 32, 180–189 Search PubMed.
- J. Magalhaes and A. Machado, Analyst, 2002, 127, 1069–1075 RSC.
- A. G. Wilson, Z. T. Hu, R. Salakhutdinov and E. P. Xing, in Artificial Intelligence and Statistics, ed. A. Gretton and C. C. Robert, Microtome Publishing, Brookline, 2016, vol. 51, pp. 370–378 Search PubMed.
- C. E. Rasmussen and C. Williams, Gaussian Processes for Machine Learning, Cambridge, MA, 2006 Search PubMed.
- R. M. Neal, Bayesian learning for neural networks, Springer Science & Business Media, 2012 Search PubMed.
- N. Srivastava, G. Hinton, A. Krizhevsky, I. Sutskever and R. Salakhutdinov, J. Mach. Learn. Res., 2014, 15, 1929–1958 Search PubMed.
- I. Goodfellow, Y. Bengio and A. Courville, Deep learning, MIT Press, 2016 Search PubMed.
- L. Wang, Y. Cheng, D. Lamb, Z. Chen, P. J. Lesniewski, M. Megharaj and R. Naidu, Environ. Technol. Innovation, 2016, 6, 165–176 CrossRef.
- R. Bitter, T. Mohiuddin and M. Nawrocki, LabVIEW: Advanced programming techniques, CRC Press, 2017 Search PubMed.
- C. C. Rundle, http://www.nico2000.net/Book/Guide1.html, Consulté le 14-sept-2013, 2000.
| This journal is © The Royal Society of Chemistry 2021 |

