 Open Access Article
Rh particles in N-doped porous carbon materials derived from ZIF-8 as an efficient bifunctional electrocatalyst for the ORR and HER†
Can Suna,
Xinde Duanb,
Jiajun Songa,
Mengxian Zhanga,
Yachao Jina,
Mingdao Zhang *a,
Li Song*a and
Hui Cao
 *a
*a
aSchool of Environmental Science and Engineering, Jiangsu Key Laboratory of Atmospheric Environment Monitoring and Pollution Control, Jiangsu Collaborative Innovation Center of Atmospheric Environment, Nanjing University of Information Science & Technology, Nanjing, Jiangsu 210044, P. R. China. E-mail: matchlessjimmy@163.com; songli@nuist.edu.cn; yccaoh@hotmail.com
bSchool of Chemistry and Chemical Engineering, State Key Laboratory of Coordination Chemistry, Collaborative Innovation Center of Advanced Microstructures, Nanjing University, Nanjing, Jiangsu 210044, P. R. China
First published on 13th April 2021
Abstract
Durable and efficient electrocatalysts toward the oxygen reduction reaction (ORR) and hydrogen evolution reaction (HER) are crucial to the development of sustainable energy conversion. In this article, we report a highly active bifunctional electrocatalyst derived from ZIF-8 through simple heat-treatment activation. The resultant catalyst is enriched with Rh nanoparticles in the carbon matrix, showing excellent ORR performance with a half-wave potential (E1/2) of 0.803 V in alkaline electrolytes; it is simultaneously active for catalyzing the HER with an overpotential of 89 mV to reach a current density of 10 mA cm2 in acidic electrolytes. The prepared RhNC-900 catalyst (1.47 wt% Rh) is comparable to the commercial Pt/C catalyst (20 wt% Pt) in terms of the ORR in alkaline media and might inspire new ideas for the development of fuel cells and water splitting.
Introduction
The world's resources are rapidly diminishing and the energy issue is increasingly important in terms of the development of the national economy and the improvement of people's living standards.1 In this context, clean and renewable energy is of wide concern. Among the several forms of clean energy, hydrogen is one of the most promising candidates. Fuel cells, as very clean and efficient energy devices, have attracted public attention in the fields of electric vehicles and the power supply.2 The major performance-limiting factor of fuel cells is the sluggish kinetics of the oxygen reduction reaction (ORR) at the cathode, which has greatly impeded the commercialization process of fuel cells.3 Moreover, the ORR is of great importance in diverse areas, ranging from various energy conversion devices to biosensors.4 In addition, hydrogen production is another big challenge for the development of fuel cells. Among the several reported methods, electrolysis of water to produce hydrogen is one of the most convenient and effective routes. This kind of water decomposition process is limited to a great extent by the hydrogen evolution reaction (HER) and oxygen evolution reaction (OER) at the cathode and anode, respectively.5 Currently, the ORR and HER need a large amount of Pt-based metals to speed up the electrochemical reaction. However, the application of these precious metals is hindered by their high-cost and low-reserves on the earth. As a result, developing highly efficient electrocatalysts for the ORR and HER is one of the high-priority research directions for hydrogen applications. Recently, composite materials with active metal species incorporated into metal–organic frameworks (MOFs) have shown many advantages as a new type of electrocatalyst or as a precursor to prepare highly active electrocatalysts.6 As a specific MOF, zeolite imidazolate frameworks (ZIFs) are widely used for the synthesis of heterogeneous catalysts, due to their well-defined morphology, uniform pore size, and excellent chemical stability.7 In addition, the ZIF can be used as a host with active metal sites incorporated, and can then be carbonized to acquire a porous carbon material with abundant active sites.8 In this work, we develop a facile method to produce a highly effective bifunctional catalyst with Rh dispersed in the porous carbon, employing ZIF-8 as the host for the incorporation of Rh.Experimental section
Materials and measurements
All of the reagents were commercially available and could be used directly without further treatment. The morphology of the materials was investigated by scanning electron microscopy (SEM, Quanta FEG 250), transmission electron microscopy (TEM, JEM-1400plus), and high-resolution transmission electron microscopy (HRTEM, JEM-2100F). X-ray diffraction (XRD) patterns were obtained by using a D8 Advance X-ray power diffractometer at a low scanning speed of 2° min−1. Pawley refinements were performed over the θ range of 5° to 80°. Raman spectra were collected on a Raman spectrometer (RAM II) using a 514 nm laser. Thermogravimetric analysis (TGA) was performed on a Setaram Labsys Evo instrument with a heating rate of 10 °C min−1 in nitrogen. The Brunauer–Emmett–Teller (BET) specific surface areas were measured using an Autosorb-iQ surface area detecting instrument by N2 physisorption at 77 K. X-ray photoelectron spectroscopy (XPS) measurements were carried out on a Thermo Fisher Scientific K-Alpha spectrometer to determine the surface composition. The loading mass of Rh in RhNC-900 was determined by inductively coupled plasma optical emission spectrometry (ICP-OES) on Varian 720-ES.Synthesis of ZIF-8
The synthesis of ZIF-8 was based on a previously reported procedure, with some modifications.9–11 Typically, 810 mg of Zn(NO3)2·6H2O was dissolved in 40 mL of methanol under ultrasonic treatment for 5 min to form a clear solution. This solution was subsequently poured into another clear solution that contained 526 mg of 2-methylimidazole dissolved in 40 mL of methanol. After vigorous stirring for 5 min, the resulting white solution was aged at room temperature for 12 h. The white precipitate was collected by centrifugation and washed subsequently with methanol three times. After drying at 60 °C under vacuum overnight, a white powder was finally obtained.Synthesis of Glu-ZIF and Rh-ZIF
ZIF-8 (50 mg) was dissolved in a solution containing deionized water (2 mL) and a mixture (50 mg) of D-glucosamine hydrochloride and ZnCl2, ensuring that the molar ratio of D-glucosamine hydrochloride and ZnCl2 was 5![[thin space (1/6-em)]](https://www.rsc.org/images/entities/char_2009.gif) :
:![[thin space (1/6-em)]](https://www.rsc.org/images/entities/char_2009.gif) 2. After stirring and ultrasonic treatment for 30 min, the obtained solution was then freeze-dried for 24 h. Eventually, white powders were obtained, which were denoted as Glu-ZIF. The Rh-ZIF samples were obtained using a similar procedure, except replacing the D-glucosamine hydrochloride and ZnCl2 with a mixture of D-glucosamine hydrochloride, ZnCl2 and RhCl3 with a molar ratio of 5
2. After stirring and ultrasonic treatment for 30 min, the obtained solution was then freeze-dried for 24 h. Eventually, white powders were obtained, which were denoted as Glu-ZIF. The Rh-ZIF samples were obtained using a similar procedure, except replacing the D-glucosamine hydrochloride and ZnCl2 with a mixture of D-glucosamine hydrochloride, ZnCl2 and RhCl3 with a molar ratio of 5![[thin space (1/6-em)]](https://www.rsc.org/images/entities/char_2009.gif) :
:![[thin space (1/6-em)]](https://www.rsc.org/images/entities/char_2009.gif) 2:1.
2:1.
Synthesis of porous carbon polyhedra from ZIF-8, Glu-ZIF and Rh-ZIF
Porous carbon polyhedra were prepared by a thermolysis method. Typically, ZIF-8, Glu-ZIF and Rh-ZIF samples were placed in a tube furnace, under an Ar atmosphere, and heated with a two-stage programmed process. The temperature was first raised to 550 °C with a ramping rate of 2 °C min−1 and kept for 3 h. Afterwards, the furnace was heated up to 900 °C with a heating ramp of 3 °C min−1 and maintained for another 3 h. The carbonization product was then cooled to room temperature naturally. The obtained porous carbon materials were labelled as ZIF-900, NC-900 and RhNC-900 (where 900 denotes the ultimate heated temperature).Electrochemical measurement
The electrochemical tests in this work were carried out by using a CHI760 electrochemical workstation with a three-electrode system. A graphitic rod and a saturated calomel electrode (SCE) were used as the counter and reference electrodes, respectively. 2 mL of each catalyst was dissolved in a 1![[thin space (1/6-em)]](https://www.rsc.org/images/entities/char_2009.gif) :
:![[thin space (1/6-em)]](https://www.rsc.org/images/entities/char_2009.gif) 1 solution of 390 μL ethanol and water, and 10 μL of 5 wt% Nafion solution, with ultrasonic treatment for 30 min. A glassy carbon electrode coated with the catalyst was used as the working electrode, with an area of 0.1256 cm−2. Cyclic voltammetry (CV) curves were acquired with the sweep rate of 10 mV s−1 to evaluate the electrochemical activity. Linear sweep voltammetry (LSV) curves (10 mV s−1) were recorded with the assistance of a rotating speed motor (Pine Research Instrument), with a rotating ring disk electrode (RRDE) as the working electrode to further explore the electrochemical features. The durability test of the catalysts was conducted with a timing ampere analysis curve (i–t), after which the LSV curve was recorded for comparison with the original counterpart before the stability test. The ORR performance test was conducted in 0.1 M KOH medium, while the HER activity was recorded in 0.5 M H2SO4 electrolyte. All of the tests were performed at room temperature.
1 solution of 390 μL ethanol and water, and 10 μL of 5 wt% Nafion solution, with ultrasonic treatment for 30 min. A glassy carbon electrode coated with the catalyst was used as the working electrode, with an area of 0.1256 cm−2. Cyclic voltammetry (CV) curves were acquired with the sweep rate of 10 mV s−1 to evaluate the electrochemical activity. Linear sweep voltammetry (LSV) curves (10 mV s−1) were recorded with the assistance of a rotating speed motor (Pine Research Instrument), with a rotating ring disk electrode (RRDE) as the working electrode to further explore the electrochemical features. The durability test of the catalysts was conducted with a timing ampere analysis curve (i–t), after which the LSV curve was recorded for comparison with the original counterpart before the stability test. The ORR performance test was conducted in 0.1 M KOH medium, while the HER activity was recorded in 0.5 M H2SO4 electrolyte. All of the tests were performed at room temperature.
Results and discussion
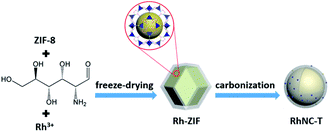
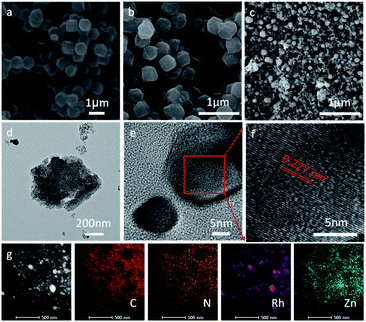
As briefly demonstrated in Scheme 1, ZIF-8 was first synthesized by the coordination of Zn2+ with Melm (Melm = methylimidazole). After the addition of RhCl3, D-glucosamine hydrochloride and ZnCl2, Rh3+ ions would be uniformly immobilized on the surface of ZIF-8 due to the coordination between Rh3+ and Melm, as well as the dispersion effect of ZnCl2. After a carbonization process in Ar, the Rh3 ions would be reduced and transformed into metallic Ru particles, which would be decorated on the surface of the ZIF-8 derived nitrogen-doped porous carbon matrix.10 ZnCl2 was employed in this case to act as a pore-forming additive.The morphologies of ZIF-8, Glu-ZIF, Rh-ZIF and RhNC-T were characterized by scanning electron microscopy (SEM). The SEM images indicated that the obtained ZIF-8 displayed a rhombic dodecahedron shape with a smooth surface (Fig. 1a). The obtained Glu-ZIF (Fig. S1†) and Rh-ZIF (Fig. 1b) retained their initial dodecahedral shape after freeze-drying, but their surface became much rougher. After carbonization, RhNC-T gained a much smaller ambiguous rhombic dodecahedron shape (Fig. 1c and S2†), which was also be confirmed by transmission electron microscopy (TEM). The Rh-ZIF showed a rhombic dodecahedron shape with a smooth surface (Fig. S3†), which is consistent with the SEM result (Fig. 1b). As shown in Fig. 1d, RhNC-900 was decorated with well-dispersed Rh nanoparticles. The high-resolution transmission electron microscopy (HRTEM) image in Fig. 1d shows a nanoparticle on the carbon matrix. This nanoparticle was further observed as shown in Fig. 1e, the lattice of which shows a good crystalline structure. It was found in Fig. 1f that the interplanar spacing is 0.227 nm, corresponding to the (111) facets of Rh (PDF#05-0685). The EDS mapping in Fig. 1g verified the homogeneous distribution of C, N and Zn and the slight agglomeration of Rh over the entire RhNC-900 structure.
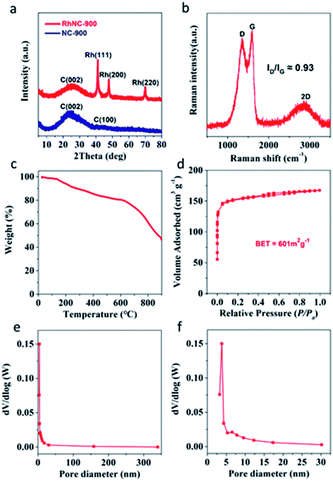
The agglomeration of Rh nanoparticles in RhNC-1000 is more obvious than in RhNC-800 and RhNC-900 (Fig. S4†). Energy Dispersive Spectroscopy (EDS) was also performed to demonstrate the composition of RhNC-900 as shown in Fig. S5,† in which the full spectrum suggests the co-existence of C, O and Rh in the sample. It also presents the characteristic peak of Rh, appearing in the energy range of 2.7 keV and 20 keV. However, the Zn peaks at 1 keV and 8.6 keV, which are present in Rh-ZIF, decrease rapidly compared with the EDS results in RhNC-900. All the samples were also characterized by X-ray diffraction (XRD) (Fig. 2a and S6†). The XRD patterns of the synthesized composite samples are compared with that of ZIF-8 in Fig. S6a.† The ZIF-8 has a well crystallized XRD pattern depicting the characteristic peaks and the Glu-ZIF and Rh-ZIF composites are also dominated by characteristic peaks of ZIF-8. XRD patterns of the samples after different thermal treatments are shown in Fig. S6b.† After the carbonization process, the peaks corresponding to ZIF-8 vanish and new broad peaks corresponding to the characteristic peaks of graphitic carbon [(002) and (100)] appear at 2θ values of 25° and 42.2°, respectively, evidencing the complete conversion of ZIF-8 to carbon at 800 °C, 900 °C and 1000 °C in all the samples (Fig. S6b†).12 Different from NC-900, three other diffraction peaks were observed, which appeared at 2θ values of 41.2°, 47.8° and 69.9° (Rh, PDF#05-0685), indicating the reduction of Rh3+ into metallic Rh in the RhNC-900 catalysts.8 Notably, no diffraction peak assigned to Zn or ZnO species can be discovered, indicative of the atomically dispersed Zn single atoms in the RhNC-900.13 In the Raman spectra, the characteristic peaks at the wave-numbers of around 1350 cm−1 and 1600 cm−1 are assigned to the D and G bands of the carbon structure (Fig. 2b). The peak intensity ratio of the D and G band (ID/IG) is 0.93, indicating the existence of a lot of defects in the amorphous carbon nanosheets. The ratio of ID/IG decreases with the increase of the carbonization temperature from 800 to 900 °C, which is a typical phenomenon of graphitization degree enhancement caused by the increased heat-treatment temperature (Fig. S7†). It also demonstrated that the N-doped carbon matrix has a high degree of graphitization, which provides an excellent conductivity for electron transport in catalytic performance.14–16 It is worth noting that ID/IG increased to a similar value to that at 800 °C when the heat-treatment temperature was set at 1000 °C, implying that pyrolysis at 1000 °C would introduce defects. This result can be ascribed to the fact that Zn would be volatilized at the high temperature of 1000 °C.17
To estimate the stability of the coordination architecture in Rh-ZIF, the thermal behaviour of Rh-ZIF was studied by TGA (Fig. 2c). A weight loss is observed from 25 to 135 °C (Fig. 2c), corresponding to the departure of the lattice water and coordinated water,18 and the small weight loss at the temperature range of 200–615 °C is attributed to the thermal decomposition of Rh-ZIF,19 indicating that the Rh-ZIF is stable up to 615 °C and the framework collapses at 615 °C.18,20 The remarkable hysteresis loop of the RhNC-900 in the N2 adsorption/desorption isotherms (Fig. 2d) indicates its mesoporous nature. In Fig. 2d, the Brunauer–Emmett–Teller (BET) specific surface area of RhNC-900 was calculated to be 601 m2 g−1. The Barrett–Joyner–Halenda (BJH) pore size distribution curve (Fig. 2e and f) indicates a typical mesoporous feature of RhNC-900, which would enhance the mass transport of reaction species and hence the utilization of the catalysts.21,22
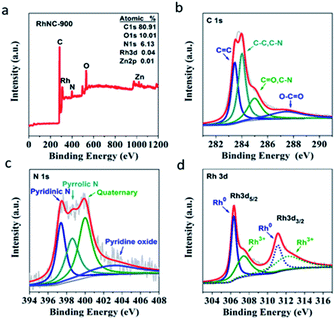
To quantitatively examine the chemical composition and investigate the element bonding configurations, X-ray photoelectron spectroscopy (XPS) was also performed for RhNC-900. From the survey scan spectrum in Fig. 3a, signals from Rh 3p, C 1s, N 1s and O 1s are clearly observed. This further confirms the presence of C, N, O, Zn and Rh elements in RhNC-900. The four separated sub-peaks of the C 1s spectrum in Fig. 3b respectively correspond to C![[double bond, length as m-dash]](https://www.rsc.org/images/entities/char_e001.gif) C (283.5 eV), C–C or C–N (284.0 eV), C
C (283.5 eV), C–C or C–N (284.0 eV), C![[double bond, length as m-dash]](https://www.rsc.org/images/entities/char_e001.gif) O or C–N (285.0 eV), and O–C
O or C–N (285.0 eV), and O–C![[double bond, length as m-dash]](https://www.rsc.org/images/entities/char_e001.gif) O (287.4 eV).23 The separated sub-peaks of the N 1s spectrum in Fig. 3c are respectively matched to pyridinic N (397.4 eV), pyrrolic N (398.5 eV), graphitic N (400.0 eV), and oxidized N (402.8 eV).24 This result indicates that nitrogen was successfully combined with the carbon skeleton to form N-doped porous carbon.13 The abundant N dopants in the catalyst would be helpful to improve the catalytic performance. It was reported that pyridinic N and graphitic N play crucial roles in facilitating the ORR performance as the active sites.25–27 In addition, pyridinic N can serve as metal coordination sites owing to the lone-pair electrons, which can act as an anchoring site to improve the dispersibility of Rh nanoparticles.28 The peaks located at 306.3 eV and 311.1 eV in Rh 3d XPS are ascribed to the metallic state of Rh (Fig. 3d).29 It is worth noting that the peaks located at 307.4 eV and 312.1 eV might be attributed to the oxidized Rh (Rh2O3) on the surface of the RhNC-900, which is inevitable when exposed to air.25 In Table S1,† the prepared RhNC-900 catalyst was tested by Inductively Coupled Plasma Emission Spectrometer (ICP) and the content of Rh element is 1.47 wt%, whose loading is much lower than that of Pt in the commercial Pt/C catalyst (20 wt% Pt).
O (287.4 eV).23 The separated sub-peaks of the N 1s spectrum in Fig. 3c are respectively matched to pyridinic N (397.4 eV), pyrrolic N (398.5 eV), graphitic N (400.0 eV), and oxidized N (402.8 eV).24 This result indicates that nitrogen was successfully combined with the carbon skeleton to form N-doped porous carbon.13 The abundant N dopants in the catalyst would be helpful to improve the catalytic performance. It was reported that pyridinic N and graphitic N play crucial roles in facilitating the ORR performance as the active sites.25–27 In addition, pyridinic N can serve as metal coordination sites owing to the lone-pair electrons, which can act as an anchoring site to improve the dispersibility of Rh nanoparticles.28 The peaks located at 306.3 eV and 311.1 eV in Rh 3d XPS are ascribed to the metallic state of Rh (Fig. 3d).29 It is worth noting that the peaks located at 307.4 eV and 312.1 eV might be attributed to the oxidized Rh (Rh2O3) on the surface of the RhNC-900, which is inevitable when exposed to air.25 In Table S1,† the prepared RhNC-900 catalyst was tested by Inductively Coupled Plasma Emission Spectrometer (ICP) and the content of Rh element is 1.47 wt%, whose loading is much lower than that of Pt in the commercial Pt/C catalyst (20 wt% Pt).
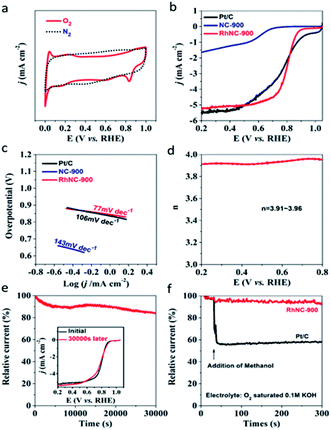
In order to study the electrocatalytic performance of RhNC-900, cyclic voltammetry (CV) measurements were initially carried out in a conventional three-electrode electrochemical cell in an O2-saturated 0.1 M KOH solution. As shown in Fig. 4a, the characteristic cathodic reduction peak could be observed at 0.834 V (Vs. RHE) for RhNC-900, but not in the N2-saturated electrolyte, which verified the oxygen reduction reaction occurring. Among the three samples, RhNC-900 displayed the best electrocatalytic activity with the highest positive peak potential. As demonstrated by the LSV curve in Fig. 4b, RhNC-900 exhibited a half-wave potential (E1/2) of 0.803 V, better than those of NC-900 (0.624 V) and Pt/C (0.795 V). Meanwhile, the Tafel slope values are calculated to be 143, 77 and 106 mV dec−1 for NC-900, RhNC-900 and Pt/C, respectively (Fig. 4c), which appears to follow the same trend of the ORR activity as indicated by the LSV curves in Fig. 4b. In particular, we tested the series of RhNC-T catalysts obtained at different temperatures, and found that RhNC-900 displayed a much more positive peak potential than those of RhNC-800 (0.719 V) and RhNC-1000 (0.724 V) (Fig. S9a†). Furthermore, RhNC-900 also shows a more positive E1/2, which is obviously superior to those of RhNC-800 (0.611 V) and RhNC-1000 (0.666 V), suggesting its excellent ORR activity (Fig. S9b†). The related Tafel slope values are 168 and 138 mV dec−1 for RhNC-800 and RhNC-1000, respectively (Fig. S9c†). These results demonstrate that the ORR activity of RhNC-900 stands out as the best among various catalysts in alkaline media, including Pt/C. Based on the results shown in Fig. 4d, the electron transfer number (n) of RhNC-900 at different potentials could be calculated from the disk current (Id) and ring current (Ir) according to the equation: n = 4NId/(NId + Ir), where Id, Ir and N are the disk current, ring current and current collection efficiency of the Pt ring, which was determined to be 0.40 from the reduction of K3Fe(CN)6. The values for n calculated from RRDE voltammograms are between 3.91 and 3.96 in the potential range of 0.2 to 0.8 V, implying that the ORR proceeds on the RhNC-900 catalyst primarily via a four-electron pathway. Moreover, the ORR kinetics of the RhNC-900 catalysts were investigated according to the Koutecky–Levich (K–L) equation derived from the LSV curves measured at different rotational rates (Fig. S8†). The K–L plots (Fig. S8†) of the RhNC-900 also indicate the nearly four-electron reduction pathway based on the estimated numbers of transferred electrons per O2 molecule of 3.9, 3.8, 3.7 and 3.6 at 0.3 V, 0.4 V, 0.5 V and 0.6 V, respectively. The durability of RhNC-900 was evaluated by recording its current–time chronoamperometric responses during the ORR process. The stability of RhNC-900 towards the ORR was assessed by i–t test for 30![[thin space (1/6-em)]](https://www.rsc.org/images/entities/char_2009.gif) 000 s and the results are shown in Fig. 4e. It is clear that this catalyst exhibits negligible performance loss during the durability test. RhNC-900 exhibits excellent durability with 83.4% retention of the initial current after stability testing. As shown in the inset of Fig. 4e, the LSV curves before and after i–t testing also prove the excellent stability of RhNC-900. The admirable stability of the RhNC-900 electrocatalyst for the ORR should mainly result from the uniform distribution of Rh nanoparticles in RhNC-900. To investigate the potential methanol crossover effects for application in direct methanol fuel cells, methanol (100 μL) was added into the O2-saturated electrochemical cell after about 30 s during the ORR, indicated by the arrow shown in Fig. 4f. The addition of methanol has a negligible impact on the ORR performance of the RhNC-900 catalyst, whereas the current density of the Pt/C catalyst dramatically decreased after methanol addition.
000 s and the results are shown in Fig. 4e. It is clear that this catalyst exhibits negligible performance loss during the durability test. RhNC-900 exhibits excellent durability with 83.4% retention of the initial current after stability testing. As shown in the inset of Fig. 4e, the LSV curves before and after i–t testing also prove the excellent stability of RhNC-900. The admirable stability of the RhNC-900 electrocatalyst for the ORR should mainly result from the uniform distribution of Rh nanoparticles in RhNC-900. To investigate the potential methanol crossover effects for application in direct methanol fuel cells, methanol (100 μL) was added into the O2-saturated electrochemical cell after about 30 s during the ORR, indicated by the arrow shown in Fig. 4f. The addition of methanol has a negligible impact on the ORR performance of the RhNC-900 catalyst, whereas the current density of the Pt/C catalyst dramatically decreased after methanol addition.
Hydrogen evolution activities were also studied as demonstrated in Fig. 5a. Among the three RhNC-900 samples, the RhNC-900 electrode achieved the highest HER catalytic activity in 0.5 M H2SO4 solution. The RhNC-900 electrode showed the highest onset potential (−0.044 V) among the five tested electrodes (Fig. 5a and S10a†). The RhNC-900 electrode also outperformed the other electrodes at the current of 10.0 mA cm−2 with a potential of −0.089 V. The Tafel slope values are 98, 129, 51, 163 and 44 mV dec−1 for NC-900, RhNC-800, RhNC-900, RhNC-1000, and Pt/C, respectively (Fig. 5b and S10b†), and appear to follow the same trend indicated by the LSV curves in Fig. 5a and S10a.† The stability evaluating the performance of a catalyst in the HER was brought into operation by comparing the LSV curves before and after 1000 cycles of CV test at a scan rate of 100 mV s−1. As can be seen in Fig. S11,† the overpotential of RhNC-900 did not change obviously before and after 1000 CV cycles at the current density of 10 mV cm−2. These results demonstrate that the HER activity of RhNC-900 is also very promising.29
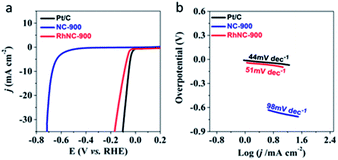 | ||
| Fig. 5 Electrochemical hydrogen reaction of the samples. (a) LSV and (b) Tafel curves of Pt/C, NC-900 and RhNC-900 obtained at an RDE (1600 rpm) recorded in N2-saturated 0.5 M H2SO4 solution. | ||
Conclusions
In conclusion, we have successfully fabricated a highly active RhNC-900 catalyst, which combines the unique advantages of NC and Rh. Specifically, NC exhibits high surface area and high nitrogen content, while Rh nanoparticles function as the active centres. Due to the specific structure of ZIF-8 and the pore-forming role of ZnCl2, Ru is uniformly dispersed on the porous carbon. These properties resulted in good ORR and HER performances. The strategy reported herein can be further expanded to other MOF materials to develop new electrocatalysts with high activity.Author contributions
Can Sun performed the experiments and finished the original draft. Xinde Duan conducted the SEM image observation. Jiajun Song provided the samples of ZIF-8. Mengxian Zhang performed the electrochemical data collection. Mingdao Zhang designed the methodology and administrated the project. Li Song and Hui Cao revised the paper.Conflicts of interest
There are no conflicts to declare.Acknowledgements
This work was funded by grants from the Natural Science Foundation of Jiangsu Province (BK20190786). Meanwhile, this work was supported by Jiangsu Cyan Engineering of Higher Education, Priority Academic Program Development of Jiangsu Higher Education Institutions (PAPD), Jiangsu Joint Laboratory of Atmospheric Pollution Control, and Jiangsu Engineering Technology Research Center of Environmental Cleaning Materials. Li Song and Yachao Jin were financially supported by Research Start-up Fund for Introducing Talent of NUIST.Notes and references
- Y. Shao, Z. Jiang, Q. Zhang and J. Guan, ChemSusChem, 2019, 12, 2133–2146 CrossRef CAS PubMed.
- M. K. Debe, Nature, 2012, 486, 43–51 CrossRef CAS PubMed.
- W. Yang, X. Liu, X. Yue, J. Jia and S. Guo, J. Am. Chem. Soc., 2015, 137, 1436–1439 CrossRef CAS PubMed.
- H. Mei, M. Yang, Y. Shen, F. He, Z. Zhou, X. Chen, Y. Yang, S. Liu and Y. Zhang, Carbon, 2019, 144, 312–320 CrossRef CAS.
- S. Wang, J. Qin, T. Meng and M. Cao, Nano Energy, 2017, 39, 626–638 CrossRef CAS.
- L. Chen, B. Huang, X. Qiu, X. Wang, R. Luque and Y. Li, Chem. Sci., 2016, 7, 228–233 RSC.
- J. Yang, F. Zhang, H. Lu, X. Hong, H. Jiang, Y. Wu and Y. Li, Angew. Chem., Int. Ed. Engl., 2015, 54, 10889–10893 CrossRef CAS PubMed.
- C. Zhu, Q. Shi, B. Z. Xu, S. Fu, G. Wan, C. Yang, S. Yao, J. Song, H. Zhou, D. Du, S. P. Beckman, D. Su and Y. Lin, Adv. Energy Mater., 2018, 8, 1801956 CrossRef.
- Z. Wang, Y. Lu, Y. Yan, T. Y. P. Larissa, X. Zhang, D. Wuu, H. Zhang, Y. Yang and X. Wang, Nano Energy, 2016, 30, 368–378 CrossRef CAS.
- Y. Chen, S. Ji, Y. Wang, J. Dong, W. Chen, Z. Li, R. Shen, L. Zheng, Z. Zhuang, D. Wang and Y. Li, Angew. Chem., Int. Ed. Engl., 2017, 56, 6937–6941 CrossRef CAS PubMed.
- X. Wu, G. Meng, W. Liu, T. Li, Q. Yang, X. Sun and J. Liu, Nano Res., 2017, 11, 163–173 CrossRef.
- M. Thomas, R. Illathvalappil, S. Kurungot, B. N. Nair, A. A. Mohamed, G. M. Anilkumar, T. Yamaguchi and U. S. Hareesh, ACS Appl. Mater. Interfaces, 2016, 8, 29373–29382 CrossRef CAS PubMed.
- Y. Guo, L. Feng, C. Wu, X. Wang and X. Zhang, J. Catal., 2020, 390, 213–223 CrossRef CAS.
- Y. Xu, J. Xue, Q. Zhou, Y. Zheng, X. Chen, S. Liu, Y. Shen and Y. Zhang, Angew. Chem., Int. Ed., 2020, 59, 14498–14503 CrossRef CAS PubMed.
- F. He, L. Mi, Y. Shen, T. Mori, S. Liu and Y. Zhang, ACS Appl. Mater. Interfaces, 2018, 10, 35327–35333 CrossRef CAS PubMed.
- Y. Xu, M. Yan, Z. Liu, J. Wang, Z. Zhai, B. Ren, X. Dong, J. Miao and Z. Liu, Electrochim. Acta, 2020, 363, 137151–137161 CrossRef CAS.
- L. Song, T. Wang, L. Li, C. Wu and J. He, Appl. Catal., B, 2019, 244, 197–205 CrossRef CAS.
- M. Zhang, Q. Dai, H. Zheng, M. Chen and L. Dai, Adv. Mater., 2018, 30, 1705431 CrossRef PubMed.
- D. Huang, Q. Xin, Y. Ni, Y. Shuai, S. Wang, Y. Li, H. Ye, L. Lin, X. Ding and Y. Zhang, RSC Adv., 2018, 8, 6099–6109 RSC.
- U. P. N. Tran, K. K. A. Le and N. T. S. Phan, ACS Catal., 2011, 1, 120–127 CrossRef CAS.
- P. Pachfule, D. Shinde, M. Majumder and Q. Xu, Nat. Chem., 2016, 8, 718–724 CrossRef CAS PubMed.
- S. Zhang, L. Wang, L. Fang, Y. Tian, Y. Tang, X. Niu, Y. Hao and Z. Li, J. Electrochem. Soc., 2020, 167, 054508 CrossRef CAS.
- H. Zhang, S. Hwang, M. Wang, Z. Feng, S. Karakalos, L. Luo, Z. Qiao, X. Xie, C. Wang, D. Su, Y. Shao and G. Wu, J. Am. Chem. Soc., 2017, 139, 14143–14149 CrossRef CAS PubMed.
- L. Lai, J. R. Potts, D. Zhan, L. Wang, C. K. Poh, C. Tang, H. Gong, Z. Shen, J. Lin and R. S. Ruoff, Energy Environ. Sci., 2012, 5, 7936–7942 RSC.
- L. Lin, Q. Zhu and A. W. Xu, J. Am. Chem. Soc., 2014, 136, 11027–11033 CrossRef CAS PubMed.
- D. Guo, R. Shibuya, C. Akiba, S. Saji, T. Kondo and J. Nakamura, Science, 2016, 351, 361–365 CrossRef CAS PubMed.
- R. Liu, D. Wu, X. Feng and K. Mellen, Angew. Chem., Int. Ed., 2010, 49, 2565–2569 CrossRef CAS PubMed.
- Q. Wang, Z. Y. Zhou, Y. J. Lai, Y. You, J. G. Liu, X. L. Wu, E. Terefe, C. Chen, L. Song and M. Rauf, J. Am. Chem. Soc., 2014, 136, 10882–10885 CrossRef CAS PubMed.
- C. Lin, G. Wu, H. Li, Y. Geng, G. Xie, J. Yang, B. Liu and J. Jin, Nanoscale, 2017, 9, 1834–1839 RSC.
Footnote |
| † Electronic supplementary information (ESI) available. See DOI: 10.1039/d1ra00484k |
| This journal is © The Royal Society of Chemistry 2021 |

