 Open Access Article
Creative Commons Attribution 3.0 Unported Licence
An efficient approach to study membrane nano-inclusions: from the complex biological world to a simple representation
M. Lemaalem *,
N. Hadrioui,
S. El Fassi,
A. Derouiche and
H. Ridouane
Laboratoire de Physique des Polymères et Phénomènes Critiques, Sciences Faculty Ben M'Sik, Hassan II University, P.O. Box 7955, Casablanca, Morocco. E-mail: mohammedlemaalem@gmail.com
First published on 16th March 2021
Abstract
Membrane nano-inclusions (NIs) are of great interest in biophysics, materials science, nanotechnology, and medicine. We hypothesized that the NIs within a biological membrane bilayer interact via a simple and efficient interaction potential, inspired by previous experimental and theoretical work. This interaction implicitly treats the membrane lipids but takes into account its effect on the NIs micro-arrangement. Thus, the study of the NIs is simplified to a two-dimensional colloidal system with implicit solvent. We calculated the structural properties from Molecular Dynamics simulations (MD), and we developed a Scaling Theory to discuss their behavior. We determined the thermal properties through potential energy per NI and pressure, and we discussed their variation as a function of the NIs number density. We performed a detailed study of the NIs dynamics using two approaches, MD simulations, and Dynamics Theory. We identified two characteristic values of number density, namely a critical number density nc = 3.67 × 10⁻³ Å−2 corresponded to the apparition of chain-like structures along with the liquid dispersed structure and the gelation number density ng = 8.40 × 10⁻³ Å−2 corresponded to the jamming state. We showed that the aggregation structure of NIs is of fractal dimension dF < 2. Also, we identified three diffusion regimes of membrane NIs, namely, normal for n < nc, subdiffusive for nc ≤ n < ng, and blocked for n ≥ ng. Thus, this paper proposes a simple and effective approach for studying the physical properties of membrane NIs. In particular, our results identify scaling exponents related to the microstructure and dynamics of membrane NIs.
1 Introduction
A lipid bilayer is a thin polar membrane composed of two layers of lipid molecules. These membranes form a continuous barrier around cells and are essential for their homeostasis by regulating the ions' and molecules' diffusion through them.1,2 The cell membrane of almost all living organisms and many viruses are made of a lipid bilayer,3 just like the membranes surrounding the cell nucleus and organelles. The lipid bilayers are impermeable to hydrophilic molecules and particularly to ions. This selectivity enables the cells to regulate, in particular, the pH and salinity of their cytosol by using transmembrane proteins. Thus, provide a transporter function capable of generating and maintaining a concentration gradient and the extracellular environment.4 Biological membranes usually contain other constitutions than phospholipids. These proteins and other integrated components are involved in several pathologies, including cancer.5 In this context, W. Yang et al. reported a mechanism by which the anti-tumor response of cells used in cancer immunotherapy can be potentiated by modulating cholesterol metabolism.6 The cholesterol level in cell membranes determines the physicochemical properties of these membranes.7 In addition to these organic constituents, the membrane may contain inorganic nano-inclusions (NIs), such as small and macro-ions, or more complex structures that can play important roles. In this context, A. O. Elzoghby et al. show that protein–inorganic hybrid nano-inclusions offer promising opportunities for drug delivery and tissue imaging, particularly in the field of oncology.8 Besides, they are the lifeblood in thin-film composite membranes used in desalination.9NIs impose a well-defined membrane deformation is the subject of intensive studies due to the potential opportunities that they offer for biomedical applications in diagnosis and therapy because of their rigidity and their perfect monodispersed character.10–15
To our knowledge, the techniques for determining the physical properties of nano-inclusions remain rare and still to this day a promising field to explore, in particular using MD simulation. However, many theoretical and experimental studies have been interested in determining the interactions between NIs across the membrane.15–20 In this context, I. Koltover and coworkers presented experimental studies of the aggregation of spherical colloidal particles adhering to lipid membranes.18 They observed that two-particles aggregation was found consistent with a short-range-attractive interaction and no obtained sign of a long-range one. Surprisingly, triplets of particles form chains, and a ring-shaped aggregate is observed around the vesicle size. Also, linear chain arrangements are obtained in simulations of similar situations for some particle size and adhesion regimes,19,20 using a scaling argument to show that this was not due to membrane-mediated interactions.20 But it is due to the adhesion of the particles to the membrane since a linear aggregate gives a higher adhesion area than a compact one. Therefore, such a phenomenon would not occur in the case of inclusions.16 Costanza Montis et al. performed several experiments to compare the interaction of Extracellular Vesicles-derived (EVSLB) and synthetic Supported Lipid Bilayers (SLBs) with cationic superparamagnetic iron oxide nanoparticles (SPIONs). Their experimental results revealed that the SPIONs-EVSLBs interaction is significant in comparison to SPIONs-SLBs.17
Particles that form jammed structures are ubiquitous in nature and omnipresent in many consumer products.21 Being metastable solids, they are mechanically rigid structures that generally form at low particle density due to a spatial cluster of aggregated particles. The colloid aggregation is controlled by the number density, the attractive interaction potential, and the temperature.22
Colloid aggregations in spanning network systems are known as gelation or coagulation.23,24 Thus, several works have been devoted to determinating the physical parameters and demonstrating phase boundary mapping of the phase transition by examining a range of volume fractions, temperature, and interaction strength between particles.25–35
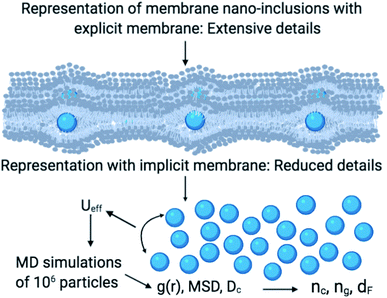
As schematically shown at the top of Fig. 1, membrane nano inclusions interact with the surrounding membrane lipids. Also, they interact with other inclusions. Furthermore, they can form complexes with other membranes NIs and with integral proteins. Thus, an all-atom MD simulation has many details that cost a lot of time in computing and programming skills. A simple alternative is to determine the direct interaction between the particles under study, where the other particles are eliminated and replaced by their effects. These effects appear in the expression of the simplified interaction potential with a relatively simple mathematical formula. From a mesoscopic viewpoint, we consider the membrane constituents as a two-dimensional homogeneous fluid since these biological constituents have almost the same structural and dynamics properties.36 In this case, we simplify the study of the structure and dynamics of NIs into a two-dimensional colloidal system with an implicit solvent (membrane). D. Constantin and coworkers, in 2008, determined the direct interaction potential between BuSn12 NIs inserted within diluted surfactant bilayers by using X-ray synchrotron scattering.15,37 Nine years later, M. Benhamou and coworkers added a prominent correction to describe the interaction between NIs within biological membrane bilayer.38 In the work of Constantin et al.,15,37 the repulsive interaction between inorganic BuSn12 nanoparticles inserted into surfactant bilayers was measured using Small X-ray Synchrotron Scattering. Accordingly, the analysis of the measured structure factor of the two-dimensional fluid formed by the inserted nanoparticles led to their membrane-mediated interaction. This interaction is repulsive and well fitted to a Gaussian function. Thus, M. Benhamou et al.38 have added an attractive term to the repulsive interaction form proposed by D. Constantin. This form can describe will the NIs interaction within a biological membrane bilayer.
In this case, we simplify the study of the structure and dynamics of NIs into a two-dimensional colloidal system with an implicit solvent (membrane). From previous works, D. Constantin and coworkers, in 2008, determined the direct interaction potential between BuSn12 NIs inserted within diluted surfactant bilayers by using X-ray synchrotron scattering.15,37 Nine years later, M. Benhamou and coworkers added a prominent correction to describe the interaction between NIs within biological membrane bilayer.38 In the work of Constantin et al.,15,37 the repulsive interaction between inorganic BuSn12 nanoparticles inserted into surfactant bilayers was measured using Small X-ray Synchrotron Scattering. Accordingly, the analysis of the measured structure factor of the two-dimensional fluid formed by the inserted nanoparticles led to their membrane-mediated interaction. This interaction is repulsive and well fitted to a Gaussian function. Thus, M. Benhamou et al.38 have added an attractive term to the repulsive interaction form proposed by D. Constantin. This form can describe will the NIs interaction within a biological membrane bilayer.
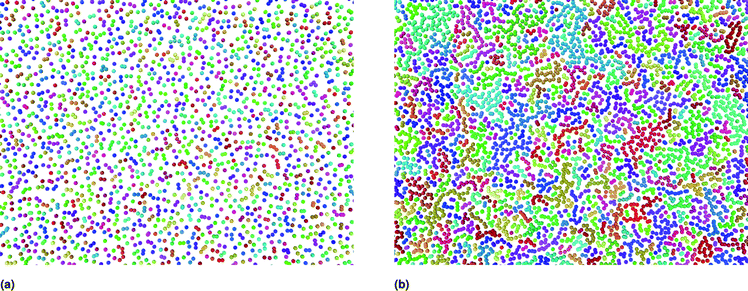
In this work, we expect the NIs to undergo a phase transition, corresponding to the critical and the gelation number-densities, that we note nc and ng, respectively. For these densities, we expect the physical properties to present a discontinuity. For examining this hypothesis, we apply MD simulations, Scaling Theory, and Dynamics Theory to investigate the structure and dynamics of NIs in bilayer membranes. For this, we shall perform a series of simulations for various number densities. Thus, we determine nc and ng, and we quantify the relevant scaling exponents. For this purpose, the structure and dynamics behavior will be discussed using a detailed analysis of the radial distribution function and the mean square displacement. This paper proposes a simple and effective approach for detecting the gelation phenomenon, relevant for many aggregation processes at the level of biological membranes. In particular, our results identify scaling exponents related to the microstructure and dynamics of membrane NIs.
2 Simulation method
2.1 Interaction potential
In this work, we considered an assembly of monodisperse spherical inorganic nanoparticles immersed in a two-dimensional bilayer-membrane. We assumed that these nano-inclusions are rigid and charge-neutral. We denoted by and d = 2R, the nanoparticle number density, and their common diameter, respectively. N accounts for their number, Σ for the membrane area, and R stands for their radius. Because of the membrane undulations, the immersed nanoparticles experience a membrane-mediated repulsive force. The latter was measured using Synchrotron Small-Angle X-ray Scattering.15,37 The interaction potential determined with the help of the structure factor measured using RPA.39 The latter compared to the theoretical one, which explicitly contains the pair-potential. The reference was the structure factor of a hard-core disc model. Herein, we recall simply the expression of the membrane-mediated repulsive potential,
 | (1) |
According to M. Benhamou et al. corrections,38 the characteristics of the membrane κ, γ, the potential amplitude A(n) and the renormalized range ζ(n) depend on the number density of NIs, n. Thus, to propose an explicit variation-law to present these quantities as a function of the density, the authors assert it is a typical value, n0, where the bilayer membrane ceases to be fluid, then becomes rigid. Therefore, at n = n0, the ripple of the membrane disappears, that is, ζ(n) = 0. This implies that A(n) = 0. Also, the authors say that the special value n0 corresponds to the situation where the nanoparticles are extremely congested, then cover the entire surface of the membrane. Thus, n0 is defined as follows:  , where πR2 is the disc surface. Thus, they assume, intuitively, that the amplitude A(n) and the range ζ(n) must decrease when the density n increases. For these quantities, they expect the following approximate forms,
 | (2) |
 | (3) |
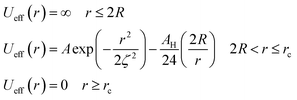
Besides the above repulsive potential, the NIs experience naturally an attractive force of van der Waals type,46
 | (4) |
 | (5) |
 | (6) |
Thus, the pair interaction potential between membrane NIs is the sum of a repulsive term, originating from the bilayer-membrane undulations, and an attractive one derived from the polarity of the host medium. We note that, in contrast to the repulsion, the VDW attraction is negligible for low-density NIs, but it is indispensable for high-density NIs.
2.2 Simulation details
In this work, we discuss a particular type of spherical NIs, namely the BuSn12 nanoparticles. Where BuSn12 denotes {(BuSn)12O14(OH)6}2+(4-CH3C6H4SO3−)2, the butyltin oxo cluster. The synthesis and characterization of BuSn12 is described in detail by Eychenne-Baron et al.48 BuSn12 inclusions are considered as a spherical nanoparticles of radius R = 4.5 Å and molecular weight of 2866.7. The corresponding parameters of the effective interaction potential, discussed above, are as follows: n0 = 15.72 × 10⁻³ Å−2, A0 = 41.1 × 10⁻¹⁹ J, ζ0 = 14.4 Å, and AH = 1.5 × 10⁻¹⁹ J.In the come after, and for a purpose to optimize the calculation time, we use the dimensionless unit, meaning that all quantities are unitless in the MD simulations.49,50 Accordingly, the distance is reduced by the NIs radius R, the number density is reduced by R−2 the energy is reduced by kBT, the temperature is reduced by the room temperature Ta = 298.15 K, the time is reduced by  , and the pressure is reduced by
  . In this work, we calculated all dynamics and structural properties using NΣT MD simulations by analyzing the trajectory of each particle. The simulated system consists of 106 colloidal particles in a square lattice, with applied periodic boundary conditions in the two dimensions. The NΣT statistical ensemble conditions are adjusted using temporal integration on non-Hamiltonian Nose–Hoover motion equations. These equations generate the positions and the velocities sampled from the canonical ensemble (NΣT). Thus, adapt these kinetic quantities of NIs at each time step. This style fixes the temperature by adding dynamics variables coupled with particle velocities. The equations of motion used are those of Shinoda et al.,51 which associate the hydrostatic equations of Martyna et al.52 with the strain energy proposed by Parrinello and Rahman.53 Temporal integration schemes closely follow the Verlet integrators, preserving the measures and reversible in time, derived from Tuckerman et al.54 We performed the MD simulations using the LAMMPS software package.49 We started from a random initial configuration. Then, the initial configuration is equilibrated in the NVT ensemble before the production of the results. In this way, any proposed initial arrangement leads to the same equilibrium. We run the simulations at different densities above and beyond the gelation density
  . The system is balanced long enough (1
![[thin space (1/6-em)]](https://www.rsc.org/images/entities/char_2009.gif) 000
000![[thin space (1/6-em)]](https://www.rsc.org/images/entities/char_2009.gif) 000 time-step) with a time-step Δt* = 0.01.
000 time-step) with a time-step Δt* = 0.01.
To analytically determine nc and ng, we go back to the effective interaction potential. We note that, in addition to the number density, there are other relevant parameters that we have considered fixed, namely the temperature and the NIs size. Practically, we characterized Ueff by two behaviours, attractive or repulsive, in other words, negative or positive. From the literature, M. Benhamou et al. found that nc is unique and given by:38
 | (7) |
 | (8) |
From the theoretical investigation, we summarize the following number density regimes comparing the number density n with the predicted threshold of nc:
(1) Low-density regime corresponding to n < nc: in this regime, the potential exhibits two zeros and two extremums, with an energy barrier between the two zeros. The first extremum is a minimum around which the immersed nanoparticles flocculate. Therefore, in the low-density regime, the potential presents a high energy barrier that prevents NIs gelation.
(2) First critical density regime corresponding to n ≈ nc: for this critical value, the potential is always attractive and exhibits one maximum, which is a zero at the same time for r = ζ(nc) and a secondary minimum at the right. At this specific value of density, the energy barrier disappears.
(3) High-density regime corresponding to n > nc: in this regime, the potential is purely attractive and presents as an increasing monotone function of the surface-distance r. This is the region of a prevised gelation number density ng. The first gelation number density will be determined using MD simulation.
3 Results and discussions
3.1 Structural properties
The structural analysis has been conducted using the two-dimensional Radial Distribution Function (RDF) and Coordination Number (Nc).The RDF is defined as the probability of finding two NIs at a distance r, each to other.
 | (9) |
The average density distribution of NIs, at any point, is referred to as the bulk-density, nb. Thus, the average density of the NIs at a given distance, r, from the center of any considered NIs, nr, is related to RDF by:
| nr = nbg(r) | (10) |
We define the coordination number Nc as the number of neighbors NIs that are within the specified cutoff distance of the pair interaction potential from a central inclusion,
 | (11) |
 | (12) |
| N(r) = rdF | (13) |
Using the definition of N(r) and its relation with RDF mentioned in the above section (eqn (12)) suggests that RDF behaves, as a function of the separation distance, as:
 | (14) |
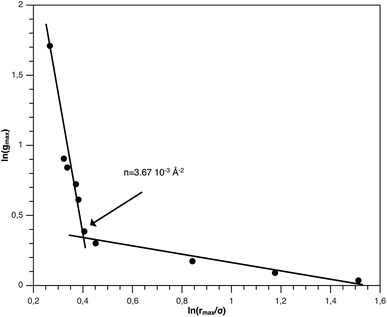
The first precious information we extracted from the RDF scaling-law deals with the principal peak height gmax and its width rmax variation as a function of the NIs number density. Such a law is also valid for r = rmax, and we then write,
 | (15) |
 | (16) |
The Scaling Theory suggests that dF does not depend on the number density n. Thus, the Scaling Theory predicts the dF to be a universal quantity. The amplitude, H, can be obtained by extrapolation on the vertical axis. We recall that since, as part of the Scaling Theory, dF < 2, gmax decreases with the position of the first peak of RDF, rmax.
In Fig. 3, we report RDF versus the dimensionless distance, r* = r/σ, for several values of the NIs density, using MD simulation. Firstly, we remark that at a small distance, compared to the NIs diameter that is for 0 < r < σ, RDF practically vanishes due to the imposed strong steric repulsion between the adjacent NIs, which is applied to prevent the nanoparticles from overlapping. Then, for 0 < r < σ, the NIs present a correlation hole. For distances beyond σ, the NIs show a local order. The latter is due to a strong correlation between NIs. Of course, the size of this region crucially depends on the value of the physical parameters appearing in the interaction potential, in particular, the density of NIs. At a very high distance, however, RDF saturates naturally to 1, whatever is the value of density. This limit means that the NIs are completely disordered in space, i.e., the order is absent at a long-range. Between the two distance-regimes, RDF oscillates and presents as a succession of peaks of decreasing heights that indicating the existence of many shells of neighbours. The locations of maxima of these oscillations correspond to the preferred relative distances between the neighbouring NIs. Secondly, as shown in Fig. 3, the position of the RDF first peak, rmax, is shifted toward the left as the density of NIs increases. This shift is due to a net dominance of the attractive part of the mean-field interaction potential, which is related to the RDF by g(r) = exp(−U/kBT), as shown in Fig. 4. Then, the coordination number, Nc, increases progressively, as observed in Fig. 5.
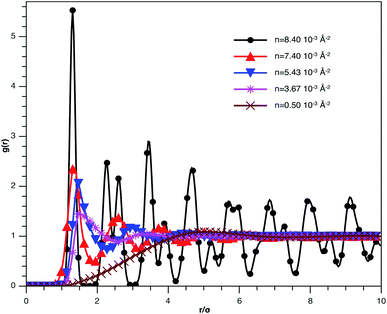 | ||
| Fig. 3 The radial distribution function g(r) between the BuSn12 NIs in the plane of the membrane bilayer, for different number densities, from MD simulation. | ||
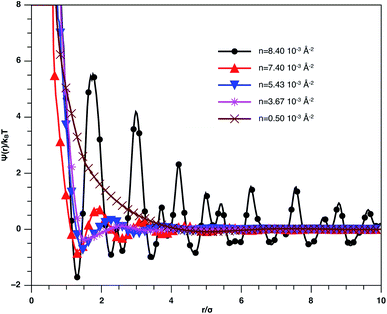 | ||
| Fig. 4 Mean effective interaction potential of the spherical NIs within the bilayers for different number densities, from MD simulation. | ||
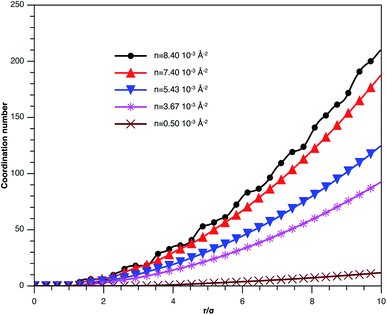 | ||
| Fig. 5 Coordination number Nc of the spherical NIs within the bilayers for different number densities, from MD simulation. | ||
From Fig. 3, we extract the reduced maximum position of the principal peak, rmax/R, for a wide range of NIs number density. A good fit with the calculated numerical data from MD simulation shows that rmax decreases with the NIs number density according to a straight line of the equation,
 | (17) |
Also, Fig. 3 shows that the principal peak-height increased by an increase of the NIs density. We attribute such an increase to a progressive dominance of the attractive part of the mean-field interaction potential of Fig. 4. Thus, the latter gives rise to an aggregation of the NIs in the host membrane. The increase of the maximum, gmax, as a function of rmax/σ is depicted in Fig. 6. The best fit of numerical data gives the following form for gmax.
 | (18) |
The MD calculation of dF is in good agreement with the Scaling Theory, it suggests that for number densities below the gelation one n < nc, dF does not depend on n. In this sense, it is a universal quantity. However, as we will see later, the Scaling theory fails to predict the dF for number densities above the gelation density n > nc, giving negative value of dF. We add that the amplitude, H, can be obtained by extrapolation on the vertical axis. A comparison with the scaling-relation means that the NIs aggregate is fractal and we have, for n ≤ nc, dF = 2 − 0.30 = 1.70. This value is slightly great than the fractal dimension calculated for simple colloidal systems, dF = 5/3,63 that found in good agreement with other experimental results.62,65
These results inspire a more general understanding of the liquid–gel transition in colloidal systems. To discuss the possibility of a reverse gelation process, we recall that the production of amorphous solids from an ordered solid has been identified.66,67 In practice, this transition can be made under the effect of heating or stretching the materials,68,69 which will increase the volume and therefore decrease the density. The flow process, which thins an initial solid material, can be seen as a process opposite to gelation, which solidifies an initially liquid sample. It seems that the observed appearance of stiffness from a fluid state and the onset of the flow of a solid-state are two almost mirroring manifestations of the phase transition.21
3.2 Thermodynamic properties
The aim of this section, recalling that we conducted the simulations in fixed temperature, is to study the effect of NIs number density on the microscopic potential energy, Epot, and the pressure, Press.We calculated the potential energy as:
 | (19) |
We calculated the pressure as:
 | (20) |
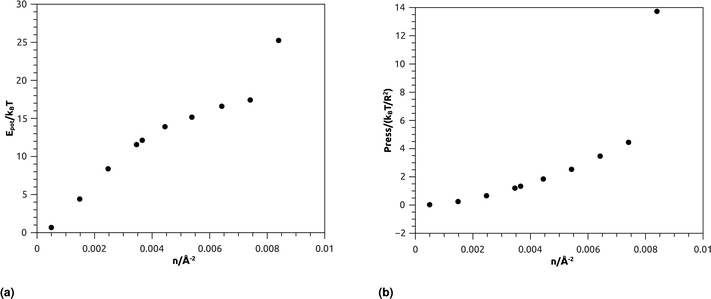 | ||
| Fig. 7 Thermodynamical properties from MD simulation as a function of nano-inclusion density: (a) potential energy, (b) pressure. | ||
Fig. 7b represents the variation of the pressure (Press) as a function of n. The pressure gradually increases with the numerical density, with a relatively faster increase for n > ng, and as well as Epot, shows a noticeable jump for n = nc. The numeric values of Epot and Press are given in Table 1.
| n/(10−3 Å−2) | Potential energy/NkBT | Pressure/(kBT/R2) |
|---|---|---|
| 0.50 | 0.0268648 | 0.67979665 |
| 1.48 | 0.25397951 | 4.4172149 |
| 2.47 | 0.66446969 | 8.3937248 |
| 3.45 | 1.2060298 | 11.56985 |
| 3.67 | 1.3359001 | 12.137332 |
| 4.45 | 1.8514666 | 13.917294 |
| 5.43 | 2.53801 | 15.1734 |
| 6.42 | 3.4698504 | 16.610507 |
| 7.40 | 4.4472106 | 17.42904 |
| 8.40 | 13.734708 | 25.251927 |
3.3 Dynamic properties
We describe the Brownian motion of a NIs by the following phenomenological Langevin equation:
 | (21) |
 | (22) |
| 〈F(t)〉 = 0 | (23) |
| 〈Fs(t)·Fs(0)〉 = 6kBTζδ(t) | (24) |
In the following, we are interested in the mean-square-displacement (MSD) defined as 〈(r − r0)2〉 ≡ 〈Δ2r〉, such as:
 | (25) |
 in two dimensions, by:
| 〈Δ2r〉 = 4Dt, t ≫ τ | (26) |
For t ≪ τ the Taylor development of e−γt gives:  , then we find:
 | (27) |
The analytical determination of the value of α for the subdiffusive regime remains uncertain. However, to predict an approached value of this key parameter, there are developed theoretical approaches based on the inclusion of complex phenomenological memory functions in the generalized Langevin equation. In this context, Zwanzig has developed a Dynamics Theory based on the generalized Langevin equation (GLE) instead of the standard Langevin equation (SLE).71,72 This approach can be adopted to discuss the subdiffusion observed in NIs, which we considered as two-dimensional colloidal particles swimming in a solvent (the host membrane). From a mathematical point of view, it is an extension of the SLE developed to study the dynamics behaviour of simple liquids, where the friction is assumed to be determined using the instantaneous velocity of the particles under study. We note that the difficulty lies in understanding the phenomena of subdiffusion is to explain the cage effect mathematically. Besides, physically speaking, the subdiffusion depends on various parameters, namely, temperature, number density, and finally, and least lost the nature of the host medium. In this context, we express the GLE as,
 | (28) |
 is the relaxation rate, where ζ is the friction coefficient, and m is the mass of the tracer. κ is the memory-function that expresses the friction retardation, and Fs(t) is a random force felt by the moving nano-inclusion due to its collisions with the molecules of the host membrane. Thus, the random force verify the equation,
| 〈Fs(t)·Fs(0)〉 = 6mkBT[γδ(t) + κ(t)], t > 0 | (29) |
For these considerations, VACF solves the following differential equation:
 | (30) |
For the analytical resolution of the GLE equation, we refer to an elegant memory function, proposed by Flenner et al.,73 originally developed to study the dynamics aspect of lipid atoms, which also presents a subdiffusion phenomenon. This approach base on the Zwanzig–Mori projection method to model the 〈Δ2r〉 behaviour.
This is done by involving the equation of motion for the density autocorrelation function Φs(q, t) = 〈n(−q, 0)n(q, t)〉 of a tracer, i.e. a selected particle, at the wave vector q,74
 | (31) |
 , kB stand for the Boltzmann's constant, T denote the temperature and m refer to the nano-inclusion mass.
We obtain the two-dimensional equation of motion of the MSD from:
 | (32) |
 | (33) |
 .
.
The Flenner et al. approach consists of introducing an adequate memory function that explicit three crossover times scales and thus reproduce the ballistic, the normal, and the subdiffusive regimes,73
 | (34) |
We note that, for B = 0, we recover the standard Brownian diffusion laws, and the 〈Δ2r〉 behaves like:
 | (35) |
If (t/τ2)α ≪ 1, then
 | (36) |
The power-law term of the memory function represents the subdiffusion phenomenon. Flenner et al. performed a numerical computation, taking into account this term,73 and revealed that there is a subdiffusive regime with α < 1 intermediating the ballistic and normal regimes. This region is due to a cage effect applied to a considered particle by its surrounding neighbors. Thus, the mean-square-displacement, 〈Δ2r〉, is expressed as:
| 〈Δ2r〉 ∼ tα (α < 0), t > τ2 | (37) |
In this section, we shall discuss the influence of the number density variation on the dynamic properties of the BuSn12 membrane NIs, using NΣT-MD simulations. We recall that the considered NIs are characterized by a radius R = 4.5 Å and molecular weight of 2866.7, the temperature fixes to room temperature, but the number density of NIs varies on a wide range.
In Fig. 8, we present the log–log curve of MSD as a function of reduced time, for different nano-inclusion number density values. For low densities (n < nc = 3.67 × 10⁻³ Å−2), we note that the MSD have two diffusion regimes characterized by a transition time (t ≤ τ), i.e. a ballistic diffusion with an exponent (α = 2) for t ≤ τ and a normal diffusion (α = 1) for t > τ, we notice that τ decreases when n increases, that is to say that the diffusion of the nano-inclusion quickly reaches the normal diffusion. Moreover, for high densities n > nc, we note that the MSDs curves have three diffusion regimes. At more important times, there is a crossing towards the Fickian diffusion with 〈Δ2r〉 = 4Dα=1t, where Dα=1 is the long time self-diffusion coefficient. But, in this crossing region, from the ballistic to the normal diffusion, a subdiffusive region appears where 〈Δ2r〉 = 4Dαtα, with α < 1. The value of Dα<1 is smaller for high density and has a limit value of about 0.5 for the first gelation number density (ng = 8.40 × 10⁻³ Å−2).
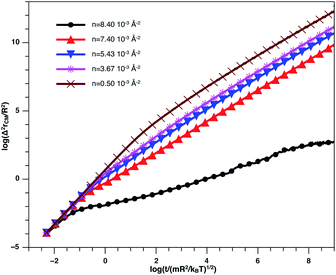 | ||
| Fig. 8 log–log plot of the MSD versus time for the nano-inclusion particles within the bilayers, we calculated from MD simulation. | ||
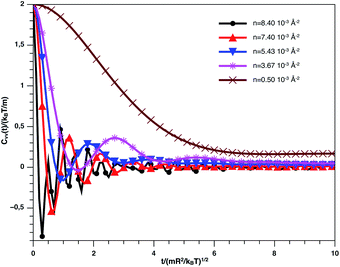
Fig. 9 describes the variation of VACF as a function of time for several number densities, below and above nc. We characterize this function by more pronounced damping oscillations at high density. This behavior is in good agreement with the results of the theory described above. In high density, we attribute the VACF oscillations, which take negative values, to the confinement of each nano-inclusion in a cage formed by their close neighbors. These oscillations signify that the diffusion has a memory. On the other hand, VACF is positive and has few damping oscillations for low densities as a comparison to the high-density systems. Also, we note that the asymptotic behavior of VACF, which reflects the diffusion regime of a studied system, tends towards zero negatively for high-density values, according to the theory described above.
In Table 2, we give the diffusion exponent, α, and the corresponding crossovers time for n < nc. We note that α takes two values, 2 and 1, corresponding to the ballistic and normal regimes, respectively. The crossover time from the ballistic regime to the normal one decrease as the number density increase. This decrease is due to an increase in the correlation between NIs.
| n (10−3 Å−2) | Time interval | α |
|---|---|---|
| 0.50 | t ≤ 1.13 × 10⁻¹⁰ s | 2 |
| t > 1.13 × 10⁻¹⁰ s | 1 | |
| 1.48 | t ≤ 8.34 × 10⁻¹¹ s | 2 |
| t > 8.34 × 10⁻¹¹ s | 1 | |
| 2.47 | t ≤ 5.06 × 10⁻¹¹ s | 2 |
| t > 5.06 × 10⁻¹¹ s | 1 | |
| 3.45 | t ≤ 3.75 × 10⁻¹¹ s | 2 |
| t > 3.75 × 10⁻¹¹ s | 1 |
In Table 3, we give the diffusion exponent, α, and the corresponding crossovers time for n ≥ nc. We note that α takes three values, namely, the two values observed for n < nc (2 and 1), in addition to the value α < 1 corresponding to a subdiffusive regime, which intermediates the ballistic and normal regimes, this is due to the cage effect discussed above. We note that, for the subdiffusive regime, α is not unique for all densities. In fact, α decrease progressively and reaches a limit value α = 0.5 for ng.
| n (10−3 Å−2) | Time interval | α |
|---|---|---|
| 3.67 | t < 1.94 × 10⁻¹¹ s | 2 |
| 1.94 × 10⁻¹¹ s ≤ t ≤ 4.81 × 10⁻¹¹ s | 0.98 | |
| t > 4.81 × 10⁻¹¹ s | 1 | |
| 4.45 | t ≤ 1.68 × 10⁻¹¹ s | 2 |
| 1.68 × 10⁻¹¹ s ≤ t ≤ 5.06 × 10⁻¹¹ s | 0.94 | |
| t > 5.06 × 10⁻¹¹ s | 1 | |
| 5.43 | t ≤ 1.52 × 10⁻¹¹ s | 2 |
| 1.52 × 10⁻¹¹ s ≤ t ≤ 5.21 × 10⁻¹¹ s | 0.91 | |
| t > 5.21 × 10⁻¹¹ s | 1 | |
| 6.42 | t ≤ 9.24 × 10⁻¹¹ s | 2 |
| 9.24 × 10⁻¹¹ s ≤ t ≤ 3.07 × 10⁻¹¹ s | 0.86 | |
| t > 3.07 × 10⁻¹¹ s | 1 | |
| 7.40 | t ≤ 9.06 × 10⁻¹² s | 2 |
| 9.06 × 10⁻¹² s ≤ t ≤ 3.39 × 10⁻¹¹ | 0.80 | |
| t > 3.39 × 10⁻¹¹ | 1 | |
| 8.40 | t ≤ 2.65 × 10⁻¹² | 2 |
| t > 3.95 × 10⁻¹² | 0.5 |
In Table 4, we give the normal diffusion coefficient of BuSn12 NIs, Dα=1, in reduced units and SI units, as a function of n. In Table 5, we give the subdiffusion coefficient Dα<1, corresponding to the subdiffusive regime. We note that the subdiffusion appears for a small time-interval except for the gelation number density ng the NIs dynamics is blocked for a long time. Fig. 10a and b depict the diffusion coefficients Dα=1 and Dα<1, for the BuSn12 NIs, giving in Tables 4 and 5, respectively.
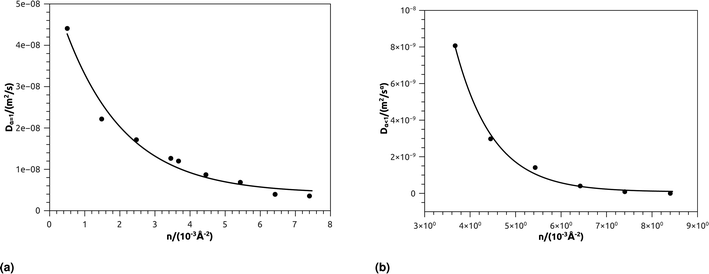 | ||
| Fig. 10 (a) The normal diffusion coefficients Dα=1, and (b) the subdiffusive diffusion coefficients Dα<1 as a function of the number density n, the solid line depict the best exponential decay fit. | ||
We report that the variation of the Dα=1 and Dα<1 as a function of the number density n follow a first-order exponential decay (Arrhenius-like decay).
For Dα=1 we have,
| Dα=1 = D0 + D1e−n/n0 | (38) |
| D0 = 4.16 × 10⁻⁹ m2 s−1 ± 1.67 × 10⁻⁹ m2 s−1 | (39) |
| D1 = 5.16 × 10⁻⁸ m2 s−1 ± 0.35 × 10⁻⁹ m2 s−1 | (40) |
| n0 = 1.73 × 10⁻³ Å−2 ± 0.27 × 10⁻³ Å−2 | (41) |
| Dα=1 = D0 + D1e−n/ng | (42) |
| D0 = 7.96 × 10⁻¹¹ m2 s−1 ± 1.77 × 10⁻¹⁰ m2 s−1 | (43) |
| D1 = 6.25 × 10⁻⁷ m2 s−1 ± 2.93 × 10⁻⁷ m2 s−1 | (44) |
| ng = 8.4 × 10⁻³ Å−2 ± 8.50 × 10⁻⁵ Å−2 | (45) |
We note certain limitations of this study. First, although the calculated properties follow well-established physical laws, the fitted parameters are not universal and depend on other relevant factors, such as the shape and size of the NIs. Therefore, projecting the results of the present study on non-spherical NIs may be inappropriate. Second, we also planned to explore the physical properties at n > ng, but the MD simulation code is proving to be unstable. Possibly the MD divergence is due to the attractive part of the interaction potential.
From the literature, for colloidal suspensions in simple solvent (water, for example), it is known that the subdiffusion phenomenon occurs at high enough number density, which induces the cage effect,75,76 where the diffusion of a selected particle getting trapped in a cage formed by its close neighbors. In contrast, in the present case, we mark that this phenomenon appears for low number densities. It is natural to link the membrane NIs slow diffusion to the nature of the host medium. The latter is a biological membrane composed of highly ordered lipids that tend to limit their diffusivity.
To compare the diffusion of proteins and the diffusion of inorganic NIs within biological membranes, we refer to our recent work.36 In this previous work, we have studied the subdiffusion of cylindrical shaped proteins inclusion in phospholipids mixture bilayer, using coarse-grained MD simulations. Accordingly, for the room temperature, we found a mean subdiffusion exponent of proteins to be α = 0.65, and we found the diffusion coefficient of the order of 10−16 m2 s−1 this range is also found in some experimental works.77–79
In the present work, the diffusion of inorganic nano-inclusion is in the range of 10−14 to 10−9 m2 s−1. These values overlap with those of other similar works, which is in the order of 10−14 m2 s−1,80,81 performed for a number density close to ng.
Thus, we deduce that the diffusion of inorganic NIs is faster in comparison to the organic inclusions.
We recall that synthetic membranes can be composed of single lipids type, the liposome membranes as an example.82,83 But the biological membranes are crowded structures encompassing several lipids types, included and external proteins, and present in different phases, the pulmonary surfactant as an example.36 Thus, the expensive details related to the membrane nature limit the studied number of NIs in an MD simulation. For this purpose, a direct interaction potential between NIs, which respect the membrane fluctuation, permits the study of a large NIs number. Thus, an effective interaction potential cannot provide nanoscopic properties. Although, it gives an overview of the NIs mesoscopic properties. In this context, the NIs are considered a two-dimensional colloidal dispersion system. For simplicity, the nano-inclusions represent the colloidal dispersion, and the membrane is the two-dimensional solvent.
In this work, we studied the BuSn12 nanoparticles as membrane nano-inclusions, and we assumed that they are hard-spheres and charge neutral. We perceive that their interaction-potential form with the appropriate parameters is determined experimentally in previous works by D. Constantin.37
Generally, nano-inclusions can be charged or neutral and present in different shapes and sizes, depending on their applications.84–87 From a mesoscopic viewpoint, MD simulations require appropriate interaction potential forms and parameterizations. These proposed models are often semi-empirical. For instance, the electrostatic interaction due to the surface charge can be modeled using a Yukawa screened coulombic interaction type, mimicking the standard DLVO model for charged colloidal particles in a simple solvent.76,88 Besides, the membrane fluctuation can also depend on the nano-inclusions shape. Thus, the interaction potential form and parameters are specific to each nano-inclusion type and cannot be precisely a Gaussian type.
Consequently, the three scientific approaches encompassing theory, experiment, and simulation are needed to explore the biophysical-chemistry prospects of various nano-inclusions types at different time-length scales.
4 Conclusion
In this work, we performed MD simulations in the NΣT statistical ensemble conditions to study membrane NIs, in which a specific type of nano-inclusion, BuSn12, is discussed in detail. We conducted the study for a wide range of NIs densities. As hypothesized, the calculated physical properties have shown a remarkable discontinuity, corresponding to the critical and gelation number densities. Thus we have provided a mathematical understanding of the spherical NIs aggregation.While previous works study the interactions between BuSn12 NIs across the membrane, this study offers further physical insights into their phase transition phenomena. Accordingly, we discussed the structural properties relative to the number density by developing a Scaling Theory approach. This approach base on the idea that the NIs aggregate is of fractal structure. Such a scaling method consists with the MD simulation for n < nc but diverge for n > nc. We determined the thermodynamic properties through the potential energy per nano-inclusion and the pressure, using MD simulation. Thus, we observe that these major physical quantities present a discontinuity for n = nc and a clear jump for n = ng. We studied the dynamic properties and their dependence on the NIs number density through the temporal evolution of the mean-square-displacement, the velocity auto-correlation-function, and the diffusion coefficients. Precisely, we explore the cage effect and the subdiffusion phenomenon in membrane NIs, using two approaches, which are a Dynamics Theory, based on the generalized Langevin equation, with the Flenner memory function, and MD simulation. We observe that the two dynamics approaches are in good agreement. Thus, the thermodynamics and dynamic properties analysis allow determining nc and ng.
Gelation is a common phenomenon in colloidal science, which has several nanotechnological and medical implications. Thus, the simulation protocol we performed to study spherical membrane NIs, using a solvent-free interaction potential, can be adapted to different shapes and types of NIs, such as nano-rods and nano-discs. The approaches we used to determine the phase transition parameters can be conducted for other colloidal systems, such as microemulsions and metallic nanoparticles. In particular, to reveal drug delivery and cancer treatment.
Conflicts of interest
There are no conflicts to declare.Acknowledgements
The authors are much indebted to Professor M. Benhamou, from Moulay Ismail University, for his theoretical support and his inspiring discussions.Notes and references
- P. Manishankar, et al., J. Exp. Bot., 2018, 69, 4215–4226 CrossRef CAS PubMed.
- T. Nakayama, et al., Science, 2017, 355, 284–286 CrossRef CAS PubMed.
- J. Van Den Berg, A. J. Boersma and B. Poolman, Nat. Rev. Microbiol., 2017, 15(5), 309 CrossRef CAS PubMed.
- R. A. Sauer, K. K. Mandadapu, T. X. Duong, A. Sahu and Y. Omar, Biophys. J., 2017, 112, 309a CrossRef.
- A. C. Alves, D. Ribeiro, C. Nunes and S. Reis, Biochim. Biophys. Acta, Biomembr., 2016, 1858, 2231–2244 CrossRef CAS PubMed.
- W. Yang, Y. Bai, Y. Xiong, J. Zhang, S. Chen, X. Zheng, X. Meng, L. Li, J. Wang, C. Xu and C. Yan, Nature, 2016, 531, 651 CrossRef CAS PubMed.
- M. Neuvonen, M. Manna, S. Mokkila, M. Javanainen, T. Rog, Z. Liu, R. Bittman, I. Vattulainen and E. Ikonen, PLoS One, 2014, 9, 103743 CrossRef PubMed.
- A. O. Elzoghby, A. L. Hemasa and M. S. Freag, J. Controlled Release, 2016, 243, 303–322 CrossRef CAS PubMed.
- A. F. Ismail, M. Padaki, N. Hilal, T. Matsuura and W. J. Lau, Desalination, 2015, 356, 140–148 CrossRef CAS.
- Z. Slavkova, et al., Colloids Surf., A, 2020, 125090 CrossRef CAS.
- W. Li, X. Zhao, B. Du, X. Li, S. Liu, X.-Y. Yang, H. Ding, W. Yang, F. Pan, X. Wu, L. Qin and Y. Pan, Sci. Rep., 2016, 6, 30619 CrossRef CAS PubMed.
- J. H. Cho, A. R. Kim, S. H. Kim, S. J. Lee, H. Chung and M. Y. Yoon, Acta Biomater., 2017, 47, 182 CrossRef CAS PubMed.
- S. S. Lucky, K. C. Soo and Y. Zhang, Nanoparticles in photodynamic therapy, Chem. Rev., 2015, 115, 1990 CrossRef CAS PubMed.
- P. G. Calavia, G. Bruce, L. Perez-Garcia and D. A. Russell, Photochem. Photobiol. Sci., 2018, 17, 1534 CrossRef PubMed.
- D. Constantin, J. Chem. Phys., 2010, 133, 144901 CrossRef PubMed.
- A. Šarić and C. Angelo, Soft Matter, 2013, 9, 6677–6695 RSC.
- C. Montis, et al., J. Colloid Interface Sci., 2020, 570, 340–349 CrossRef CAS PubMed.
- I. Koltover, J. O. Raedler and C. R. Safinya, Phys. Rev. Lett., 1999, 82, 1991–1994 CrossRef CAS.
- T. Yue and X. Zhang, ACS Nano, 2012, 6, 3196–3205 CrossRef CAS PubMed.
- A. Šarić and C. Angelo, Phys. Rev. Lett., 2012, 108, 118101 CrossRef PubMed.
- J. Rouwhorst, et al., Nat. Commun., 2020, 11, 1–8 Search PubMed.
- P. Clifford and J. Brangwynne, Cell Biol., 2013, 203, 875–881 CrossRef PubMed.
- Z. W. Sun, R. L. Qiao, X. Q. Dong and Z. K. Zhou, Adv. Space Res., 1999, 24, 1341–1345 CrossRef CAS.
- V. Trappe, et al., Nature, 2001, 411, 772 CrossRef CAS PubMed.
- K. Lebdioua, et al., J. Colloid Interface Sci., 2021, 583, 222–233 CrossRef CAS PubMed.
- P. J. Lu, et al., Nature, 2008, 499, 453 Search PubMed.
- A. M. Puertas and G. Odriozola, J. Phys. Chem. B, 2007, 111, 5564 CrossRef CAS PubMed.
- T. de Kruif, J. Colloid Interface Sci., 1999, 218, 201 CrossRef PubMed.
- S. A. Shah, Y. L. Chen, K. S. Schweizer and C. F. Zukoski, J. Chem. Phys., 2003, 119, 8747 CrossRef CAS.
- T. B. J. Blijdenstein, et al., Langmuir, 2004, 20, 11321 CrossRef CAS PubMed.
- G. Wang and J. W. Swan, Soft Matter, 2019, 15, 5094 RSC.
- C. Aubert and D. S. Cannell, Phys. Rev. Lett., 1987, 56, 738 CrossRef PubMed.
- P. Meakin, J. Colloid Interface Sci., 1984, 102, 491–504 CrossRef CAS.
- D. A. Weitz, et al., Phys. Rev. Lett., 1985, 54, 1416 CrossRef CAS PubMed.
- T. A. Williams, et al., J. Colloid Interface Sci., 2016, 481, 20–27 CrossRef CAS PubMed.
- N. Hadrioui, et al., RSC Adv., 2020, 10, 8568–8579 RSC.
- D. Constantin, B. Pansu, M. Impéror, P. Davidson and F. Ribot, Phys. Rev. Lett., 2008, 101, 098101 CrossRef PubMed.
- M. Benhamou, H. Kaidi and E. K. Hachem, J. Mol. Liq., 2017, 243, 591–599 CrossRef CAS.
- H. C. Andersen and D. Chandler, J. Chem. Phys., 1970, 53, 547–554 CrossRef CAS.
- T. Bickel, Doctorate thesis, Louis Pasteur Strasbourg I University, 2001.
- T. Bickel, M. Benhamou and H. Kaidi, Phys. Rev. E: Stat., Nonlinear, Soft Matter Phys., 2004, 70, 051404 CrossRef CAS PubMed.
- H. Kaidi, T. Bickel and M. Benhamou, Europhys. Lett., 2005, 69, 15–21 CrossRef CAS.
- V. I. Marchenko and C. Misbah, Eur. Phys. J. E: Soft Matter Biol. Phys., 2002, 8, 477–484 CrossRef CAS PubMed.
- A. R. Evans, M. S. Turner and P. Sens, Phys. Rev. E: Stat., Nonlinear, Soft Matter Phys., 2003, 67, 041907–041917 CrossRef CAS PubMed.
- D. Bartolo and J. B. Fournier, Eur. Phys. J. E: Soft Matter Biol. Phys., 2003, 11, 141–146 CrossRef CAS PubMed.
- R. Everaers and M. R. Ejtehadi, Phys. Rev. E: Stat., Nonlinear, Soft Matter Phys., 2003, 67, 041710 CrossRef CAS PubMed.
- J. N. Israelachvili, Intermolecular and Surface Forces, Academic Press, London, 2nd edn, 1991 Search PubMed.
- C. Eychenne-Baron, et al., Organometallics, 2000, 19, 1940–1949 CrossRef CAS.
- S. Plimpton, et al., Sandia Natl. Lab., 2007, 18, 43 Search PubMed.
- M. P. Allen and D. J. Tildesley, Computer simulation of liquids, Oxford University Press, 2017 Search PubMed.
- W. Shinoda, M. Shiga and M. Mikami, Phys. Rev. B, 2004, 69(13), 134103 CrossRef.
- G. J. Martyna, D. J. Tobias and M. L. Klein, J. Chem. Phys., 1994, 101, 4177–4189 CrossRef CAS.
- M. Parrinello and A. Rahman, J. Appl. Phys., 1981, 52, 7182–7190 CrossRef CAS.
- M. E. Tuckerman, et al., J. Phys. A: Math. Gen., 2006, 39.1, 5629 CrossRef.
- J. Ding, M. Asta and R. O. Ritchie, Proc. Natl. Acad. Sci. U. S. A., 2017, 114, 8458–8463 CrossRef CAS PubMed.
- K. Falconer, Fractal Geometry: Mathematical Foundations and Applications, Wiley, Chichester, UK, 2004 Search PubMed.
- A. Bunde and S. Havlin, Fractals and Disordered Systems, Springer, New York, 2nd edn, 1996 Search PubMed.
- A. Y. Cherny, et al., Phys. Rev. E: Stat., Nonlinear, Soft Matter Phys., 2011, 84, 036203 CrossRef PubMed.
- A. Kumar and J. Wu, Colloids Surf., A, 2004, 247, 145–151 CrossRef CAS.
- S. Lazzari, et al., Adv. Colloid Interface Sci., 2016, 235, 1–13 CrossRef CAS PubMed.
- D. J. Robinson and J. C. Earnshaw, Phys. Rev. Lett., 1993, 71, 715–718 CrossRef CAS PubMed.
- A. Moncho-Jorda, F. Martinez-Lopez, A. E. Gonzalez and H.-R. Alvarez, Langmuir, 2002, 18, 9183–9191 CrossRef CAS.
- P. Meakin, Phys. Rev. A: At., Mol., Opt. Phys., 1983, 27, 1495 CrossRef CAS.
- J. C. Earnshaw, J. Phys.: Condens. Matter, 1995, 7, L397–L403 CrossRef CAS.
- A. Thill and O. Spalla, Colloids Surf., A, 2003, 217, 143–151 CrossRef CAS.
- G. P. Shrivastav, P. Chaudhuri and J. Horbach, Phys. Rev. E, 2016, 94, 042605 CrossRef PubMed.
- A. Ghosh, et al., Phys. Rev. Lett., 2017, 118, 148001 CrossRef PubMed.
- J. Zhang, R. Thakkar, Y. Zhang and M. Maniruzzaman, J. Drug Delivery Sci. Technol., 2021, 61, 102109 CrossRef CAS.
- H. Chabba, M. Lemaalem, A. Derouiche and D. Dafir, J. Mater. Environ. Sci., 2018, 9, 93–99 CAS.
- R. Kubo, M. Toda and N. Hashitsume, Statistical Physics II: Nonequilibrium Statistical Mechanics, Springer Science & Business Media, 2012, vol. 31 Search PubMed.
- R. Kubo, M. Toda and N. Hashitsume, Statistical Physics II: Nonequilibrium Statistical Mechanics, Springer Science and Business Media, 2012, vol. 31 Search PubMed.
- R. Zwanzig, Nonequilibrium Statistical Mechanics, Oxford University Press, 2001 Search PubMed.
- E. Flenner, J. Das, M. C. Rheinstadter and I. Kosztin, Phys. Rev. E: Stat., Nonlinear, Soft Matter Phys., 2009, 79, 011907 CrossRef PubMed.
- J. Hansen and I. McDonald, Theory of Simple Liquids, Elsevier, Amsterdam, 2006 Search PubMed.
- M. Badia, S. El-Moudny, M. Benhamou and M. El Ossmani, J. Mol. Liq., 2017, 240, 1–13 CrossRef CAS.
- M. Lemaalem, R. Ahfir, A. Derouiche and M. Filali, RSC Adv., 2020, 10, 36155–36163 RSC.
- M. Frick, K. Schmidt and B. J. Nichols, Curr. Biol., 2007, 17, 462–467 CrossRef CAS PubMed.
- S. Ramadurai, A. Holt, V. Krasnikov, G. van den Bogaart, J. A. Killian and B. Poolman, J. Am. Chem. Soc., 2009, 131, 12650–12656 CrossRef CAS PubMed.
- D. F. Kusic, E. L. Elson and M. P. Sheetz, Biophys. J., 1999, 76, 314–322 CrossRef.
- T.-C. Lee, et al., Phys. A, 2003, 329, 431–435 CrossRef CAS.
- N. H. Siboni, et al., Phys. Rev. E, 2020, 101, 042609 CrossRef CAS PubMed.
- M. Lemaalem, et al., RSC Adv., 2020, 10, 3745–3755 RSC.
- M. Lemaalem, et al., RSC Adv., 2021, 11, 1503–1516 RSC.
- S. Nangia and R. Sureshkumar, Langmuir, 2012, 28(51), 17666–17671 CrossRef CAS PubMed.
- R. Gupta, et al., Nanoscale, 2020, 12(11), 6318–6333 RSC.
- Y. Li, et al., Nanoscale, 2015, 7(40), 16631–16646 RSC.
- H. M. Ding, et al., ACS Nano, 2012, 6(2), 1230–1238 CrossRef CAS PubMed.
- M. Khatouri, et al., RSC Adv., 2021, 11, 7059–7069 RSC.
| This journal is © The Royal Society of Chemistry 2021 |

