 Open Access Article
Creative Commons Attribution 3.0 Unported Licence
Gradual hydrophobization of silica aerogel for controlled drug release†
Nir Ganonyan a,
Galit Barb,
Raz Gvishib and
David Avnir
 *a
*a
aInstitute of Chemistry, Center for Nanoscience and Nanotechnology, The Hebrew University of Jerusalem, Jerusalem 9190401, Israel. E-mail: david.avnir@mail.huji.ac.il
bApplied Physics Division, Soreq Nuclear Research Center, Yavne 8180000, Israel
First published on 17th February 2021
Abstract
We report on the successful fine-tuning of silica aerogel hydrophobicity, through a gas-phase surface modification process. Aerogel hydrophobicity is a widely discussed matter, as it contributes to the aerogel's preservation and determines its functionality. Still, a general procedure for tuning the hydrophobicity, without affecting other aerogel properties was missing. In the developed procedure, silica aerogel was modified with trimethylchlorosilane vapor for varying durations, resulting in gradual hydrophobicity, determined by solid-state NMR and contact angle measurements. The generality of this post-synthesis treatment allows its application on a variety of aerogel materials, while having minimum effect on their porosity and transparency. We demonstrate the applicability of the gradual hydrophobization by tuning drug release rates from the silica aerogel. Two chlorhexidine salts – widely employed as antiseptic agents – were used as model drugs, one representing a soluble drug, and the other an insoluble drug; they were entrapped in silica aerogel, following hydrophobization to varying degrees. The drug release patterns showed that depending on the degree, hydrophobization can increase or decrease release kinetics, compared to the unmodified aerogel. This arises from the effect of the hydrophobic degree on pore structure, diffusional rates and wetting of the aerogel carrier. We suggest the use of the gradual hydrophobization process for other drug-aerogel systems, as well as for other aerogel applications, such as transparent insulation panels, contaminate sorbents or catalysis supports.
1 Introduction
Aerogels were introduced into our lives almost 90 years ago,1 and still, their extraordinary properties that include high porosity (>95%) and immense surface area (>800 m2 g−1) remain unmatchable.2,3 The aerogels' highly versatile synthesis procedures allow tailoring of the material's properties, such as the bulk density,4 pore size,5 and surface chemistry.6 This flexibility makes aerogels a sought-after material for a great variety of applications, including thermal insulators,7 absorbents,8 oil–water separators,9 fillers,10 electrode materials,11 catalysts,12 tissue-scaffolds,13 stents,14 enzyme supports,15 Cherenkov radiators,16 optical devices17 and cosmic dust collectors.18 Among the many tunable characters, one critical feature is the hydrophobicity of the aerogel surface.2 Aerogels with a hydrophobic surface are less sensitive to atmospheric moisture and can retain their function for longer durations. Also, the surface chemistry is essential for determining the aerogels' absorptive properties, and for regulating diffusion rates through their porous network.15 These features are key for the utilization of aerogels in industrial settings.One major challenge has been the fine tuning of aerogel hydrophobicity to the desired degree. The simplest approach to tune hydrophobicity is during the synthesis of the primary hydrogel; varying ratios of hydrophobic monomers can be used.19,20 However, the final aerogel product is highly affected by such changes, often sacrificing porosity, surface area and transparency. Another common approach is the silylation of the wet gel, prior to drying.21,22 This also alters the final aerogel properties, but more importantly, the reaction kinetics of the silylating agent is limited by the slow diffusion kinetics of that agent into the gel. To the best of our knowledge, the work by Takeshita et al.21 is the only one to demonstrate gradual silylation by this method, while sacrificing transmittance at the same time. Yet another method is the surface modification of the gel in the supercritical phase.23 This enables faster diffusion kinetics and allows gradual hydrophobization by silylation24 or by deposition of hydrophobic polymers.25 Still, this technique requires specialized high-pressure equipment, and the aerogel parameters, mainly pore volume and surface area, are highly affected. Finally, there is the approach of surface modification of the final, dry aerogel. Potentially, gas-phase silylation can enable absolute control over reaction parameters, such as silylation agent pressure, duration and temperature, all while keeping the original aerogel structure intact. It is therefore surprising that only a handful reports on gas-phase silylation of aerogels exist,4,26–29 and none demonstrate the ability to tune the hydrophobic degree gradually.
One field that can benefit from precise hydrophobic tuning of aerogels is drug delivery. Aerogels have drawn attention for their potential in biomedical applications, and particularly for drug delivery.30 Their high porosity and surface area enable high loading of active components. Previous works demonstrate that drug release rates from aerogels can be tweaked by changing the aerogel density,31 by using an environment-sensitive backbone,32 or by altering the surface chemistry,33,34 specifically, the hydrophobicity of the aerogel. Smirnova et al.33 and Giray et al.34 showed that hydrophobic-modified aerogels release loaded drugs slower, because of slower diffusion rates through the aerogel's pores. However, a major setback with regulating release rates by hydrophobicity is the effect on the drug loading. The polar drug active compounds adsorb much less on the hydrophobic surface and get washed away during solvent exchange or supercritical drying stages, leading to low loading. In some cases, loading is cut down by more than 90%.34 Here too, gas-phase silylation has an edge over other silylation methods; dry hydrophilic aerogels can be turned hydrophobic in the gas-phase, after the drug has been loaded to the maximum, without a possibility to leak.
Here, we report the first successful fine-tuning of silica aerogel hydrophobicity by surface modification in the gas-phase. As we describe extensively in the next sections, this was accomplished by regulating the reaction of trimethylchlorosilane (TMCS) vapor with the dry aerogel. Next, we have chosen two chlorhexidine salts which differ in their solubility as model drugs for entrapment in hydrophilic silica aerogel. We then demonstrate the ability to tune the release kinetics of the antiseptics by surface modification of the aerogel carrier to varying degrees. Beyond the immediate application as a drug delivery vessel for medical and environmental disinfection, the developed procedure can be generalized and used to control the release kinetics of other drugs from silica aerogel. Finally, we believe that the gradual hydrophobization procedure that was developed in this work will be highly attractive in many other aerogel fields, such as adsorption for environmental remediation9 and catalysis support,12 where tuning of the surface chemistry is crucial.
2 Methods
2.1 Materials
Tetraethyl orthosilicate 98% (TEOS), trimethylchlorosilane ≥99% (TMCS), chlorhexidine digluconate (CH-G2, 20% solution in water) and chlorhexidine dihydrochloride ≥98% (CH-Cl2) were purchased from Sigma-Aldrich. Ammonium fluoride ≥98% was purchased from Strem Chemicals. Dichloromethane (stab. amylene) ≥99.9% was purchased from Biolab Chemicals. A catalytic base solution was prepared by adding 0.74 g ammonium fluoride and 9.0 mL ammonium hydroxide (28.0–30.0%) to 40 mL deionized water.2.2 Silica aerogel synthesis and silylation (Scheme 1)
![[thin space (1/6-em)]](https://www.rsc.org/images/entities/char_2009.gif) :
:![[thin space (1/6-em)]](https://www.rsc.org/images/entities/char_2009.gif) 3, and 1.15 mL of it was transferred to a glass vial inside the desiccator. The desiccator was immediately sealed and heated to 50 °C (see Fig. S2, ESI,† for an illustration). After the desired modification time, ranging from 20 minutes to 118 hours, the temperature was raised to 70 °C and a vacuum pump was used to evacuate the desiccator from residual TMCS, dichloromethane and HCl that formed during the reaction. After 30 minutes of evacuation, the desiccator was cooled and the surface-modified aerogel was removed. For transmittance measurements, a disc-shaped silica aerogel with a diameter of 1.5 mm and height of 4 mm was also subjected to the surface modification process for a duration of 50 hours, skipping the grinding, and using the same configuration and temperatures.
3, and 1.15 mL of it was transferred to a glass vial inside the desiccator. The desiccator was immediately sealed and heated to 50 °C (see Fig. S2, ESI,† for an illustration). After the desired modification time, ranging from 20 minutes to 118 hours, the temperature was raised to 70 °C and a vacuum pump was used to evacuate the desiccator from residual TMCS, dichloromethane and HCl that formed during the reaction. After 30 minutes of evacuation, the desiccator was cooled and the surface-modified aerogel was removed. For transmittance measurements, a disc-shaped silica aerogel with a diameter of 1.5 mm and height of 4 mm was also subjected to the surface modification process for a duration of 50 hours, skipping the grinding, and using the same configuration and temperatures.2.3 Characterization of the aerogels
The bulk density of the aerogels was determined by the gravimetric method: dividing the mass by the volume of the cylindric aerogels. High resolution scanning electron microscopy (HR-SEM) images were acquired using a FEI Magellan XHR in secondary electron mode and charge neutralization, at landing energy of 2 kV and beam current of 25 pA. The aerogel loaded with chlorhexidine dihydrochloride showed high surface charge and was coated by a 2 nm layer of iridium using a Quorum Q150V Plus Sputter Coater. Energy-dispersive X-ray spectroscopy (EDS) data was recorded by an Oxford XMAX SDD, mounted on the SEM, and operated under INCA Energy 450 platform. The specific surface area, pore volume and pore size distribution were calculated using data acquired from a N2 adsorption–desorption apparatus (Micromeritics, ASAP 2020), at 77 K. Samples were degassed under vacuum at 50 °C for 10 hours before analysis. Pore size distribution was analyzed using the Barrett–Joyner–Halenda (BJH) method. Surface area was calculated using the Brunauer–Emmet–Teller (BET) equation, over acquired adsorption data in the P/P0 range of 0.05 to 0.24. Single-point pore volume was calculated using adsorption data at P/P0 = 0.97. Average pore size was calculated using 4V/S, where V is the single point pore volume and S is the BET surface area. Solid-state NMR spectra were acquired using a 500 MHz Bruker Avance II spectrometer with a 4 mm CP-MAS probe with a spinning rate of 12![[thin space (1/6-em)]](https://www.rsc.org/images/entities/char_2009.gif) 500 Hz. The contact times for cross polarization were 2 ms for 13C and 8 ms for 29Si. Aerogel samples were firmly compressed into a zirconia rotor for the NMR measurements. In the case of 29Si NMR, integration areas of Q species were found by dividing the broad signal around −120 to −90 ppm to three; Q2 area was below 95 ppm, Q4 area above 108 ppm and Q3 in between. For contact angle measurements, a layer of aerogel powder was adhered to a glass slide using double-sided tape. Alternatively, dense disks were made from the aerogel powder by applying 8-ton pressure with a hydraulic press for 5 minutes. A drop of 3 μL deionized water was placed on the aerogel powder or disk and the contact angle was recorded using a Ramé-Hart model 100 contact angle goniometer. Determination of C, H, N content was performed using simultaneous flash combustion method with a Thermo Flash 2000 CHN-O Elemental Analyzer. All spectrophotometric analyses were performed using an Agilent-HP 8453 UV-vis spectroscopy system. Gelation of blank and CH-G2 loaded aerogels was monitored by performing the gelation process in a quartz cuvette and measuring the absorbance at 400, 600 and 800 nm every 2 seconds.
500 Hz. The contact times for cross polarization were 2 ms for 13C and 8 ms for 29Si. Aerogel samples were firmly compressed into a zirconia rotor for the NMR measurements. In the case of 29Si NMR, integration areas of Q species were found by dividing the broad signal around −120 to −90 ppm to three; Q2 area was below 95 ppm, Q4 area above 108 ppm and Q3 in between. For contact angle measurements, a layer of aerogel powder was adhered to a glass slide using double-sided tape. Alternatively, dense disks were made from the aerogel powder by applying 8-ton pressure with a hydraulic press for 5 minutes. A drop of 3 μL deionized water was placed on the aerogel powder or disk and the contact angle was recorded using a Ramé-Hart model 100 contact angle goniometer. Determination of C, H, N content was performed using simultaneous flash combustion method with a Thermo Flash 2000 CHN-O Elemental Analyzer. All spectrophotometric analyses were performed using an Agilent-HP 8453 UV-vis spectroscopy system. Gelation of blank and CH-G2 loaded aerogels was monitored by performing the gelation process in a quartz cuvette and measuring the absorbance at 400, 600 and 800 nm every 2 seconds.
2.4 Release tests of chlorhexidine from silica aerogel
Centrifuge tubes with 40 mL deionized water were preheated to 30 °C. Then, 20 or 10 mg of CH-G2@SiO2 or CH-Cl2@SiO2 (respectively) were added to the tubes and rotated at 30 rpm at 30 °C. Release of chlorhexidine was determined by measuring the absorbance at 253 nm, using a molar extinction coefficient of 29![[thin space (1/6-em)]](https://www.rsc.org/images/entities/char_2009.gif) 400 cm−1 M−1.36 A three-point drop-line correction, with reference wavelengths at 380 and 400 nm, was used to eliminate the background absorbance. Each drug release curve was normalized by dividing the amount of released chlorhexidine by the maximum released amount, to eliminate inhomogeneity between samples (the normalization is discussed in Section 12 of the ESI†).
400 cm−1 M−1.36 A three-point drop-line correction, with reference wavelengths at 380 and 400 nm, was used to eliminate the background absorbance. Each drug release curve was normalized by dividing the amount of released chlorhexidine by the maximum released amount, to eliminate inhomogeneity between samples (the normalization is discussed in Section 12 of the ESI†).
3 Results and discussion
3.1 Hydrophobization process overview and NMR data
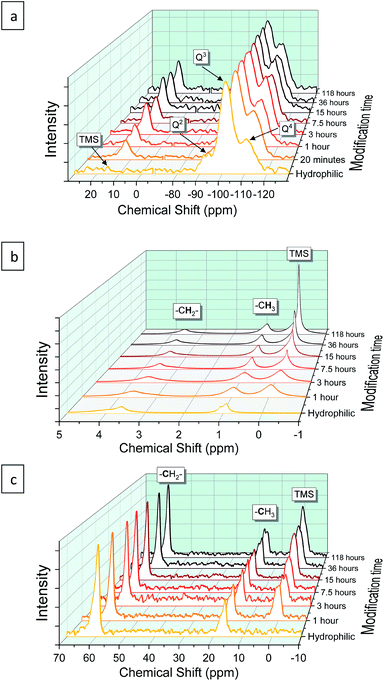
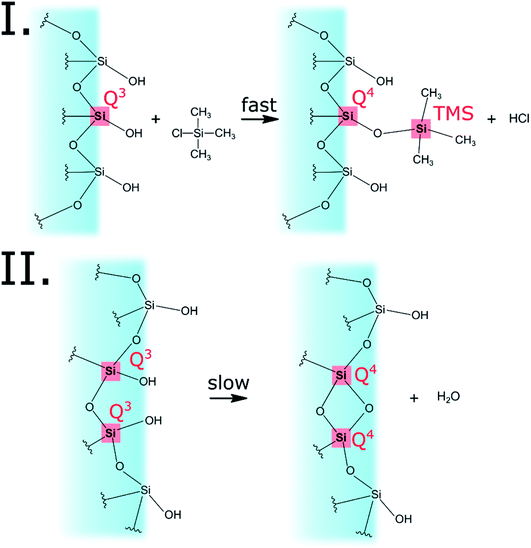
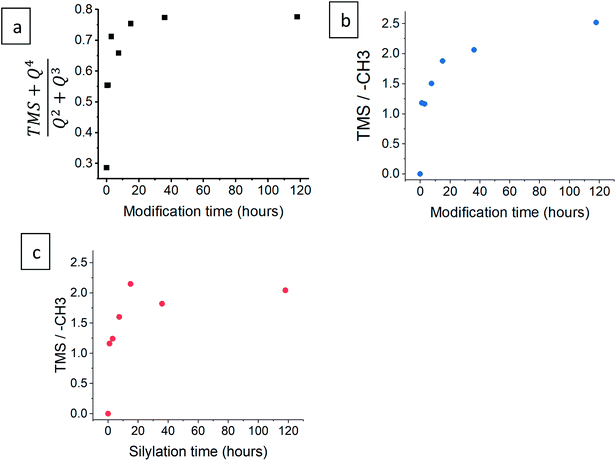
Using a basic set-up, we have successfully modified the surface of silica aerogel to varying degrees of hydrophobicity, with a minimal impact on the aerogel structure. Grounded hydrophilic silica aerogel, with a bulk density of 110 ± 10 mg mL−1, was sealed in a glass desiccator with a vial of TMCS/dichloromethane solution (for easier handling of the TMCS). The surface modification was conducted at 50 °C for varying durations, from 20 minutes to 118 hours, and terminated by evacuation of the TMCS vapor. An excess of TMCS was used, equivalent to ×12.5 surface coverage, calculated using the maximum chemisorption density of TMCS (0.76 nm−1)37 and the aerogel's measured surface area (see Section 3.3 below). This simple set-up has proven efficient in modifying the aerogel surface, rendering it hydrophobic to the desired extent.The progress of the surface modification was evaluated using solid-state NMR. Cross polarization magic angle spinning (CP-MAS) measurements of 1H–29Si nuclei resulted in spectra with the following bands: trimethyl silyl at 12 ppm (TMS), Si coordinated with two bridging oxygens (BO) and two nonbridging oxygens (NBO) at −93 ppm (Q2), Si coordinated with three BOs and one NBO at −103 ppm (Q3) and Si coordinated with four BOs at −112 ppm (Q4).38 Fig. 1a presents the acquired 29Si spectra of the hydrophilic and surface-modified silica aerogels and a clear rise of TMS and Q4 peaks is seen with modification time (see also Fig. S3a, ESI,† for full spectra). The TMS to Q3 ratio (Fig. S3b†) increases during the first 15 hours of modification, indicating that the TMCS reacts with the surface silanol groups during this time. However, the Q4 to Q3 ratio continues to increase throughout the 118 hours of modification (Fig. S3c†). This suggests that the silica aerogel undergoes two distinct reaction steps during surface modification (Fig. 2). The first reaction is the silylation itself, introducing hydrophobic TMS groups on the aerogel surface. This accounts for part of the increase in Q4 content, as the NBO of Q3 reacts with TMCS and turns into a BO. The second reaction is the slower condensation of neighboring NBOs to form siloxane bridges, namely, aging of the dry aerogel. This accounts for the further increase in Q4 content. As both reactions act to diminish the surface silanol groups, both contribute to the hydrophobization of the aerogel. The gradual hydrophobization from both reactions is well visualized in Fig. 3a, where the NMR integration ratio of non-hydrophilic (TMS and Q4) to hydrophilic (Q3 and Q2) bands is presented and shows an increase during the surface modification. Because the CP-MAS method is semi-quantitative, exact molar ratios cannot be determined from the spectra.
NMR spectra of 1H and 13C were also used to evaluate the surface modification process. In the 1H NMR spectra (Fig. 1b), the band of TMS (at −0.1 ppm) clearly rises with modification time, compared to –CH3 (at 0.9 ppm) and –CH2– (at 3.6 ppm) bands. The two latter bands arise from surface ethoxy groups and probably also from physisorbed ethanol. The same trend is seen in the 1H–13C cross polarization spectra (Fig. 1c), where the TMS band (at 0 ppm) rises in comparison to –CH3 (at 16 ppm) and –CH2– (at 59 ppm) bands. In both 1H and 13C spectra, the ratio of TMS to –CH3 continues to increase, even after 118 hours of the modification time (Fig. 3b and c). This coincides with 29Si NMR data; the TMS band increases as a result of the silylation itself, while the ethoxy/ethanol bands decrease because of the silylation, condensation of neighbor NBOs and desorption of ethanol from the aerogel surface.
3.2 Contact angle measurements
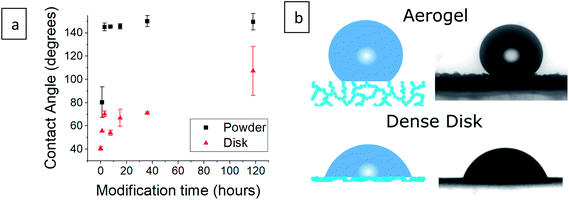
The contact angle of a water droplet is one of the key values in reports of hydrophobic aerogels.9,21,39 Our silylated aerogel powders (Fig. 4a and S4, ESI†), show that the contact angle reaches 145° already after 3 hours of silylation. Afterwards, the contact angle stays almost constant, reaching a maximum of 150°. However, the contact angle is heavily affected by surface roughness and in the case of porous aerogels, the water droplet has very little contact with the actual surface (Fig. 4b). Consequently, the contact angle on porous aerogels represents mixed effects and not only the hydrophobicity of the aerogel surface. Furthermore, a water droplet may not be able to penetrate the aerogel outer surface, but still, water vapor can diffuse into the aerogel and condense in pores, leading to increase in density and possibly damage the pore structure.4 Therefore, an additional test was carried out in which aerogel powders were pressed into dense disks and contact angles were measured (Fig. 4a and S5, ESI†). This revealed that the surface was gradually increasing its hydrophobic character as the surface modification progressed, as the contact angle increased from 41° for the hydrophilic aerogel to 107° after 118 hours of modification.3.3 Pore distribution and surface area
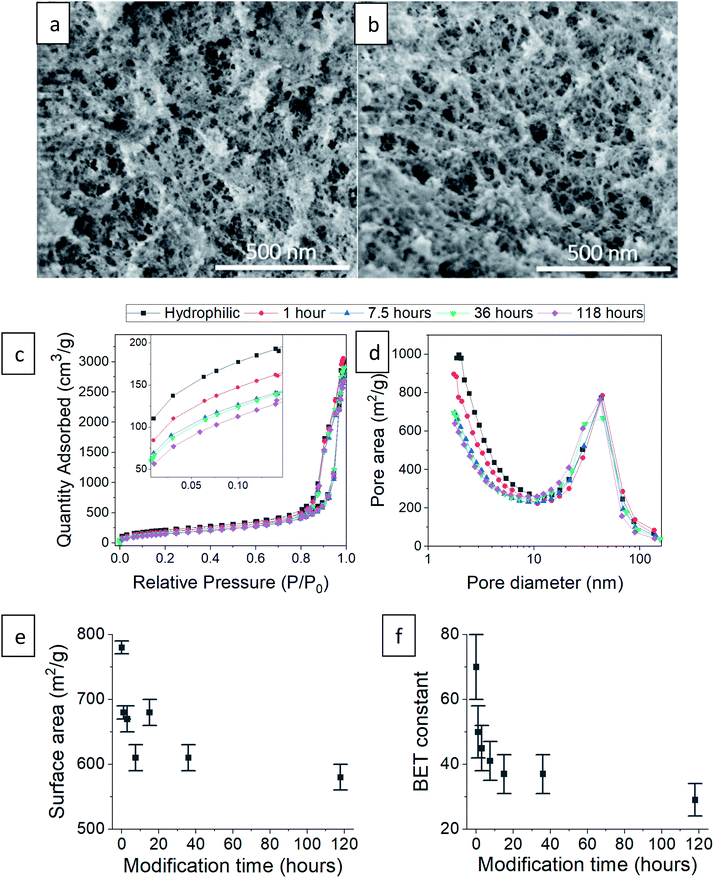
Next, we checked how the surface modification affects the internal, porous structure of the silica aerogel. When comparing SEM images of hydrophilic and 36 hour surface-modified aerogels, there appears to be no significant change in pore structure (Fig. 5a and b). The N2 adsorption–desorption isotherms of the hydrophilic and silylated aerogels are almost identical (Fig. 5c shows representative examples, see Fig. S6–S8, ESI,† for all isotherms and data calculated from it). All fit the IUPAC Type IV isotherm classification,40 suggesting an abundance of mesopores (5 to 50 nm). The isotherms do differ slightly but significantly in the low relative pressure range (P/P0). Enlargement of this range (Fig. 5c inset) reveals that the longer the surface modification, the less the aerogels adsorb at low pressures. Adsorption in this range reflects the condensation of N2 in micropores (up to 5 nm), and indeed, the pore size distribution shows that the longer the modification, the smaller the micropore population (Fig. 5d). This trend also affects the average pore size: fewer micropores result in a larger average pore size (Table 1). The pore volume is less influenced by the micropores and stays relatively unchanged upon surface modification (Table 1). We suggest two reasons for the decline in the micropore population during the hydrophobization process. The first is addition of TMS groups on the pore surface, reducing its volume and possibly blocking access to it. The second is condensation of silanol groups near the pore opening, also leading to the blockage of the N2 adsorbate.| Surface modification time | Average pore size (nm) | Pore volume (cm3 g−1) | Surface area (m2 g−1) | BET constant (AU) |
|---|---|---|---|---|
| Hydrophilic | 18.0 ± 0.3 | 3.52 ± 0.03 | 780 ± 10 | 70 ± 10 |
| 1 hour | 19.9 ± 0.4 | 3.40 ± 0.03 | 680 ± 10 | 50 ± 8 |
| 3 hours | 20.7 ± 0.5 | 3.48 ± 0.03 | 670 ± 20 | 45 ± 7 |
| 7.5 hours | 22.5 ± 0.6 | 3.42 ± 0.03 | 610 ± 20 | 41 ± 6 |
| 15 hours | 20.9 ± 0.6 | 3.56 ± 0.03 | 680 ± 20 | 37 ± 6 |
| 36 hours | 23.8 ± 0.7 | 3.63 ± 0.03 | 610 ± 20 | 37 ± 6 |
| 118 hours | 23.7 ± 0.9 | 3.44 ± 0.03 | 580 ± 20 | 29 ± 5 |
The N2 adsorption data showed high compliance with the BET theory (see linear fittings to the BET equation in Fig. S8, ESI†). The hydrophobization process caused a reduction in the BET surface area (Fig. 5e), which is also attributed to the decrease in the micropore population. An additional important parameter for this study is the BET constant. We recall that this parameter is an indication of the adsorption energy of nitrogen molecules to the adsorbent surface. The BET constant dramatically drops at short modification times and continues to decrease, even till the 118 hour modification time (Fig. 5f). This parameter gives the best insight on the change of surface energy, even more than the contact angle measurements, because the surface roughness does not interfere with nitrogen adsorption and surface sites are sampled equally.
3.4 Optical transmittance
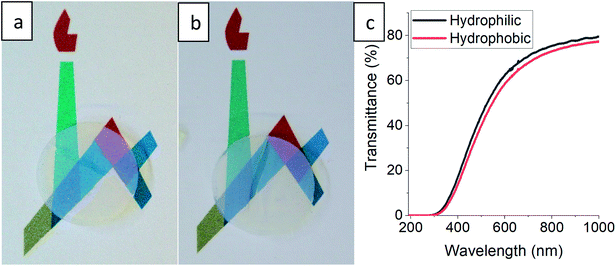
The gradual hydrophobization process presented here is very general, as TMCS is a very reactive silylating agent,26 and may suit all types of aerogel materials with –OH surface groups.21,41 We chose for our proof-of-concept a very basic reaction set-up, but the kinetics of the process can be adjusted for other aerogel materials by altering the TMCS pressure and temperature,42 or the number of modification cycles.43 Controlling the surface hydrophobization level may be beneficial for many aerogel applications, such as catalyst carriers12 and anode materials,44 where there is a need of moderating the diffusion kinetics, or as contaminant sorbents,9 for moderating surface affinity. Also, this hydrophobization process can be very useful when optical performance of the aerogel needs to be preserved.17 One suggested use for silica aerogels is insulating window panels,45 but hydrophobicity and transparency of monolithic aerogels are usually conflicting.21 We tested a monolithic silica aerogel after 50 hours of surface modification and no change in transparency was evident to the naked eye (Fig. 6a and b), while it obtained a strong hydrophobic character (Fig. S9, ESI†), with a minor loss of less than 5% transmittance in the visible range (Fig. 6c). Preservation of transmittance, along with other of the aerogel's properties, is possible through this process because of the minimal effect on the porous structure, as was demonstrated in Section 3.3.3.5 Entrapment of chlorhexidine in silica aerogel
One field that can particularly benefit from gradual hydrophobization of aerogels is drug delivery. As there are a few works that demonstrate the prolonged release of drugs from hydrophobic aerogels,33,34 we decided to check if we can tune the release rate by adjusting the hydrophobic degree. We have chosen two chlorhexidine (CH) salts – widely employed as antiseptic agents in hospitals and in OTC products46 – which differ in their solubilities, one highly soluble and the other of low solubility, as model drugs for entrapment in hydrophilic silica aerogel. To the best of our knowledge, entrapment and release of CH, or any other antiseptic drug, from ceramic aerogels has not been reported. Therefore, in addition to the role of CH as a model drug for the release kinetic tests, a new drug-aerogel release system is presented.Chlorhexidine salts were entrapped in the silica aerogel by incorporating the chlorhexidine directly in the gelation mixture (Scheme 1). CH has a few common salts, differing significantly in their solubility.47 The salt with the highest solubility, chlorhexidine digluconate (CH-G2), was added along with the initial sol–gel precursors, to obtain the highest possible concentration of CH in the hydrogel stage. The following solvent exchange step was performed with a limited amount of ethanol, to minimize the CH-G2 loss due to leaking, followed by supercritical drying with CO2.
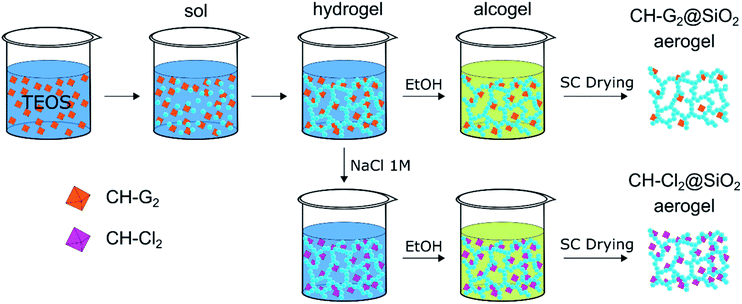 | ||
| Scheme 1 Entrapment procedure of two chlorhexidine salts in silica aerogel: the soluble digluconate (CH-G2) and low-solubility dihydrochloride (CH-Cl2). The CH-G2 salt is dissolved in the initial sol–gel mixture. Gelation, solvent exchange and supercritical drying lead to the doped aerogel (CH-G2@SiO2). An anion exchange of the gluconate with chloride is induced at the hydrogel stage with NaCl, leading after solvent exchange and supercritical drying to the second doped aerogel (CH-Cl2@SiO2). Hydrophobization of the aerogel to various degrees, is carried out after entrapment (see Fig. S2, ESI† for an illustration). | ||
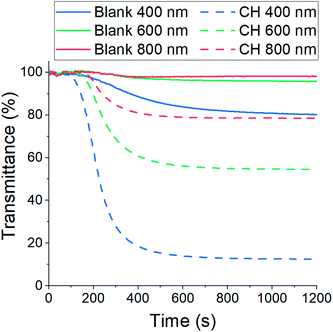
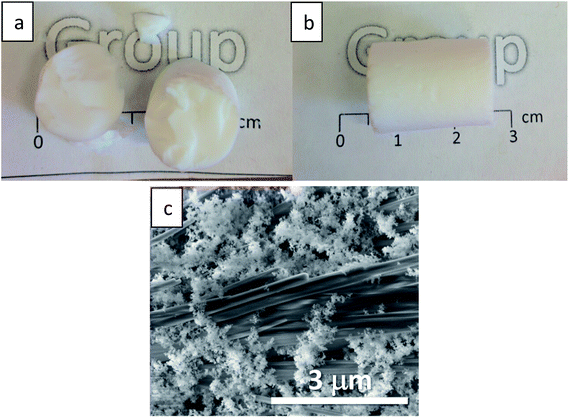
The resulting CH-doped hydrogel was opaque, suggesting that the addition of CH-G2 affects the gel structure. Also, the gelation time was shortened from an average of 10 ± 1 minutes for the blank silica to 6 ± 1 minutes with the CH-G2. This was verified by transmittance measurements of the sol–gel solutions upon gelation (Fig. 7). The gelation mixture with CH-G2 showed much lower transmittance compared with the blank silica, but more importantly, shorter wavelengths showed much higher scattering. The strong dependence on the wavelength indicates that the rise in opaqueness is mainly due to the Rayleigh scattering component, resulting from interaction with refractive coefficient boundaries of regimes considerably smaller than the wavelength.48 The higher scattering of the doped gel means that the CH-G2 causes formation of larger silica elementary particles, as larger particle diameters lead to stronger Rayleigh scattering (following a power rule of d6). This may be the reason that these gels showed no visible shrinking during supercritical drying, with a final bulk density of 57 ± 2 mg mL−1 for the doped aerogel, denoted CH-G2@SiO2 (Fig. 8a). Also, the shift in transmittance in the doped gel occurred earlier than in the blank gel, assisting the determination of its faster gelation, as proposed in the elegant work by Calcabrini and Onna.48
To increase the loading of chlorhexidine, another entrapment method was used that included an anion exchange during the hydrogel stage. The CH-G2 doped hydrogels were transferred to an NaCl bath and the gluconate anion was exchanged with the chloride, resulting in precipitation of the less soluble chlorhexidine dihydrochloride (CH-Cl2). After the following solvent exchange and supercritical drying steps, the dihydrochloride salt-entrapped aerogel was formed, denoted CH-Cl2@SiO2 (Fig. 8b), with a final bulk density of 66 ± 5 mg mL−1. Elemental analysis of CHN by flash combustion was used to assess the amount of entrapped chlorhexidine in the dry aerogels. As C and H content can arise from ethanol and ethoxysilyl groups, and were evident also in the blank aerogel, chlorhexidine weight was calculated from the N content. Two separate batches of CH-G2@SiO2 aerogels were calculated to have an average loading of 3 ± 1% by weight (0.03 ± 0.01 mmol per gram) and the CH-Cl2@SiO2 aerogel a loading of 6 ± 1% by weight (0.06 ± 0.01 mmol per gram). Using the initial quantities of CH in the synthesis procedure, we calculated the theoretical maximum loading of CH to be 0.23 mmol per gram. This validates that the anion exchange helps minimize loss of CH due to leaking (see more in Section 12 of the ESI†).
SEM was used to evaluate the homogeneity of the doped aerogels. Both CH-G2@SiO2 and CH-Cl2@SiO2 aerogels showed high resemblance to the blank silica aerogel, with a porous and homogenous texture (Fig. S10, ESI†). However, in the case of CH-Cl2@SiO2, large salt crystals have been observed, widely scattered throughout the aerogel particles (Fig. 8c). The composition of the salt crystals was validated by EDS elemental analysis (Fig. S11, ESI†). We assume that the salt crystals originate from the faces of the monolithic hydrogel that were exposed to the NaCl bath, forming elongated crystal structures in the diffusional interface of Cl− anions from the bath and CH cations from the gel pores.
3.6 Surface modification of chlorhexidine-doped silica aerogels
The CH-G2@SiO2 and CH-Cl2@SiO2 aerogels were submitted to the surface modification process, for durations varying from 20 minutes to 118 hours. Then, the CH loaded hydrophilic and surface-modified aerogels were characterized, to ensure that the hydrophobization succeeded in the same manner as the blank silica aerogel. Solid state 29Si NMR of aerogels of both salt-loaded aerogels showed the same trend as the blank aerogels, with an increase of the TMS and Q4 bands with modification time, confirming that the aerogels' surface was getting more hydrophobic (Fig. S12 and S13, ESI†). As observed for the blank silica, here too there was a gradual increase of the non-hydrophilic (TMS and Q4) to hydrophilic (Q2 and Q3) bands ratio throughout the surface modification process. However, the increase in the TMS band in the case of the CH-Cl2@SiO2 aerogel was slower, probably because the silica surface was less accessible to the silylation reaction, owing to the precipitation of CH-Cl2 crystals in the pores. The porosity of the doped aerogels upon hydrophobization was also characterized. SEM revealed no apparent change in the external texture of the hydrophobic aerogels (Fig. S10, ESI†). The N2 adsorption–desorption isotherms of the hydrophilic doped aerogels differ slightly from the blank silica aerogel and resemble Type II isotherms,40 suggesting a smaller population of mesopores (Fig. 9, S14 and S15, ESI†). Still, all the trends that were observed in the hydrophobization of the blank silica aerogel were observed in the doped aerogels. The surface-modified aerogels showed isotherms and pore size distributions similar to those of the hydrophilic aerogels, with a slight reduction in the micropore population upon silylation, as well as a reduction in the BET surface area (Fig. S17, ESI†). Importantly, the BET constant of the doped aerogels showed a decrease with silylation time, indicating the reduction in surface energy and successful hydrophobization (Fig. S18, ESI†). Finally, we verified that the entrapped chlorhexidine was not affected by the entrapment or hydrophobization processes, by comparing the UV-vis absorption spectrum of the stock solution to the spectrum after the release from the hydrophobized aerogel (Fig. S19, ESI†).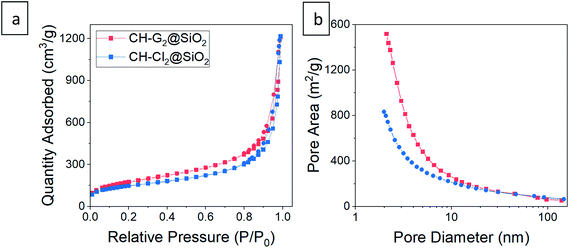 | ||
| Fig. 9 (a) N2 adsorption–desorption isotherms and (b) pore size distributions from adsorption data of CH-G2@SiO2 and CH-Cl2@SiO2 aerogels. The isotherms fit Type II, indicative of macroporous materials, with a small hysteresis loop suggesting some mesopores. Abundance of micropores appear in the pore distribution of both aerogels. Smaller pores are biased in the distribution by pore area, while the larger pores can be seen in SEM, or in the pore size distribution by volume – Fig. S10 and S16, ESI.† | ||
3.7 Controlled release of chlorhexidine salts from silica aerogels
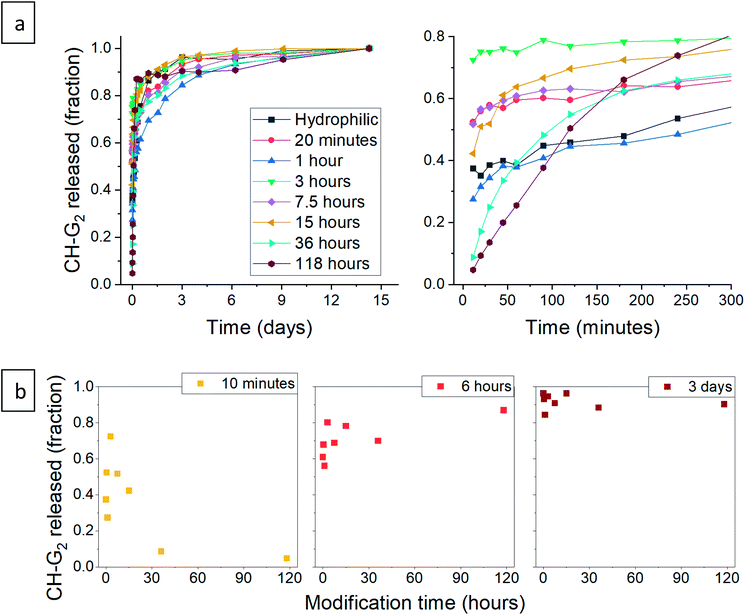
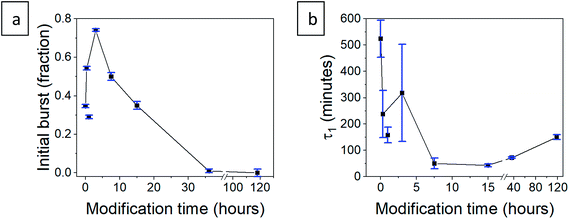
After validating that the surface modification of the doped aerogels succeeded, we turned to investigate how the hydrophobization and its changing level affect the drug release pattern. All CH-G2@SiO2 aerogels showed a prolong release, continuing to release chlorhexidine even after the 14 days tested (Fig. 10a). The total amount of released CH-G2 matched the measured loading value from CHN elemental analysis (Fig. S20, ESI†). We detected three distinct release phases for the CH-G2, visible in the graphic representation of the early release period (Fig. 10a, right graph). The first release phase is an initial burst, followed by a rapid-release phase, and finally, a slow-release phase for the remainder of the tested time. Drug release in multiple phases was reported for other silica sol–gel drug carriers49–51 and is a result of the wide distribution of pore sizes, from small micropores, less than 5 nm, to macropores, larger than 50 nm. The initial burst and rapid-release phases are strongly affected by the surface modification. Samples with short modification times (20 minutes to 15 hours) showed an increase in the initial burst, compared to the hydrophilic aerogel (Fig. 10a and b). This was surprising, as previous works only reported of a slower release for hydrophobic aerogels.31,33,34 In contrast, the samples with long modification times (36 and 118 hours) exhibit a negligible initial burst. We explain these findings by the dual nature of the hydrophobization; on one hand, a hydrophobic pore is less likely to collapse in an aqueous solution, because of the reduced capillary pressure, and on the other hand, the wetting of a hydrophobic aerogel particle is more difficult. The former phenomenon explains the increased burst in samples with short modification times, as their modification is not enough to hinder the wetting of the particles, yet the pores remain open upon contact with water and enable fast discharge of a larger burst fraction. However, the longer the modification, the slower the wetting, and the burst is therefore obstructed for highly hydrophobic aerogels. The delayed wetting of the aerogel powders was indeed visible during the experiment. The rapid release phase is the fastest for the hydrophobic aerogels, with the 118 hour modified sample quickly surpassing the release from other aerogels (Fig. 10a and b). This is also explained by the hydrophobization of the pore surface: chlorhexidine tends to adsorb strongly on hydrophilic surfaces52 and the introduced TMS groups suppress its interaction with the silanol groups, allowing faster diffusion and release from the pores. Finally, the extended, slow-release phase is attributed to the diffusion of chlorhexidine from small pores, which is less affected by the surface modification. During this phase, no significant difference between samples was observed, all reaching around 90% release after 3 days (Fig. 10b). We note that the 1 hour surface modification sample does not fit the observed trend.To validate our suggested trends for the release patterns of CH-G2@SiO2 aerogels, we searched for a mathematical model that will fit the experimental data. As explained above, the release patterns of the CH-G2@SiO2 aerogels consist of an initial burst phase, followed by a rapid-release phase and finally an extended, slow-release phase. We found that the most suitable model is a two-term first-order release, as the first-order model fits the release pattern of soluble drugs from porous matrixes.53 In the fitted equation,
| Modification time | b (mass fraction) | a1 (mass fraction) | τ1 (minutes) | a2 (mass fraction) | τ2 (minutes) | R2 |
|---|---|---|---|---|---|---|
| 0 (hydrophilic) | 0.347 ± 0.008 | 0.52 ± 0.06 | 520 ± 60 | 0.12 ± 0.05 | 4000 ± 3000 | 0.996 |
| 20 minutes | 0.543 ± 0.009 | 0.13 ± 0.03 | 240 ± 90 | 0.31 ± 0.03 | 2500 ± 400 | 0.993 |
| 1 hour | 0.29 ± 0.01 | 0.24 ± 0.02 | 160 ± 30 | 0.44 ± 0.02 | 3400 ± 500 | 0.994 |
| 3 hours | 0.741 ± 0.007 | 0.08 ± 0.03 | 300 ± 200 | 0.17 ± 0.03 | 3000 ± 1000 | 0.982 |
| 7.5 hours | 0.50 ± 0.02 | 0.13 ± 0.02 | 50 ± 20 | 0.33 ± 0.01 | 2400 ± 300 | 0.987 |
| 15 hours | 0.35 ± 0.02 | 0.36 ± 0.02 | 43 ± 6 | 0.28 ± 0.01 | 1500 ± 200 | 0.992 |
| 36 hours | 0.01 ± 0.01 | 0.67 ± 0.01 | 72 ± 3 | 0.29 ± 0.01 | 3500 ± 400 | 0.999 |
| 118 hours | 0.00 ± 0.02 | 0.91 ± 0.02 | 150 ± 9 | NA | NA | 0.993 |
A second mathematical model we tested is the Higuchi model, that has been used in drug release from silica aerogels54 and xerogels.50 The experimental data showed lower compliance with this model, but still, the two domains, each complying with the Higuchi model, were identified. The derived kinetic parameters supported the proposed trends upon hydrophobization. See ESI, Section 14† for details.
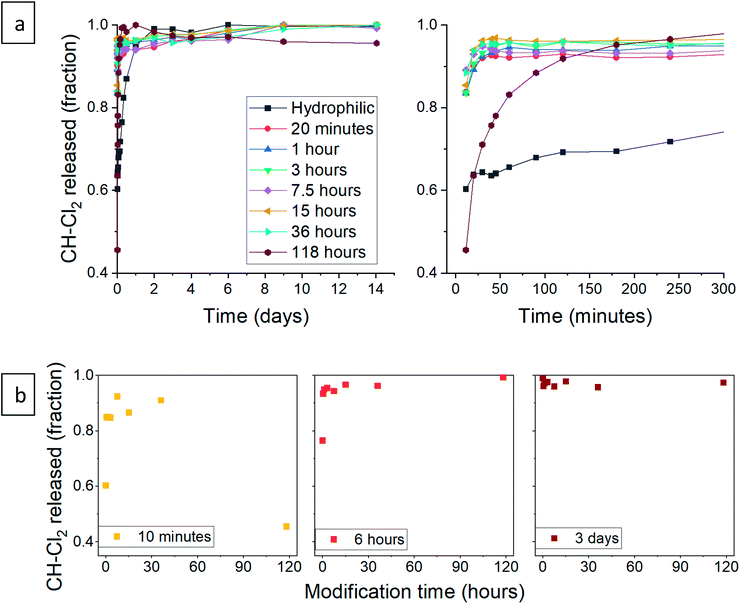
Next, we turned to test the release of CH-Cl2. Unexpectedly, the release pattern was much faster than the digluconate salt, with all samples reaching 90% release after one day (Fig. 12a). The total amount of released CH-Cl2 reached 7.9% by weight, even more than the estimated loading value from CHN elemental analysis (Fig. S21, ESI†). Here too, we identify the same three release phases. We recall that during the anion exchange, some CH-Cl2 crystals precipitated outside the confined pores (Fig. 8c, above). Therefore, it is not surprising that the initial burst phase of the hydrophilic aerogel reaches 60%, as the exposed CH-Cl2 salt dissolves immediately in the aqueous medium. The early release pattern (Fig. 12a, right graph and Fig. 12b) reveals that the initial burst of all aerogels with surface modification up to 36 hours was even greater, reaching more than 90%. After a long surface modification of 118 hours, a decrease in the initial burst is observed, as the surface modification finally succeeds to delay the wetting of the aerogel. In the rapid-release phase, the surface-modified aerogels almost complete their release within the first hour. The 118 hour modified aerogel exhibited the fastest release in this phase, exceeding the release of all other samples, even with its reduced initial burst (Fig. 12b). The hydrophilic aerogel exhibited a slower release, explained by the obstructed diffusion out of the collapsed pores. Fast discharge during the rapid-release phase, compared to CH-G2@SiO2 aerogels, suggests that the CH-Cl2 that precipitated inside the pore cavities is loosely held and can diffuse outside faster than the strongly adsorbed CH-G2 salt. This suggests that the drug-aerogel interaction strength is critical in the determination of the release rate, more than the solubility strength, as the less soluble dihydrochloride salt is released faster. The final, slow release phase continues up to the 14 days tested, as a small amount of CH continues to diffuse out of the micropores. The curve of the 118 hour modified sample shows that it reaches 100% after 1 day, but this is an artifact, as some of the measurements were interfered by suspended aerogel particles.
The experimental release data of CH-Cl2, did not fit the first-order model. We found that the more suitable drug release model is Higuchi, as it describes the release of an insoluble drug through a porous matrix,53 and CH-Cl2 is indeed sparsely soluble in water. In the fitted equation,
| Modification time | KH,1 (hour−1/2) | R2 | KH,2 (hour−1/2) | R2 |
|---|---|---|---|---|
| 0 (hydrophilic) | 0.079 ± 0.003 | 0.98 | 0.0003 ± 0.0001 | 0.41 |
| 20 minutes | 0.23 ± 0.07 | 0.78 | 0.0054 ± 0.0003 | 0.97 |
| 1 hour | 0.19 ± 0.04 | 0.84 | 0.0038 ± 0.0003 | 0.93 |
| 3 hours | 0.20 ± 0.04 | 0.81 | 0.0033 ± 0.0003 | 0.93 |
| 7.5 hours | 0.22 ± 0.04 | 0.54 | 0.0037 ± 0.0003 | 0.91 |
| 15 hours | 0.25 ± 0.07 | 0.74 | 0.0025 ± 0.0002 | 0.90 |
| 36 hours | 0.26 ± 0.07 | 0.72 | 0.0023 ± 0.0003 | 0.79 |
| 118 hours | 0.43 ± 0.07 | 0.85 | — | — |
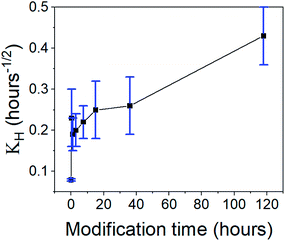 | ||
| Fig. 13 The Higuchi constant of the rapid-release phase of CH-Cl2 from aerogels, varying in the surface modification duration. An increase in the release rate is observed with modification time. | ||
4 Conclusions and outlook
Hydrophobization of aerogels has been the subject of many studies2 because of its importance in preservation of the aerogel21 and of the various functionalities that can be derived from this process.9 Still, a simple method for hydrophobization of aerogels, that does not impact other properties, was needed. In this report, we describe a general method to tune the hydrophobicity of aerogels by gas-phase surface modification. Hydrophobic degree is controlled easily by the modification process time. Porosity and transparency of the aerogel are barely affected, with only a small decrease in micropore population. This allows to take any known procedure for hydrophilic aerogel, with the desired porosity and density, and apply the surface modification as a final treatment, rendering the aerogel hydrophobic to the desired degree. We believe that this procedure will be advantageous for aerogels used as transparent thermal insulators,45 optic devices,17 absorbents,9 catalyst carriers12 and more.10,13,16 In the second part of this report, we demonstrate the use of the developed hydrophobization process for controlling the release kinetics of a model drug from silica aerogel. We showed that the surface modification prevents the collapsing of the aerogel pores and affects the diffusional rates of the released drug. These two parameters allowed to accelerate or hinder the release of chlorhexidine from the aerogel, depending on the hydrophobization degree. The drug-aerogel interaction played a large role in the determination of release kinetics, with the strongly adsorbed CH-G2 salt releasing slower than the less soluble CH-Cl2 salt. Because the presented entrapment and modification processes are general, this strategy is fit for other drug-aerogel carrier systems and may be used for instance to increase release rates of insoluble drugs,55 or contrarily, achieve slow release of drugs for prolonged treatment. The chlorhexidine loaded aerogel itself can be used as a slow-releasing antiseptic, with a preliminary test confirming its potency in the elimination of E. coli (Fig. S25, ESI†).Funding
This work was supported by the PAZY Excellence in Science Foundation [grant number 5100010098].Conflicts of interest
There are no conflicts to declare.References
- S. S. Kistler, Nature, 1931, 127, 741 CrossRef CAS.
- I. Smirnova and P. Gurikov, Annu. Rev. Chem. Biomol. Eng., 2017, 8, 307–334 CrossRef.
- I. Smirnova and P. Gurikov, J. Supercrit. Fluids, 2018, 134, 228–233 CrossRef CAS.
- K. H. Lee, S. Y. Kim and K. P. Yoo, J. Non-Cryst. Solids, 1995, 186, 18–22 CrossRef CAS.
- K. Hee Kim, S. Park, S. Hwang and M.-D. Cho, Controlled Nanoporosity of Organic Aerogels by Dispersing Clay Platelets, 2011 Search PubMed.
- Z. Li, S. Zhao, M. M. Koebel and W. J. Malfait, Mater. Des., 2020, 193, 108833 CrossRef CAS.
- N. Guerrero-Alburquerque, S. Zhao, N. Adilien, M. M. Koebel, M. Lattuada and W. J. Malfait, ACS Appl. Mater. Interfaces, 2020, 12, 22037–22049 CrossRef CAS.
- Y. Fu, G. Wang, T. Mei, J. Li, J. Wang and X. Wang, ACS Sustainable Chem. Eng., 2017, 5, 4665–4671 CrossRef CAS.
- X. Guo, J. Shan, Z. Lai, W. Lei, R. Ding, Y. Zhang and H. Yang, Molecules, 2018, 23, 945 CrossRef.
- S. Arditty and F. Auguste, Cosmetics or similar toilet preparations (A61K8/0279), LOreal SA, OREAL OP - FR1255884A20120621, 2015 Search PubMed.
- R. Wang, C. Xu, J. Sun and L. Gao, Sci. Rep., 2014, 4, 1–7 CAS.
- M. A. Worsley, S. J. Shin, M. D. Merrill, J. Lenhardt, A. J. Nelson, L. Y. Woo, A. E. Gash, T. F. Baumann and C. A. Orme, ACS Nano, 2015, 9, 4698–4705 CrossRef CAS.
- S. Quraishi, M. Martins, A. A. Barros, P. Gurikov, S. P. Raman, I. Smirnova, A. R. C. Duarte and R. L. Reis, J. Supercrit. Fluids, 2015, 105, 1–8 CrossRef CAS.
- A. A. Barros, A. Rita, A. R. C. Duarte, R. A. Pires, B. Sampaio-Marques, P. Ludovico, E. Lima, J. F. Mano and R. L. Reis, J. Biomed. Mater. Res., Part B, 2015, 103, 608–617 CrossRef.
- N. Ganonyan, N. Benmelech, G. Bar, R. Gvishi and D. Avnir, Mater. Today, 2020, 33, 24–35 CrossRef CAS.
- M. Tabata, I. Adachi, Y. Hatakeyama, H. Kawai, T. Morita and T. Sumiyoshi, J. Supercrit. Fluids, 2016, 110, 183–192 CrossRef CAS.
- A. Sedova, B. Višić, V. Vega-Mayoral, D. Vella, C. Gadermaier, H. Dodiuk, S. Kenig, R. Tenne, R. Gvishi and G. Bar, J. Mater. Sci., 2020, 55, 7612–7623 CrossRef CAS.
- M. J. Burchell, S. A. J. Fairey, P. Wozniakiewicz, D. E. Brownlee, F. Hörz, A. T. Kearsley, T. H. See, P. Tsou, A. Westphal, S. F. Green, J. M. Trigo-Rodríguez and G. Domingúez, Meteorit. Planet. Sci., 2008, 43, 23–40 CrossRef CAS.
- G. Zu, K. Kanamori, X. Wang, K. Nakanishi and J. Shen, Chem. Mater., 2020, 32, 1595–1604 CrossRef CAS.
- S. V. Ingale, P. B. Wagh, A. K. Tripathi, V. S. Kamble, R. Kumar and S. C. Gupta, J. Porous Mater., 2011, 18, 567–572 CrossRef CAS.
- S. Takeshita and S. Yoda, Nanoscale, 2017, 9, 12311–12315 RSC.
- S. S. Çok and N. Gizli, Ceram. Int., 2020, 46, 27789–27799 CrossRef.
- D. Sanli and C. Erkey, J. Mater. Sci., 2015, 50, 7159–7181 CrossRef CAS.
- L. M. Sanz-Moral, M. Rueda, A. Nieto, Z. Novak, Ž. Knez and Á. Martín, J. Supercrit. Fluids, 2013, 84, 74–79 CrossRef CAS.
- D. Sanli and C. Erkey, ACS Appl. Mater. Interfaces, 2013, 5, 11708–11717 CrossRef CAS.
- M. P. Petkov, S. M. Jones, A. Tsapin and M. S. Anderson, J. Supercrit. Fluids, 2015, 106, 100–104 CrossRef CAS.
- C. Aulin, J. Netrval, L. Wågberg and T. Lindström, Soft Matter, 2010, 6, 3298–3305 RSC.
- K. A. D. Obrey, K. V. Wilson and D. A. Loy, J. Non-Cryst. Solids, 2011, 357, 3435–3441 CrossRef CAS.
- H. Zhang and J. Zhang, J. Colloid Interface Sci., 2020, 569, 254–266 CrossRef CAS.
- H. Maleki, L. Durães, C. A. García-González, P. del Gaudio, A. Portugal and M. Mahmoudi, Adv. Colloid Interface Sci., 2016, 236, 1–27 CrossRef CAS.
- M. Afrashi, D. Semnani, Z. Talebi, P. Dehghan and M. Maheronnaghsh, Mater. Res. Express, 2019, 6, 065408 CrossRef.
- R. Wang, D. Shou, O. Lv, Y. Kong, L. Deng and J. Shen, Int. J. Biol. Macromol., 2017, 103, 248–253 CrossRef CAS.
- I. Smirnova, S. Suttiruengwong and W. Arlt, KONA Powder Part. J., 2005, 23, 86–97 CrossRef CAS.
- S. Giray, T. Bal, A. M. Kartal, S. Kizilel and C. Erkey, J. Biomed. Mater. Res., Part A, 2012, 100, 1307–1315 CrossRef.
- G. Lazovski, G. Bar, B. Ji, N. Atar, U. Banin and R. Gvishi, J. Supercrit. Fluids, 2019, 159, 104496 CrossRef.
- M. J. Nerurkar, G. M. Zentner and J. H. Rytting, J. Controlled Release, 1995, 33, 357–363 CrossRef CAS.
- M. P. Petkov, S. M. Jones, A. Tsapin and M. S. Anderson, J. Supercrit. Fluids, 2015, 106, 100–104 CrossRef CAS.
- W. J. Malfait, R. Verel and M. M. Koebel, J. Phys. Chem. C, 2014, 118, 25545–25554 CrossRef CAS.
- S. S. Çok and N. Gizli, Ceram. Int., 2020, 46, 27789–27799 CrossRef.
- K. S. W. Sing, Pure Appl. Chem., 1982, 54, 2201–2218 Search PubMed.
- C. Jin, S. Han, J. Li and Q. Sun, Carbohydr. Polym., 2015, 123, 150–156 CrossRef CAS.
- R. R. Sever, R. Alcala, J. A. Dumesic and T. W. Root, Microporous Mesoporous Mater., 2003, 66, 53–67 CrossRef CAS.
- T. Y. Wei, T. F. Chang, S. Y. Lu and Y. C. Chang, J. Am. Ceram. Soc., 2007, 90, 2003–2007 CrossRef CAS.
- Y. Gu, S. Chen, J. Ren, Y. A. Jia, C. Chen, S. Komarneni, D. Yang and X. Yao, ACS Nano, 2018, 12, 245–253 CrossRef CAS.
- S. Takeshita and S. Yoda, Chem. Mater., 2015, 27, 7569–7572 CrossRef CAS.
- W. H. Organization, World Health Organization model list of essential medicines: 21st list 2019, World Health Organization, Geneva, 2019 Search PubMed.
- P. Zeng, A. Rao, T. S. Wiedmann and W. Bowles, Drug Dev. Ind. Pharm., 2009, 35, 172–176 CrossRef CAS.
- M. Calcabrini and D. Onna, J. Chem. Educ., 2019, 96, 116–123 CrossRef CAS.
- K. Czarnobaj, Drug Delivery, 2008, 15, 485–492 CrossRef CAS.
- S. Radin, T. Chen and P. Ducheyne, Biomaterials, 2009, 30, 850–858 CrossRef CAS.
- R. Chen, H. Qu, A. Agrawal, S. Guo and P. Ducheyne, J. Mater. Sci.: Mater. Med., 2013, 24, 137–146 CrossRef CAS.
- M. E. Barbour, D. J. O'Sullivan and D. C. Jagger, Colloids Surf., A, 2007, 307, 116–120 CrossRef CAS.
- M. L. Bruschi, in Strategies to Modify the Drug Release from Pharmaceutical Systems, Elsevier, 2015, pp. 63–86 Search PubMed.
- L. Qin, Y. He, X. Zhao, T. Zhang, Y. Qin and A. Du, Molecules, 2020, 25(12), 2752 CrossRef CAS.
- I. Smirnova, S. Suttiruengwong, M. Seiler and W. Arlt, Pharm. Dev. Technol., 2005, 9, 443–452 CrossRef.
Footnote |
| † Electronic supplementary information (ESI) available. See DOI: 10.1039/d1ra00671a |
| This journal is © The Royal Society of Chemistry 2021 |

