 Open Access Article
The molecular imprinting of magnetic nanoparticles with boric acid affinity for the selective recognition and isolation of glycoproteins†
Bangjin Wang a,
Aihong Duana,
Shengming Xiea,
Junhui Zhanga,
Liming Yuan*a and
Qiue Cao
 *b
*b
aDepartment of Chemistry, Yunnan Normal University, Kunming 650500, China
bKey Laboratory of Medicinal Chemistry for Natural Resource, Ministry of Education, School of Chemical Science and Technology, Yunnan University, Kunming 650091, China
First published on 22nd July 2021
Abstract
A strategy was designed for the molecular imprinting of magnetic nanoparticles with boric acid affinity (MNPs@MIP) which were then used for the selective recognition and isolation of glycoproteins. Fe3O4 nanoparticles were prepared by a solvothermal method and direct silanization by the condensation polymerization of aminopropyltriethoxysilane (APTES). Subsequently, phenylboric acid was functionalized by reductive amination between 2,3-difluoro-4-formyl phenylboric acid (DFFPBA) and the amido group. The resultant Fe3O4@SiO2–DFFPBA was then used for the selective adsorption of a glycoprotein template. Finally, a molecularly imprinted layer was covered on the surface nanoparticles by the condensation polymerization of tetraethyl orthosilicate (TEOS). The adsorption capacities of the resultant MNPs@MIP–HRP and MNPs@MIP–OVA to horseradish peroxidase (HRP) or ovalbumin (OVA) were significantly higher than non-imprinted particles (MNPs@NIP). Moreover, the adsorption capacities of MNPs@MIP–HRP and MNPs@MIP–OVA on non-template protein and non-glycoprotein bovine serum albumin (BSA) were significantly lower than those of their respective template proteins, thus indicating that both of the prepared MNPs@MIP exhibited excellent selectivity.
Introduction
The glycosylation of proteins is one of the most important post-translational modification processes in living organisms. As such, glycoproteins play an important role in many biological pathways, including molecular recognition, cell adhesion and immune response.1–4 More importantly, the improper expression of glycoproteins is closely related to many diseases, including cancer5–7 and neurodegenerative diseases.8–10 Therefore, the specific identification and isolation of glycoproteins has become a significant field of research.At present, materials based on lectin,11 antibodies,12 and hydrazine chemistry13 are used for the selective recognition and isolation of glycoproteins. Of these three types of materials, lectin has numerous advantages in terms of material variety; however, its stability and specific recognition ability for glycoprotein are worse than the other two types of materials. Antibodies have the highest specificity for recognizing glycoproteins, but they are also the most expensive. The glycoprotein enrichment efficiency of materials created by hydrazide chemistry is the best, although the procedure needed to prepare these materials is complicated and the conditions required are not easy to control.
Previous research has found that boric acid can selectively adsorb glycoproteins by forming five or six membered cyclic esters between boric acid and the cis-diol of glycosyl.14,15 Furthermore, it is possible to regulate the adsorption and desorption processes by simply adjusting the pH value.16,17 Therefore, boric acid affinity has become widely applied for the recognition and separation of glycoproteins.17–22 Subsequent research has demonstrated that molecularly imprinted materials based on boric acid affinity can exhibit an excellent capacity for selectivity and adsorption.23–26
In the present study, the high selectivity of boric acid affinity molecular imprinting technology was combined with the rapid separation and reusability of magnetic nanomaterials to achieve the specific recognition and rapid separation of glycoproteins.
Experimental
Reagents and material
Horseradish peroxidase (HRP) was obtained from MeilunBio (Dalian, China). 3-Aminopropyltriethoxysilane (APTES), 2,3-difluoro-4-formyl phenylboric acid (DFFPBA), and tetraethyl orthosilicate (TEOS), were purchased from Sigma-Aldrich (St. Louis, MO, USA). Bovine serum albumin (BSA), transferrin (TRF), and ovalbumin (OVA), were obtained from Aladdin (Shanghai, China). All reagents were used without further purification. Deionised water was used to prepare all buffer and analyte solutions.General procedure for the synthesis of MNPs@MIP–glycoprotein
The general scheme for the synthesis of MNPs@MIP–glycoprotein is illustrated in Fig. 1. The Fe3O4 nanoparticles were synthesized by the solvothermal method,27 and a direct silanizing method with APTES was used for the amino group functionalization of Fe3O4 nanoparticles.28 Subsequently, we obtained functionalized phenylboric acid by the reductive amination between 2,3-difluoro-4-formyl phenylboric acid (DFFPBA) and the amido group.29 The resultant Fe3O4@SiO2–DFFPBA was used for the selective adsorption of a template glycoprotein. Finally, the imprinted layer was formed by a sol–gel process of TEOS on the surface using nanoparticles.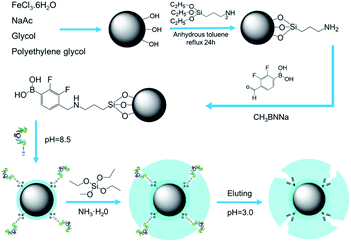 | ||
| Fig. 1 The synthetic routes used to produce boric acid affinity magnetic nano-molecularly imprinted particles. | ||
Binding experiments
To begin with, 2.0 mg Fe3O4@SiO2–FFPBA or MNPs@MIP–glycoprotein were dispersed by ultrasound in 200 μL of test solution (1.0 mg mL−1) which was prepared using an ammonium bicarbonate buffer solution at a concentration of 50 mM (pH = 8.5, containing 500 mM NaCl) with shaking at room temperature (1200 rpm) for 2 h. The concentration of the test solution after adsorption was obtained by determining the ultraviolet absorbance. Then the adsorption capacity (Qe) was calculated using eqn (1).
 | (1) |
In eqn (1), C0 (mg mL−1) represents the initial concentration of protein solution, Ce (mg mL−1) represents the equilibrium concentration of the protein, V (ml) represents the volume of the protein solution, and m (mg) represents the mass of MNPs@MIP–glycoprotein. Contrast adsorption experiments were also performed with MNPs@NIP under the same conditions.
Thermodynamics and the kinetics of adsorption
Isothermal adsorption experiments were carried out as follows. MNPs@MIP–glycoprotein were added to test solution (0.1 to 1.0 mg mL−1) and shaken at room temperature (1200 rpm) for 60 min. The Scatchard equation was then employed to investigate the binding properties of the MNPs@MIP–glycoprotein and MNPs@NIP, as shown by eqn (2).
 | (2) |
In eqn (2), Q (mg g−1) represents the equilibrium adsorption capacity of the material to the substrate, C (mg mL−1) represents the substrate concentration remaining in the adsorption solution after adsorption equilibrium, Qmax (mg g−1) represents the maximum apparent binding amount, and KD represents the equilibrium dissociation constant.
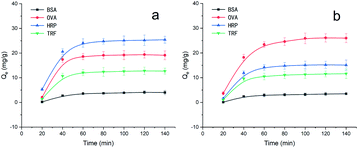
For the kinetics adsorption experiments, the shaking time was changed from 20 min to 140 min. The concentration of the test solutions was kept constant at 1.0 mg mL−1.
Selectivity experiments
The selectivities of the MNPs@MIP–OVA or MNPs@MIP–HRP, and MNPs@NIP were evaluated using OVA, HRP, BSA, and TRF (1.0 mg mL−1) as competitors. The imprinting factor (IF) was used to estimate the recognition capability according to eqn (3).
 | (3) |
In eqn (3), QMIP and QNIP represent the adsorption amounts of the template or the competitive proteins on the MNPs@MIP–OVA or MNPs@MIP–HRP and MNPs@NIP, respectively.
Results and discussion
Characterization of MNPs@MIP
The morphology of the prepared materials was analysed by transmission electron microscopy (TEM) and scanning electron microscopy (SEM). As shown in Fig. 2a and d, the Fe3O4 nanoparticles were 200 nm in diameter and were self-assembled from smaller particles with a diameter of approximately 10 nm. Fig. 2b and e show that the nanoparticles were modified by APTES coating (Fe3O4@SiO2–NH2). On the surface of the particles, we observed a 5 nm layer of silicon dioxide coating containing an ammonia propyl group (Fig. 2b). The new silicon dioxide imprinting layer also increased the thickness of the silicon dioxide coating layer (Fig. 2c). Due to the silicon dioxide coating, the interstices on the surface of the Fe3O4 particles could not be observed clearly (Fig. 2e and f).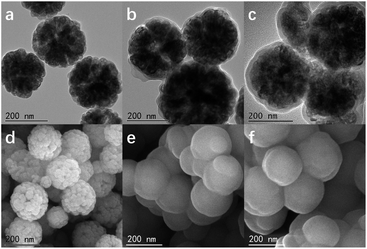 | ||
| Fig. 2 Transmission electron microscope images (a–c) and scanning electron microscope images (d–f) of Fe3O4 (a and d), Fe3O4@APTES (b and e) and MNPs@MIP (c and f). | ||
The distribution of the different elements of Fe3O4@SiO2–FFPBA was observed under a scanning transmission electron microscope (STEM). Fig. S1† shows that the distribution of Fe, O, F, Si, and N, were very clear and were highly consistent with the contours of the particles, thus indicating that aminopropyl silane had been successfully coated on the surface of the particles. Although the distribution of boron did not appear to be clear, the presence of fluorine (which also forms the molecular structure of 2,3-difluoro-4-formylbenzene boric acid), provides strong evidence that phenylboric acid had been successfully added to the surface of the particles.
The distribution of elements in Fe3O4@SiO2–FFPBA was also confirmed by X-ray photoelectron spectroscopy (XPS), in addition to its specific composition. As shown in Fig. S2,† the presence of a characteristic nitrogen peak at 398.4 eV and a silicon peak at 150.5 eV indicated that aminopropyl silane had been successfully coated on to the surface of the particles. Furthermore, the successful modification of 2,3-difluoro-4-formylbenzene boric acid was confirmed by the appearance of a boron peak at 191.4 eV and a fluorine peak at 685.7 eV.
Further evidence to support the successful modification of our nanoparticles was acquired from thermogravimetric analysis (TGA) curves. Fig. S3† shows that the Fe3O4 nanoparticles did not experience a significant loss of weight at high temperatures. However, with the introduction of ammonia propyl and phenylboronic acid groups, the Fe3O4@SiO2–NH2 and Fe3O4@SiO2–FFPBA experienced a gradual loss of weight.
Data acquired by the vibration sample magnetometer (VSM) from the Fe3O4 nanoparticles, Fe3O4@SiO2–FFPBA, and MNPs@MIP are shown in Fig. S4.† None of these products showed any obvious coercivity or hysteresis loops at room temperature, thus indicating typical super-paramagnetism.
Optimization of the thickness of the imprinted layer
In order to investigate how the thickness of the imprinted layer influenced adsorption capacity, we investigated two direct influencing factors: the amount of ammonia (from 0.2 to 1.2 mL) and the reaction time (from 10 to 60 min). TEM images acquired from the MNPs@MIP are shown in Fig. S5 and S6.† These images show that the thickness of the imprinted layer was significantly increased when the dose of ammonia was increased or when the reaction time was prolonged. The adsorption capacity of an imprinted material depends on the number of binding sites on the surface of the material. Consequently, the thinner imprinted layer exposed more binding sites and led to a higher adsorption capacity (Fig. S7†). However, a thinner imprinted layer prevented the formation of imprinted cavities and reduced selectivity. Therefore, 0.4 mL of ammonia and a reaction time of 30 min, were used to prepare MNPs@MIP–OVA. In contrast, 0.4 mL of ammonia and a reaction time of 40 min was used to prepare MNPs@MIP–HRP.The binding properties of MNPs@MIP
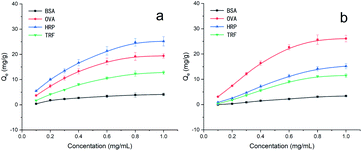
As shown in Fig. 3, the adsorption capacity of MNPs@MIP–HRP and MNPs@MIP–OVA increased rapidly with increasing concentrations of HRP or OVA (from 0.1 to 1.0 mg mL−1) and achieved saturation at a concentration of 1.0 mg mL−1. Therefore, a concentration of 1.0 mg mL−1 was selected as the optimum concentration in the subsequent experiments.Data derived from Scatchard analysis is shown in Fig. 4 and Table 1. As shown in Fig. 4, the MNPs@MIP exhibited a much stronger affinity towards glycoproteins than to the MNPs@NIP. Moreover, data shown in Table 1 indicate that two binding sites (with high affinity and low affinity), existed on the surface of MNPs@MIP. In contrast, only low affinity binding sites were found on the surface of the MNPs@NIP. Compared with the low affinity sites, the high affinity sites showed a lower equilibrium dissociation constant (KD), further indicating that the presence of boric acid leads to a stronger affinity for glycoproteins.
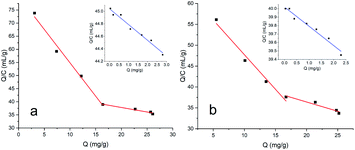 | ||
| Fig. 4 Scatchard curve for MNPs@MIP-HRP to HRP (inset: the Scatchard curve for MNPs@NIP to HRP) (a) and MNPs@MIP–OVA to OVA (inset: the Scatchard curve for MNPs@NIP to OVA) (b). | ||
| Metarials | Affinity of binding sites | Substrates | r2 | Qmax (mg g−1) | KD (mg mL−1) |
|---|---|---|---|---|---|
| MNPs@MIP–HRP | High | HRP | 0.9885 | 31.48 | 0.39 |
| Low | HRP | 0.9612 | 131.45 | 2.94 | |
| MNPs@NIP | Low | HRP | 0.9739 | 160.20 | 4.00 |
| MNPs@MIP–OVA | High | OVA | 0.9804 | 38.72 | 0.60 |
| Low | OVA | 0.9432 | 102.72 | 2.27 | |
| MNPs@NIP | Low | OVA | 0.9674 | 174.09 | 4.35 |
Next, we investigated the binding rate of MNPs@MIP–HRP and MNPs@MIP–OVA. Therefore, we conducted binding kinetics experiments using 1.0 mg mL−1 HRP or OVA solution at different time intervals from 20 to 140 min; the results are presented in Fig. 5. We observed that both MNPs@MIP–HRP and MNPs@MIP–OVA were associated with a fast adsorption profile and that the adsorption equilibrium was reached after 80 min and 100 min, respectively.
Selectivity
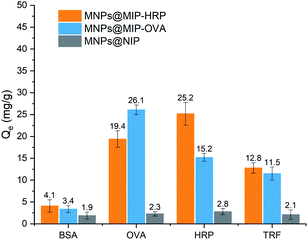
Fig. 6 shows the adsorption capacity of MNPs@MIP–HRP, MNPs@MIP–OVA, and MNPs@-NIP for BSA, OVA, HRP, and TRF. It was evident that MNPs@MIP–HRP and MNPs@MIP–OVA had higher adsorption capacities for glycoproteins when compared to non-glycoprotein BSA, thus revealing excellent selectivity. Moreover, both of these materials had a higher adsorption capacity than the other glycoproteins for their respective template molecules, thus demonstrating good recognition specificity. Fig. 6 also shows that the adsorption capacity of MNPS–NIP to proteins was significantly lower than for MNPs@MIP–HRP and MNPs@MIP–OVA, and there was no selectivity for glycoproteins and non-glycoproteins. These data indicated that both MNPs@MIP had a high imprinting effect, with imprinting factors (IF) of 10.96 and 12.42, respectively. Compared with other molecularly imprinted materials based on boric acid affinity, as reported in the recent literature30–37 (Table 2), the imprinted materials prepared in the current study had a lower adsorption capacity for template glycoprotein, but they also had the highest imprinting factor, thus indicating that they exhibited better selectivity to template glycoprotein.| Adsorbent | Adsorbate | Qe (mg g−1) | IF | References |
|---|---|---|---|---|
| GO–APBA/MIPs–OVA | OVA | 278.0 | 9.60 | 30 |
| GO–APBA/MIPs–HRP | HRP | 218.75 | 6.73 | 30 |
| MNPs@pTiO2@MIP–OVA | OVA | 30.75 | 1.35 | 31 |
| MNPs@pTiO2@MIP–HRP | HRP | 69.04 | 3.37 | 31 |
| MMINs | OVA | 30.6 | 3.58 | 32 |
| MMINs | HRP | 49.6 | 6.20 | 32 |
| Fe3O4@PGMA–TBA/MIPs | OVA | 190.7 | 7.37 | 33 |
| GO@PVPBA | OVA | 514.8 | — | 34 |
| Fe3O4@P(AAPBA-co-PEGMA) | OVA | 340.0 | — | 35 |
| CPBA-Ni6PW9/SA | OVA | 373.3 | — | 36 |
| MCNTs@p(PEGMA-co-VPBA) | HRP | 51.0 | — | 37 |
| MNPs@MIP–HRP | HRP | 25.2 | 12.43 | This work |
| MNPs@MIP–OVA | OVA | 26.1 | 10.96 | This work |
Adsorption experiments on mixed samples containing different mass ratios of non-glycoprotein BSA and glycoprotein HRP or OVA were conducted to further investigate the adsorption selectivity of MNPs@MIP–OVA and MNPs@MIP–HRP (Fig. 7). The results showed that the adsorption capacity of the two MNPs@MIP to the eluent increased with the increase of the mass proportion of template glycoprotein in the mixed solution, which verified the selective adsorption capacity of MNPs@MIP–OVA and MNPs@MIP–HRP to the template glycoprotein.
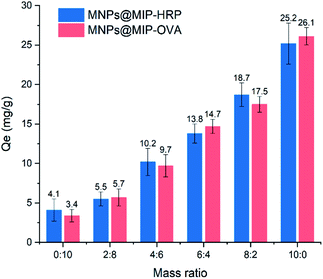 | ||
| Fig. 7 Adsorption capacity of MNPs@MIP–OVA and MNPs@MIP–HRP to the mixed samples containing different mass ratios of non-glycoprotein BSA and glycoprotein HRP or OVA. | ||
MALD-TOF was used to detect the solution prior to adsorption, and the eluent after adsorption by MNPs@MIP and MNPs@NIP; the results are shown in Fig. 8. It was evident that the content of template proteins in the eluent following the adsorption of MNPs@MIP was significantly higher than that after the adsorption of MNPs@NIP, thus indicating that the resultant MNPs@MIP had excellent selectivity for template proteins.
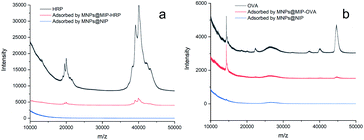 | ||
| Fig. 8 MALDI-TOF MS spectra of the solution before adsorption and the eluent adsorbed by MNPs@MIP and MNPs@NIP: (a) HRP, (b) OVA. | ||
Reusability
Next, we tested the reusability of MNPs@MIP and obtained satisfying results (Fig. S8†). Due to the loss of imprinted particles during the recycling process, the adsorption capacity of MNPs@MIP–OVA and MNPs@MIP–HRP decreased slightly after five adsorption–desorption cycles. These results suggest that the stability of MNPs@MIP is satisfactory and that this material can be used in practical applications.Conclusions
In summary, we designed a novel strategy for the assembly of magnetic nanoparticles that were molecularly imprinted with boric acid affinity. This was achieved by the direct silanizing method, the reductive amination method, and the sol–gel method. The resultant MNPs@MIP exhibited high adsorption capacity and excellent reusability. In addition, the selective recognition and isolation of glycoproteins was successfully achieved. The combination of direct silanization, reductive amination and the sol–gel process, is a feasible strategy with which to assemble magnetic nanoparticles molecularly imprinted with boric acid affinity that can be used to recognize and isolate glycoproteins.Conflicts of interest
There are no conflicts to declare.Acknowledgements
This research was supported by the National Natural Science Foundation of China (No. 91856123 and No. 21665028).Notes and references
- K. Ohtsubo and J. D. Marth, Cell, 2006, 126, 855–867 CrossRef CAS PubMed.
- R. J. Copeland, G. Han and G. W. Hart, Proteomics: Clin. Appl., 2013, 7, 597–606 CAS.
- A. Helenius and M. Aebi, Annu. Rev. Biochem., 2004, 73, 1019–1049 CrossRef CAS PubMed.
- A. Lux and F. Nimmerjahn, Adv. Exp. Med. Biol., 2011, 780, 113–124 CrossRef CAS PubMed.
- L. Uttley, B. L. Whiteman, H. B. Woods, S. Harnan, S. T. Philips, I. A. Cree and C. Early, Cancer Detection, EBioMedicine, 2016, 10, 164–173 CrossRef PubMed.
- D. H. Dube and C. R. Bertozzi, Nat. Rev. Drug Discovery, 2005, 4, 477–488 CrossRef CAS PubMed.
- M. M. Fuster and J. D. Esko, Nat. Rev. Cancer, 2005, 5, 526–542 CrossRef CAS PubMed.
- H. Hwang, J. Zhang, K. A. Chung, J. B. Leverenz, C. P. Zabetian, E. R. Peskind, J. Jankovic, Z. Su, A. M. Hancock, C. Pan, T. J. Montine, S. Pan, J. Nutt, R. Albin, M. Gearing, R. P. Beyer, M. Shi and J. Zhang, Mass Spectrom. Rev., 2010, 29, 79–125 CrossRef CAS PubMed.
- A. Palmigiano, R. Barone, L. Sturiale, C. Sanfilippo, R. O. Bua, D. A. Romeo, A. Messina, M. L. Capuana, T. Maci, F. Le Pira, M. Zappia and D. Garozzo, J. Proteomics, 2016, 131, 29–37 CrossRef CAS PubMed.
- S. Schedin-Weiss, B. Winblad and L. O. Tjernberg, FEBS J., 2014, 281, 46–62 CrossRef CAS PubMed.
- B. F. Mann, A. K. P. Mann, S. E. Skrabalak and M. V. Novotny, Anal. Chem., 2013, 85, 1905–1912 CrossRef CAS PubMed.
- P. C. Lin, P. H. Chou, S. H. Chen, H. K. Liao, K. Y. Wang, Y. J. Chen and C. C. Lin, Small, 2006, 2, 485–489 CrossRef CAS PubMed.
- J. Huang, H. Wan, Y. Yao, J. Li, K. Cheng, J. Mao, J. Chen, Y. Wang, H. Qin, W. Zhang, M. Ye and H. Zou, Anal. Chem., 2015, 87, 10199–10204 CrossRef CAS PubMed.
- W. L. Brooks and B. S. Sumerlin, Chem. Rev., 2016, 116, 1375–1397 CrossRef CAS PubMed.
- R. Nishiyabu, Y. Kubo, T. D. James and J. S. Fossey, Chem. Commun., 2011, 47, 1106–1123 RSC.
- D. J. Li, Y. Chen and Z. Liu, Chem. Soc. Rev., 2015, 44, 8097–8123 RSC.
- Z. Liu and H. He, Acc. Chem. Res., 2017, 50, 2185–2193 CrossRef CAS PubMed.
- C. Bi, S. Zhang, Y. Li, X. He, L. Chen and Y. Zhang, New J. Chem., 2018, 42, 17331–17338 RSC.
- X. Zhang, X. He, L. Chen and Y. Zhang, J. Mater. Chem., 2012, 22, 16520–16526 RSC.
- Y. Liu, Y. Lu and Z. Liu, Chem. Sci., 2012, 3, 1467 RSC.
- J. Liu, K. Yang, W. Shao, Y. Qu, S. Li, Q. Wu, L. Zhang and Y. Zhang, ACS Appl. Mater. Interfaces, 2016, 8, 9552–9556 CrossRef CAS PubMed.
- Y. Wang, X. Hai, S. E, M. Chen, T. Yang and J. Wang, Nanoscale, 2018, 10, 4913–4920 RSC.
- X. Wang, J. Yu, Q. Kang, D. Shen, J. Li and L. Chen, Biosens. Bioelectron., 2016, 77, 624–630 CrossRef CAS PubMed.
- W. Wan, Q. Han, X. Zhang, Y. Xie, J. Sun and M. Ding, Chem. Commun., 2015, 51, 3541–3544 RSC.
- J. Erdőssy, V. Horváth, A. Yarman, F. W. Scheller and R. E. Gyurcsányi, TrAC, Trends Anal. Chem., 2016, 79, 179–190 CrossRef.
- A. Pal, M. Berube and D. G. Hall, Angew. Chem., Int. Ed. Engl., 2010, 49, 1492–1495 CrossRef CAS PubMed.
- H. Deng, L. X. Lin, P. Qing, X. Wang, J. P. Chen and Y. D. Li, Angew. Chem., Int. Ed., 2005, 44, 2782–2785 CrossRef CAS PubMed.
- X. Kan, Q. Zhao, D. Shao, Z. Geng, Z. Wang and J. J. Zhu, J. Phys. Chem. B, 2010, 114, 3999–4004 CrossRef CAS PubMed.
- Z. J. Bie, Y. Chen, J. Ye, S. S. Wang and Z. Liu, Angew. Chem., Int. Ed. Engl., 2015, 54, 10211–10215 CrossRef CAS PubMed.
- J. Luo, J. Huang, J. J. Cong, W. Wei and X. Y. Liu, ACS Appl. Mater. Interfaces, 2017, 9, 7735–7744 CrossRef CAS PubMed.
- X. Y. Sun, R. T. Ma, J. Chen and Y. P. Shi, Mikrochim. Acta, 2018, 185, 565–574 CrossRef PubMed.
- R. T. Ma, W. Ha, J. Chen and Y. P. Shi, J. Mater. Chem. B, 2016, 4, 2620–2627 RSC.
- H. Zhu, H. Yao, K. Xia, J. Liu, X. Yin, W. Zhang and J. Pan, Chem. Eng. J., 2018, 346, 317–328 CrossRef CAS.
- X. An, X. He, L. Chen and Y. Zhang, J. Mater. Chem. B, 2016, 4, 6125–6133 RSC.
- X. H. Zhang, J. W. Wang, X. W. He, L. X. Chen and Y. K. Zhang, ACS Appl. Mater. Interfaces, 2015, 7, 24576–24584 CrossRef CAS PubMed.
- W. Xu, J. F. Cao, Y. Y. Zhang, Y. Shu and J. H. Wang, Talanta, 2020, 210, 120620 CrossRef CAS PubMed.
- X. An, H. Wu, Y. Li, X. He, L. Chen and Y. Zhang, Talanta, 2020, 210, 120632 CrossRef CAS PubMed.
Footnote |
| † Electronic supplementary information (ESI) available. See DOI: 10.1039/d1ra00716e |
| This journal is © The Royal Society of Chemistry 2021 |

