 Open Access Article
Creative Commons Attribution 3.0 Unported Licence
Synthesis and characterization of a new ZIF-67@MgAl2O4 nanocomposite and its adsorption behaviour†
Mehdi Davoodia,
Fatemeh Davar*a,
Mohammad R. Rezayata,
Mohammad T. Jafaria,
Mehdi Bazarganipoura and
Ahmed Esmail Shalan‡
 *bc
*bc
aDepartment of Chemistry, Isfahan University of Technology, Isfahan, 84156-83111, Iran. E-mail: davar@cc.iut.ac.ir
bBCMaterials, Basque Center for Materials, Applications and Nanostructures, Martina Casiano, UPV/EHU Science Park, Barrio Sarriena s/n, Leioa 48940, Spain. E-mail: a.shalan133@gmail.com; ahmed.shalan@bcmaterials.net
cCentral Metallurgical Research and Development Institute (CMRDI), P.O. Box 87, Helwan, Cairo 11421, Egypt
First published on 8th April 2021
Abstract
Fabricating suitable adsorbents with low-cost and high efficiency extraction for measurement of very small amounts of agricultural pesticides in food and water is playing a vital key role in personal and environmental health. Here, a new composite of zeolitic imidazolate framework-67@magnesium aluminate spinel (ZIF-67@MgAl2O4) has been fabricated by a simple method at room temperature with different weight ratios. Several techniques such as FE-SEM, BET, XRD, and TGA have been used to confirm the structural characterization of the obtained materials. The obtained ZIF-67@MgAl2O4 was utilized as an adsorbent in the solid phase microextraction technique to extract and preconcentrate the herbicide molinate (as an analyte) in aqueous solution. Corona discharge ionization-ion mobility spectrometry (CD-IMS) was applied for quantification of the analyte molecules. Extraction temperature, extraction time, stirring rate, and sample pH as the main parameters that affected the extraction proficiency were chosen and considered. Under optimal conditions, the linear dynamic range (LDR) of the various concentrations of the molinate and correlation coefficient were 10.0–100.0 μg L−1 and 0.9961, respectively. The limit of quantification (LOQ) and method detection limit (MDL) were 10.0 μg L−1 and 3.0 μg L−1, respectively. The relative standard deviation (RSD) of the ZIF-67@MgAl2O4 for extracting the molinate molecules (molinate concentration; 50 μg L−1) was calculated to be 4% and the enrichment factor (EF) was ∼5.
1. Introduction
Pesticide contamination is one of the significant global issues that humans grapple with. Therefore, extraction and measurement of agricultural pesticides by instrumental methods in food and water plays a key role in personal health and prevention of environmental problems.1,2 In 1970, ion mobility spectrometry (IMS) was first invented by Karasek and Cohen.3 The IMS technique was rapidly developed due to its advantages including high sensitivity, rapidity, and simplicity as a spectroscopy technique. The production of ions in the gas phase and the mobility of these ions in a weak electric field is the base mechanism of the IMS system. This technique is widely used for identification of various compounds, such as explosive materials, chemical gases, poisonous materials (herbicide, pesticide, and insecticide), and abuse and clinical drugs.4Magnesium aluminate (MgAl2O4) is one of the furthermost significant oxide spinel and ceramic materials that has desirable mechanical properties and wide range of applications even if affected with very high temperatures.5,6 These applications originate from high melting point, high acid and base resistance, unique optical properties, low dielectric constant and high mechanical strength at both room temperature and high temperature.7–9 In a number of applications, particularly adsorption, the synthesis of the MgAl2O4 spinel has attracted a lot of attention because of its features like large surface area, little crystallite size, additional active sites, least particle agglomeration, wettability and suitable energy gap.10–12
Metal–organic frameworks (MOFs) recognized as a category of porous crystalline materials, have been used in many scientific researches,13–15 like electronic devices, adsorption, gas storage, sensors, catalysts, biomedical, separation, and luminescence applications.16–18 These various applications are originated from inherent features of MOFs, like permanent porosity, uniform, tunable pore size, large crystallization, tunable organic ligands, high pore volume, solvent resistance, and wide surface area.19,20 Zeolitic imidazolate frameworks (ZIFs) are known as a particular and novel class of metal–organic frameworks potentially including bridging organic linkers and metal ions with inherent porosity also excellent thermal and chemical stability.21,22 Altered uses of ZIF nanostructures are extremely affected by considering size and various morphology of the prepared materials.23 Different parameters like molar ratio of reactants, solvent and temperature have been able to potentially influence the size and morphology of the prepared ZIF nanostructures.24,25 Recently, the fabricating of new composites based on MOF in order to improve the properties of these compounds has gained an increasing amount of attention in scientific researches such as, MOF/MOF microporous,26 MOF/Fe3O4 microporous,27 ZIF-8/ZIF-67 core–shell28 and SiO2/MOF nanocomposites.29
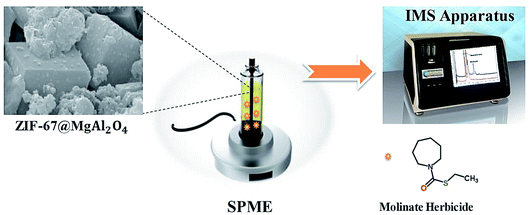
In this study, a new composite of ZIF-67@MgAl2O4 was successfully prepared via an unpretentious procedure at room temperature with different weight proportions. The ZIF-67@MgAl2O4 nanocomposite provides many advantages such as excellent mechanical, thermal and chemical stability, additional active sites, wettability, high acid and base resistance, unique optical properties, polarity, tunable organic ligands and hydrophobicity. This composite can potentially be applied in a wide range of applications even up to very high temperatures. For characterization of ZIF-67@MgAl2O4 nanocomposite, several techniques including FE-SEM, BET, XRD, ICP, FT-IR, and TGA were used. Then, the influence of weight ratio was studied on the morphology of the ZIF-67@MgAl2O4 nanocomposites. To study the capability of the ZIF-67@MgAl2O4 as an adsorbent, solid phase microextraction (SPME) technique was utilized for preconcentration of the herbicide molinate (as analyte) in the aqueous solution. Furthermore, corona discharge ionization-ion mobility spectrometry (CD-IMS) was utilized to detect the analyte molecules. For increasing the preconcentration of the analyte from aqueous solution, some essential factors on the extraction efficiency were selected, studied and optimized. The attained composite displays a respectable way to adsorb undesirable constituents in water for environmental health applications.
2. Experimental part
2.1. Materials
All reagents are applied as received from the companies without more purification. Aluminum nitrate (Al(NO3)3·9H2O), magnesium nitrate (Mg(NO3)2·6H2O), succinic acid (C4H6O4) (Merck Company) and diethylene glycol (Dae-Jung Company) were used to prepare MgAl2O4 spinel. Cobalt nitrate (Co(NO3)2·6H2O), 2-methylimidazole, anhydrous methanol (99.9%) (Sigma-Aldrich Company) were used to prepare ZIF-67 material. Furthermore, herbicide molinate (98% purity) (Kavosh Kimia Kerman Company) was used as an analyte.2.2. Synthesis of MgAl2O4 nanoparticle
MgAl2O4 nanoparticles are prepared according to the reported method through an amended sol–gel route.30 In a typical preparation, (Al(NO3)3·9H2O) and (Mg(NO3)2·6H2O) with a molar proportion of 1![[thin space (1/6-em)]](https://www.rsc.org/images/entities/char_2009.gif) :
:![[thin space (1/6-em)]](https://www.rsc.org/images/entities/char_2009.gif) 2 in addition to diethylene glycol and succinic acid with a molar proportion of 1
2 in addition to diethylene glycol and succinic acid with a molar proportion of 1![[thin space (1/6-em)]](https://www.rsc.org/images/entities/char_2009.gif) :
:![[thin space (1/6-em)]](https://www.rsc.org/images/entities/char_2009.gif) 1 individually, were dissolved in distilled water. The solution was mixed and stirred for 1 h at 80 °C to form a sol. Then, in order to remove any excessive water, it was heated at 120 °C for 1 h. Afterward, the solution was heated for 1 h at 150 °C to form a dried gel. In the end, the resulting powders were calcined for 2 h at 800 °C.
1 individually, were dissolved in distilled water. The solution was mixed and stirred for 1 h at 80 °C to form a sol. Then, in order to remove any excessive water, it was heated at 120 °C for 1 h. Afterward, the solution was heated for 1 h at 150 °C to form a dried gel. In the end, the resulting powders were calcined for 2 h at 800 °C.
2.3. Synthesis of ZIF-67@MgAl2O4 nanocomposite
0.21 g of MgAl2O4 and 0.87 g of Co(NO3)2·6H2O were dispersed in 60 mL of methanol solution under stirring for 1 h at room temperature. Simultaneously, a separate solution of 1.28 g of 2-methylimidazole in 60 mL of methanol was formed. Two solutions were slowly added to each other and stirred for 7 h at room temperature. Afterward, the gained solution washed two times with water and methanol, and it was dried under a vacuum for 10 h at 80 °C. The influence of weight of the different precursor materials on the reaction was studied as a variable parameter (Table 1). In this study, first, a higher weight percentage of ZIF-67 than MgAl2O4 spinel was used to make the composite (S1–S3 samples), then this percentage was equalized (S4 sample), and finally, the weight percentage of MgAl2O4 spinel to ZIF-67 was increased (S5 sample).| Sample code | MgAl2O4 (g) | (Co(NO3)2·6H2O) (g) | 2-Methylimidazole (g) |
|---|---|---|---|
| S1 | 0.21 | 0.87 | 1.28 |
| S2 | 0.51 | 0.82 | 1.23 |
| S3 | 1.27 | 0.77 | 1.17 |
| S4 | 1.44 | 0.52 | 0.92 |
| S5 | 2.40 | 0.20 | 0.60 |
2.4. Characterization of samples
2.5. Ion mobility spectrometry procedure
The principal part of the IMS, including IMS cell, pulse and two high voltage generators, an amplifier, a board control for converting the analog to digital signal and a computer. The IMS cell was manufactured from several conductive rings such as aluminum rings. Each ring was separated by isolate rings (e.g. PTFE). The conductive rings were linked by a resistor for creating the constant electric field. The IMS cell was formed from two regions, including reaction region (ionization source) and drift region. In this work, corona discharge (CD) was used for ionization of the sample molecules in the gaseous phase. Generally, corona discharge ionization is a sharp needle that is positioned about millimeters from a conductive plate with a high voltage of 1 to 4 kV between the needle and conductive electrode.32 For separating the reaction and drift regions, Bradbury–Nielsen grid is used. The ion gate was applied for pulse injecting the ionic samples to the drift region. In drift region, the ionic samples are moved to the detector (Faraday cup) based on the applied electric field (E = 200–500 V cm−1). The primary signal was formed by detector, then for improving the primary signal, an amplifier after detector was placed. Thereafter, the amplified signal was processed with analog to digital cards and shown by a computer. The signal for the analyte was plotted against the acquisition time, and the integration of this curve was considered as the peak area.2.6. Evaluation of ZIF-67 performances as an adsorbent for the SPME method
3. Results and discussion
3.1. Characteristics of ZIF-67@MgAl2O4 nanocomposite
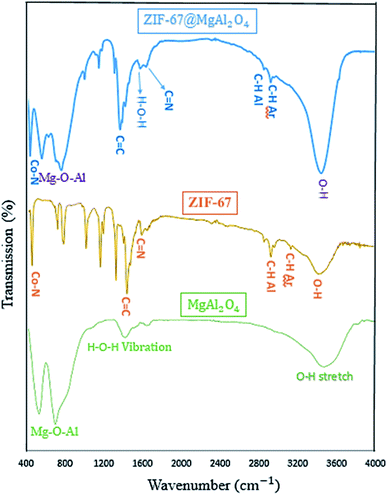
The FT-IR spectra of MgAl2O4, ZIF-67, and ZIF-67@MgAl2O4 materials in the wavenumber range of 400–4000 cm−1 are presented in Fig. 2. The spectrum of MgAl2O4 indicate the presence of O–H stretching and H–O–H vibration. Furthermore, in the spectrum of the ZIF-67@MgAl2O4, the broad band at approximately 3460 cm−1 is assigned to the O–H stretching vibration.33,34 The bands at 3100 and 2900 cm−1 are ascribed to the aromatic and aliphatic C–H in the imidazole ring in case of ZIF-67.18,21 Besides, the band at 1619 cm−1 is related to the H–O–H vibration in case of MgAl2O4 and ZIF-67@MgAl2O4.6,35 The band at 1629 cm−1 is assigned to the C![[double bond, length as m-dash]](https://www.rsc.org/images/entities/char_e001.gif) N stretching vibration.36,37 Additionally, the band at 1420 cm−1 corresponds to the C
N stretching vibration.36,37 Additionally, the band at 1420 cm−1 corresponds to the C![[double bond, length as m-dash]](https://www.rsc.org/images/entities/char_e001.gif) C bond in the imidazole ring in case of ZIF-67 and ZIF-67@MgAl2O4.36–38 The bands observed at about 540 and 700 cm−1 are associated with Mg–O–Al that show and confirm the presence of MgAl2O4.11,34 In addition, the band at 427 cm−1 is allocated to the Co–N band in case of ZIF-67 and ZIF-67@MgAl2O4.37,39,40
C bond in the imidazole ring in case of ZIF-67 and ZIF-67@MgAl2O4.36–38 The bands observed at about 540 and 700 cm−1 are associated with Mg–O–Al that show and confirm the presence of MgAl2O4.11,34 In addition, the band at 427 cm−1 is allocated to the Co–N band in case of ZIF-67 and ZIF-67@MgAl2O4.37,39,40
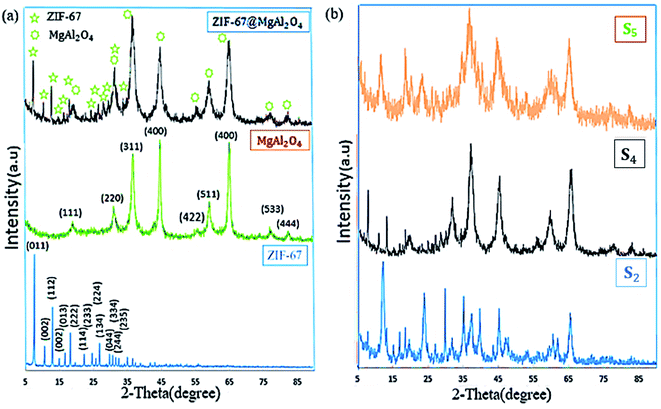
To characterize the phase structures of the as-synthesized ZIF-67@MgAl2O4 nanocomposite, XRD experiments were performed (Fig. 3). As displayed in Fig. 3a, the diffraction peaks of ZIF-67@MgAl2O4 nanocomposite at 2θ values of 19.1° (111), 31.3° (220), 36.8° (311), 45° (400), 55.7° (422), 59.2° (511), 65.4° (440), 77.4° (533) and 82.8° (444) consistent with those of the pure MgAl2O4 (JCPDS card no. 00-010-0062).11,30 X-ray diffraction patterns of ZIF-67@MgAl2O4 nanocomposite, showing that the combination of ZIF-67 has no remarkable influence on the crystal structure of MgAl2O4 nanoparticles. The peaks at 2θ values 7.31° (011), 10.36° (002), 12.72° (112), 14.40° (022), 16.45° (013), 18.04° (222), 22.15° (114), 24.53° (233), 25.62° (224), 26.70° (134), 29.67° (044), 30.62° (334), and 32.43° (235) match with the crystallographic structure of ZIF-67 reported formerly.33,37 Generally, two crystalline phases of ZIF-67 and MgAl2O4 are illustrated in the ZIF-67@MgAl2O4 nanocomposite. Additionally, the XRD pattern of the as-synthesized materials at different weight ratio were indicated in Fig. 3b. The patterns indicated that, with increasing the weight ratios of each of the precursors, the crystalline phase has been improved in the obtained ZIF-67@MgAl2O4 nanocomposite. The reason for the change in the XRD pattern could be that by increasing the weight ratio of ZIF-67 to MgAl2O4 spinel, the intensity of ZIF-67 peaks is much higher than MgAl2O4 spinel. As a result, some of the MgAl2O4 spinel peaks that are less intense are not visible. This also happens for the MgAl2O4 spinel, and as the weight ratio of spinel to ZIF-67 increases, a number of ZIF-67 peaks are not observed in the final pattern due to their lower intensity (although they are present). In the S4 sample, where the weight ratio of ZIF-67 and, MgAl2O4 spinel is the same, all peaks are seen in the XRD pattern of composite because the peaks are the same intensity.
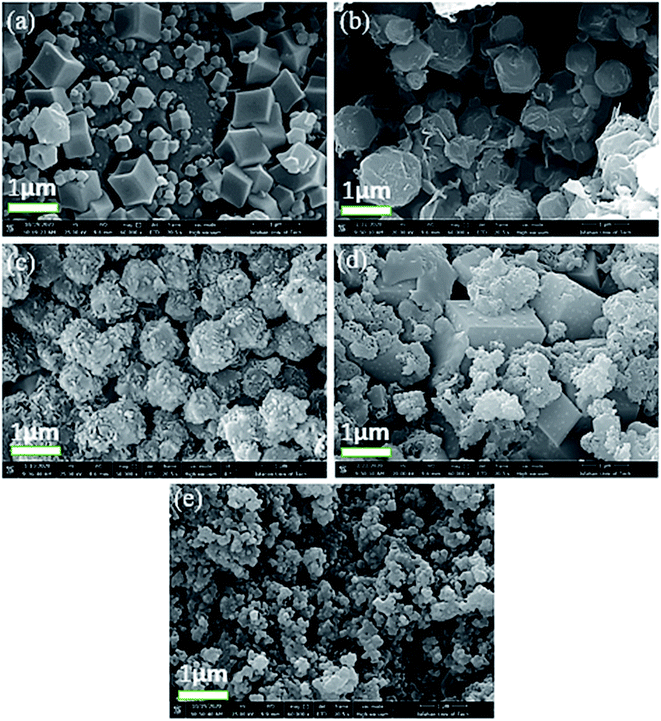
The morphologies of the prepared composite samples with the magnification of 1 micrometer at different weight ratios were studied by FE-SEM analysis (Fig. 4a–e). As displayed in Fig. 4a, rhombic dodecahedral morphology is observed for the S1 sample. The morphologic change is obtained by increasing the weight ratio of MgAl2O4 in the composite (indicate as S2, S3 and S4 sample) as shown in Fig. 4b–d. The average particle size of the as-synthesized MgAl2O4 nanoparticles are founded to be 35–50 nm. The leaf-like morphology with relatively uniform particles are obtained for these samples, and the unchanging constituent parts with quasi-spherical morphology are obtained for S5 samples (Fig. 4e). In addition, the particle size of S5 sample (ZIF-64/spinel = 1![[thin space (1/6-em)]](https://www.rsc.org/images/entities/char_2009.gif) :
:![[thin space (1/6-em)]](https://www.rsc.org/images/entities/char_2009.gif) 4) was 80–90 nm. Generally, the cobalt ion first combines with the MgAl2O4 pre-preparing to form nucleation.20 Additionally, the images of the same samples but with different magnifications are founded in Fig. S1, ESI.†
4) was 80–90 nm. Generally, the cobalt ion first combines with the MgAl2O4 pre-preparing to form nucleation.20 Additionally, the images of the same samples but with different magnifications are founded in Fig. S1, ESI.†
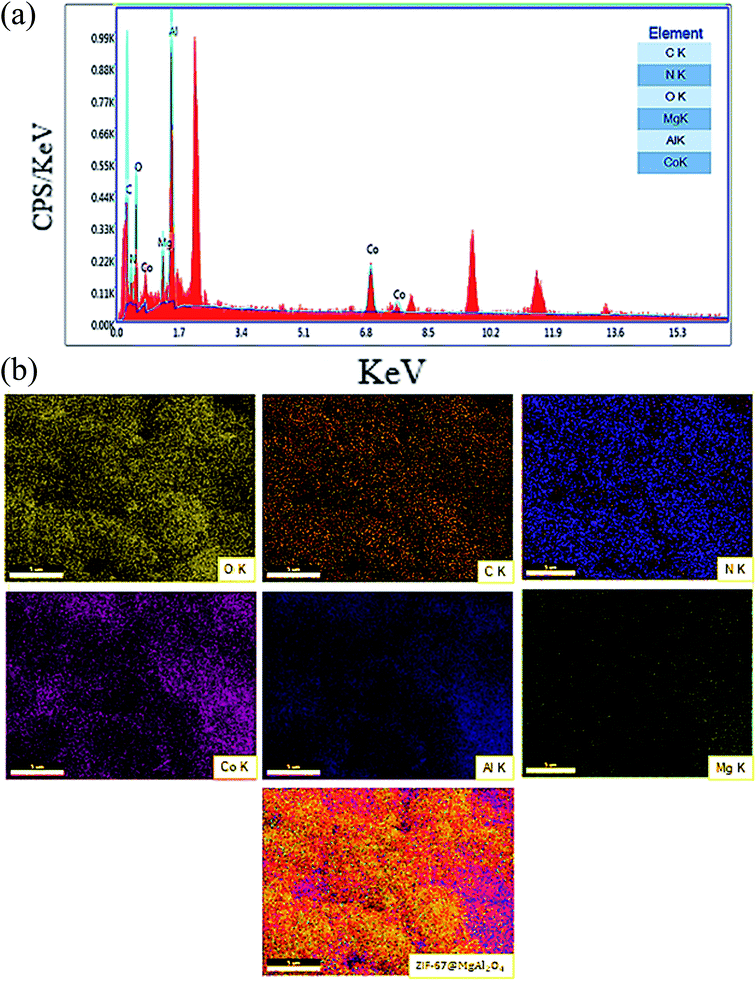
Consequently, the EDX analysis was checked to confirm the different elements in the composition of the ZIF-67@MgAl2O4 nanocomposite. The obtained result displayed the presence of C, N, O, Mg, Co and Al in the composite (Fig. 5a). As well, the existence of C, N, O, Mg, Co and Al elements in uniform distribution inside the ZIF-67@MgAl2O4 nanocomposite have been confirmed by X-ray mapping analysis (Fig. 5b).
ICP analysis was approved to detect the content of elements in the prepared composite.41 As displayed in Table 2, the content of Al3+, Mg2+ and Co2+ in the composite were 11.3 wt%, 4.55 wt% and 25.5 wt% respectively.
| Sample | Al3+ (wt%) | Mg2+ (wt%) | Co2+ (wt%) |
|---|---|---|---|
| ZIF-67@MgAl2O4 | 11.3 | 4.55 | 25.5 |
Additional description systems together with the TGA and DTA curves were tested for the prepared ZIF-67@MgAl2O4 nanocomposite materials (Fig. 6a). The total weight loss of the ZIF-67@MgAl2O4 composite is measured to be 74.4 wt%. Besides, the weight loss at 283 °C can be assigned to the escape of some species (e.g., 2-methylimidazole) from the surfaces and guest molecules (e.g., methanol) from the cavities of the composite. Furthermore, between 285 °C and 600 °C, ZIF-67@MgAl2O4 nanocomposite had a weight loss, which can be because of burning of the carbonaceous remnants of succinic acid and diethylene glycol, formation of γ-Al2O and thermal decomposition of the framework.11,20,33,42
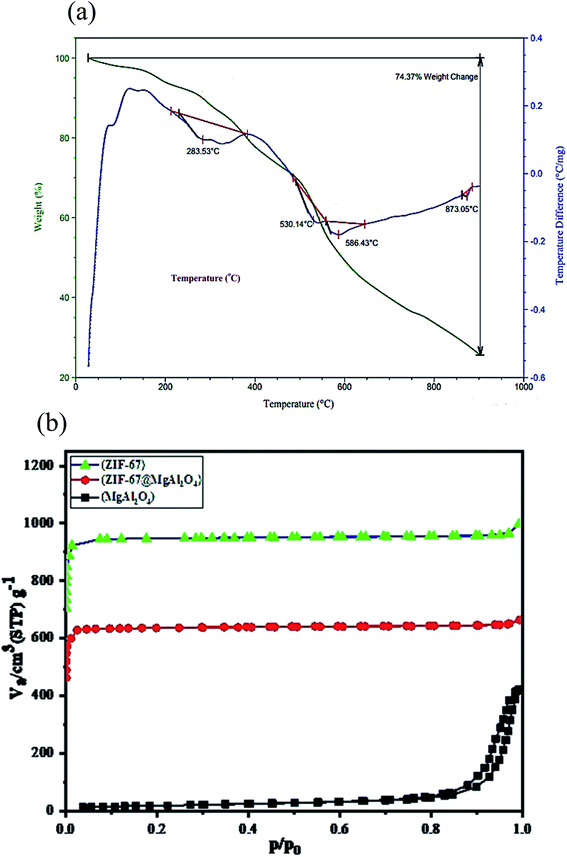 | ||
| Fig. 6 (a) TGA/DTA curves of ZIF-67@MgAl2O4 nanocomposite, (b) N2 adsorption/desorption isotherms of MgAl2O4, ZIF-67 and ZIF-67@MgAl2O4. | ||
The nitrogen adsorption–desorption analysis was checked to characterize the textural properties of the as-synthesized ZIF-67@MgAl2O4 nanocomposite. As indicated in Fig. 6b and Table 3, the specific surface area of ZIF-67@MgAl2O4 found to be 803.8 m2 g−1, while it was 64.8 m2 g−1 for MgAl2O4 material. The as-synthesized ZIF-67@MgAl2O4 displays a decreased specific surface area, compared with the ZIF-67 (1072.4 m2 g−1), which may originate from the heavier MgAl2O4 cores.20,21,30 According to the BET analysis, the pore size of ZIF-67@MgAl2O4 nanocomposite was founded to be 1.71 nm.
3.2. Performance of ZIF-67@MgAl2O4 nanocomposite
To evaluate the ability of ZIF-67@MgAl2O4 nanocomposite as an efficient adsorbent for solid phase microextraction method, three experiments were done when the MgAl2O4, ZIF-67, and ZIF-67@MgAl2O4 were used as the adsorbent for the SPME method. It is necessary to mention that three tests were at the same conditions (the aqueous solution volume; 10 mL, extraction temperature; 5 °C, sample pH; 2, extraction time; 30 min, and stirrer rate; 600 rpm). Firstly, 2 cm of Ni–Cr wire were selected and then MgAl2O4, ZIF-67, and ZIF-67@MgAl2O4 were separately coated on the Ni–Cr wire by silicone binder. Afterward, the adsorbents were used for extraction of molinate molecules (molinate concentration; 50 μg L−1). To detect the molinate molecule, the extracted molinate on the adsorbents were injected to the CD-IMS, respectively. The signals of IMS were plotted for comparing of three experiments. Fig. S2, ESI† depicts the CD-IMS spectra of molinate extracted of 50 μg L−1 by MgAl2O4, ZIF-67, and ZIF-67@MgAl2O4 in the SPME method. The peak areas of the extracted molinate were obtained 630, 1200, and 3500 for MgAl2O4, ZIF-67, and ZIF-67@MgAl2O4, respectively. Based on the calculated result, when the ZIF-67@MgAl2O4 was used as an adsorbent for SPME probe, the highest extraction efficiency was created. The reasons for the better adsorption of ZIF-67@MgAl2O4 nanocomposite than ZIF-67 and, MgAl2O4 spinel could be that each of the ZIF-67 and, MgAl2O4 spinel precursors alone perform specific interactions with the molinate molecule. But when they form a composite together, the existing interactions become more diverse and more numerous, thus increasing the adsorption property. According to the functional groups in the ZIF-67@MgAl2O4 surface and molinate structure, these interactions include hydrogen bonds, electrostatic interactions, and π interactions. While in MgAl2O4 and ZIF-67 alone the mentioned interactions are less and weaker. Also, in the SPME method, the insoluble properties and thermal stability of the prepared adsorbent are important. Therefore, in this research, spinel was used to improve the mentioned properties along with ZIF-67, which has a very good surface area.3.3. Optimization of the parameters affected on the SPME method
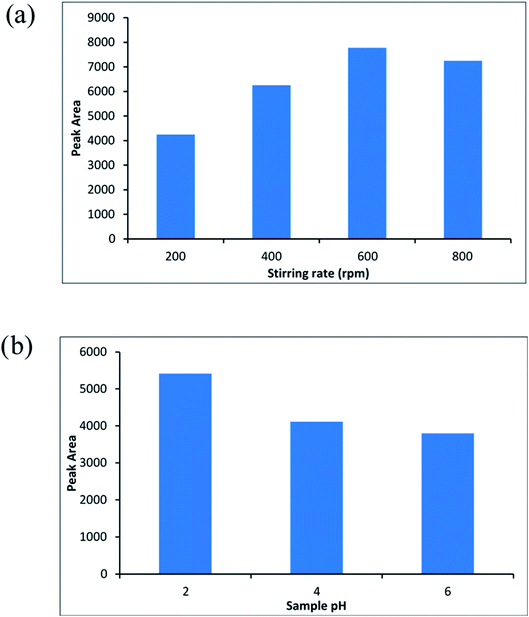
One of the important conditions for extracting of the analyte from aqueous solution is the molinate that should be in the neutral shape. Therefore, the pH of the sample is one of the most important parameters that affect the extraction efficiency. Accordingly, sample pH of 2 until 6 were investigated and optimized (sample volume; 10 mL, the molinate concentration was about 50 μg L−1). Fig. 8b indicates the effect of sample pH on the efficiency of the method and pH = 2 was chosen as an optimized point.
3.4. Analytical parameters
For checking the ability of the proposed method, some analytical parameters, such as the limit of quantification (LOQ), method detection limit (MDL), linear dynamic range (LDR) with correlation coefficient (R2) were appraised with the SPME method for extracting of molinate molecules and then identification by CD-IMS apparatus. In this regard, different molinate concentrations (10 to 150 μg L−1) were prepared in the water solvent. The molinate molecules were extracted by SPME method and injected to the CD-IMS. By the least square method, the calibration curve was plotted and according to the S/N = 3 and S/N = 10, the MDL and LOQ were acquired 3 and 10 μg L−1, respectively. The molinate concentration range of 10 to 100 μg L−1 was obtained as the LDR of the method and the R2 value was calculated 0.9961. Generally, in the IMS technique, the sensitivity and selectivity are introduced to signal to noise ratio (S/N) and the drift time, respectively. The relative standard deviation (RSD%) of the ZIF-67@MgAl2O4 as an adsorbent for extracting the molinate at the concentration of 50 μg L−1 was calculated 4%. The enrichment factor (EF) was calculated by dividing the final concentration of the molinate (the extracted molinate concentration from a spiked sample) to the primary molinate concentration. In this method the EF was obtained 5.3.5. Method comparison
Table 4 displays a comparison of some analytical parameters reached in the study with those reported by other studies for the determination of herbicide molinate. The method presented in the present study to measure herbicide molinate is a simple technique with a suitable detection limit. Despite the availability of the robust separation systems, including high-performance liquid chromatography (HPLC) or gas chromatography (GC) it is almost known as an expensive technique with high run time. On the other hand, the detectors of the HPLC or GC have been used for special compounds not all compounds and accordingly some compounds should be derivatized and so the time and cost are increased severely. The IMS is used for analysing of the various compounds without limitations such as derivatization or high run time. However, in the complex matrices, a stand-alone IMS is not known as a powerful identification system and need to combine with the separation system (HPLC or GC) or sample preparation methods. In the HMDE-based method, mercury is poisonous and it should be definitely shunned for analytical goals. According to the functional groups in the ZIF-67@MgAl2O4 surface and molinate structure, the salt bridge interaction is performed for adsorbing of the molinate. In addition, it has contained electrostatic interaction and hydrogen bonds between adsorbent and analyte.| Method | Sample type | MDLa (mg L−1) | LDRb (mg L−1) | Reference |
|---|---|---|---|---|
| a Method detection limit.b Linear dynamic range.c Solid phase microextraction-corona discharge-ion mobility spectrometer.d HMDE—hanging mercury drop electrode. | ||||
| GC-MS-MS | Water | 4 (μg L−1) | — | 45 |
| Voltammetric-HMDEd | Water | 6.6 (μg L−1) | 0.94–1.69 | 46 |
| HPLC | Water | 0.9 | 0.9–37.5 | 47 |
| GC-FPD | Water | 2.83 (μg L−1) | — | 48 |
| GST-based biosensor | Water | 0.064 | 19–7.9 | 49 |
| SPME-CD-IMSc | Water | 3 (μg L−1) | 10–100 (μg L−1) | This work |
4. Conclusions
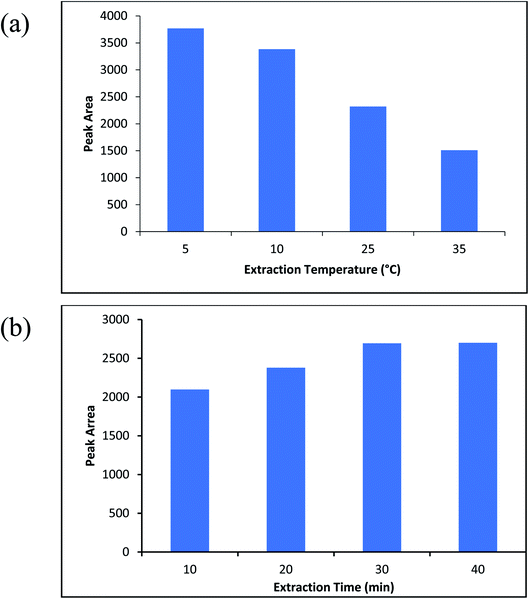
In summary, ZIF-67@MgAl2O4 nanocomposite was successfully prepared for the first time at room temperature via a novel technique with diverse morphologies. To approve the structural characterization of ZIF-67@MgAl2O4 nanocomposite different techniques like TGA, XRD, BET and FE-SEM were applied. Furthermore, to investigate the capability of the ZIF-67@MgAl2O4 as an adsorbent, solid phase microextraction method was applied to extract the herbicide molinate (as a test compound) in the aqueous samples. Extraction time and temperature were optimized 30 min and 5 °C respectively. The dynamic range (LDR) of the altered concentrations of the molinate and correlation coefficient were 10.0–100.0 μg L−1 and 0.9961, respectively. In addition, limit of quantification (LOQ) and method detection limit (MDL) were obtained 10.0 μg L−1 and 3.0 μg L−1, respectively. In this research, the adsorption behaviour of ZIF-67@MgAl2O4 nanocomposite was investigated and this composite has different applications due to its different properties, which can be studied in future studies.Author contributions
M. D. helped in preparing the material, characterization, and writing the manuscript. M. R. R. and M. T. J. helped in characterization of the obtained materials as well as the discussion of the obtained results. Furthermore, F. D., M. B. and A. E. S. designed the research, contributed to supervising the work, discussed the results, and wrote the manuscript. All the authors participated in writing, editing, and revising the manuscript.Conflicts of interest
The authors declare no conflict of interest.Acknowledgements
The authors of the article are delighted to manifest their gratitude Isfahan University of Technology for financial support. Furthermore, AES is grateful for the National Research grants from MINECO, Spain, “Juan de la Cierva” [FJCI-2018-037717]. Mrs Leila Mohammadipour is also specially acknowledged for her valuable assistance.References
- E. Sancho, J. J. Cerón and M. D. Ferrando, Ecotoxicol. Environ. Saf., 2000, 46, 81–86 CrossRef CAS PubMed.
- O. C. Nunes, A. R. Lopes and C. M. Manaia, Appl. Microbiol. Biotechnol., 2013, 97, 10275–10291 CrossRef CAS PubMed.
- M. J. Cohen and F. W. Karasek, J. Chromatogr. Sci., 1970, 8, 330–337 CrossRef CAS.
- H. Borsdorf and G. A. Eiceman, Appl. Spectrosc. Rev., 2006, 41, 323–375 CrossRef CAS.
- I. Ganesh, Int. Mater. Rev., 2013, 58, 63–112 CrossRef CAS.
- N. Habibi, Y. Wang, H. Arandiyan and M. Rezaei, Adv. Powder Technol., 2017, 28, 1249–1257 CrossRef CAS.
- C. Baudín, R. Martínez and P. Pena, J. Am. Ceram. Soc., 1995, 78, 1857–1862 CrossRef.
- M. Sindel, N. A. Travitzky and N. Claussen, J. Am. Ceram. Soc., 1990, 73, 2615–2618 CrossRef CAS.
- I. Ganesh, et al., Ceram. Int., 2002, 28, 245–253 CrossRef CAS.
- A. Saberi, F. Golestani-Fard, M. Willert-Porada, R. Simon, T. Gerdes and H. Sarpoolaky, J. Eur. Ceram. Soc., 2008, 28, 2011–2017 CrossRef CAS.
- S. Sanjabi and A. Obeydavi, J. Alloys Compd., 2015, 645, 535–540 CrossRef CAS.
- A. K. Schmidt-Verma, et al., Adv. Eng. Mater., 2020, 2000738, 2–9 Search PubMed.
- M. Jian, B. Liu, R. Liu, J. Qu, H. Wang and X. Zhang, RSC Adv., 2015, 5, 48433–48441 RSC.
- R. Taheri-Ledari, S. S. Mirmohammadi, K. Valadi, A. Maleki and A. E. Shalan, RSC Adv., 2020, 10, 43670–43681 RSC.
- B. Wang, A. P. Côté, H. Furukawa, M. O'Keeffe and O. M. Yaghi, Nature, 2008, 453, 207–211 CrossRef CAS PubMed.
- S. Achmann, G. Hagen, J. Kita, I. M. Malkowsky, C. Kiener and R. Moos, Sensors, 2009, 9, 1574–1589 CrossRef CAS PubMed.
- J. Kim, S.-N. Kim, H.-G. Jang, G. Seo and W.-S. Ahn, Appl. Catal., A, 2013, 453, 175–180 CrossRef CAS.
- N. Mostafazadeh, A. A. Ghoreyshi and K. Pirzadeh, Iran. J. Chem. Chem. Eng., 2018, 15, 27–47 Search PubMed.
- G. Xu, T. Yamada, K. Otsubo, S. Sakaida and H. Kitagawa, J. Am. Chem. Soc., 2012, 134, 16524–16527 CrossRef CAS PubMed.
- Q. Yang, et al., Chem. Eng. J., 2018, 333, 49–57 CrossRef CAS.
- A. Barjola, J. Escorihuela, A. Andrio, E. Giménez and V. Compañ, Nanomaterials, 2018, 8, 1–17 CrossRef PubMed.
- Z. Jiang, Z. Li, Z. Qin, H. Sun, X. Jiao and D. Chen, Nanoscale, 2013, 5, 11770–11775 RSC.
- A. Kasik, X. Dong and Y. S. Lin, Microporous Mesoporous Mater., 2015, 204, 99–105 CrossRef CAS.
- M. Drobek, et al., J. Membr. Sci., 2015, 475, 39–46 CrossRef CAS.
- X. Guo, T. Xing, Y. Lou and J. Chen, J. Solid State Chem., 2016, 235, 107–112 CrossRef CAS.
- K. Koh, A. G. Wong-Foy and A. J. Matzger, Chem. Commun., 2009, 41, 6162–6164 RSC.
- F. Ke, L. G. Qiu, Y. P. Yuan, X. Jiang and J. F. Zhu, J. Mater. Chem., 2012, 22, 9497–9500 RSC.
- J. Yang, et al., Angew. Chem., 2015, 127, 11039–11043 CrossRef.
- J. Della Rocca, D. Liu and W. Lin, Acc. Chem. Res., 2011, 44, 957–968 CrossRef CAS PubMed.
- N. Karami, F. Davar and S. Hassani, Mater. Res. Express, 2019, 9, p095092 Search PubMed.
- M. R. Rezayat and M. T. Jafari, Microchem. J., 2020, 159, 105551 CrossRef CAS.
- G. A. Eiceman and Z. Karpas, Ion Mobility Spectrometry, CRC Press, Boca Raton, FL, 2nd edn, 2005 Search PubMed.
- Z. Zhang, J. Zhang, J. Liu, Z. Xiong and X. Chen, Water, Air, Soil Pollut., 2016, 227, 471 CrossRef.
- V. Singh, R. P. S. Chakradhar, J. L. Rao and D. K. Kim, J. Solid State Chem., 2007, 180, 2067–2074 CrossRef CAS.
- J. Guo, H. Lou, H. Zhao, X. Wang and X. Zheng, Mater. Lett., 2004, 58, 1920–1923 CrossRef CAS.
- J. Cravillon, R. Nayuk, S. Springer, A. Feldhoff, K. Huber and M. Wiebcke, Chem. Mater., 2011, 23, 2130–2141 CrossRef CAS.
- M. Davoodi, F. Davar, M. R. Rezayat, M. T. Jafari and A. E. Shalan, RSC Adv., 2021, 11, 2643–2655 RSC.
- A. Ulu, J. Mater. Sci., 2020, 55, 6130–6144 CrossRef CAS.
- X. Li, X. Gao, L. Ai and J. Jiang, Chem. Eng. J., 2015, 274, 238–246 CrossRef CAS.
- H. Liu, et al., J. Mater. Res. Technol., 2019, 8, 6289–6300 CrossRef CAS.
- T. Anna, M. Sandri, E. Landi, D. Pressato, S. Francioli, R. Quarto and I. Martin, Biomaterials, 2008, 29, 3539–3546 CrossRef PubMed.
- C. Janosch, S. Münzer, S. Lohmeier, A. Feldhoff, K. Huber and M. Wiebcke, Chem. Mater., 2009, 21, 1410–1412 CrossRef.
- W. A. Wan Ibrahim, H. Farhani, M. M. Sanagi and H. Y. Aboul-Enein, J. Chromatogr. A, 2010, 1217, 4890–4897 CrossRef PubMed.
- M. T. Jafari, M. R. Rezayat and M. Mossaddegh, Talanta, 2018, 178, 369–376 CrossRef CAS PubMed.
- A. Penetra, V. Vale Cardoso, E. Ferreira and M. J. Benoliel, Water Sci. Technol., 2010, 62, 667–675 CrossRef CAS PubMed.
- M. F. Barroso, O. C. Nunes, M. C. Vaz and C. Delerue-Matos, Anal. Bioanal. Chem., 2005, 381, 879–883 CrossRef CAS PubMed.
- L. Barreiros, C. M. Manaia and O. C. Nunes, Biodegradation, 2011, 22, 445–461 CrossRef CAS PubMed.
- M. Castro, A. C. Silva-Ferreira, C. M. Manaia and O. C. Nunes, Chemosphere, 2005, 59, 1059–1065 CrossRef CAS PubMed.
- T. I. S. Oliveira, et al., Talanta, 2013, 106, 249–254 CrossRef CAS PubMed.
Footnotes |
| † Electronic supplementary information (ESI) available. See DOI: 10.1039/d1ra01056e |
| ‡ Currently on leave from CMRDI. |
| This journal is © The Royal Society of Chemistry 2021 |

