 Open Access Article
A systematic investigation on synergistic electroplating and capacitive removal of Pb2+ from artificial industrial waste water†
Yang Gui a and
Daniel J. Blackwood
 *b
*b
aKey Laboratory of Hubei Province for Coal Conversion and New Carbon Materials, School of Chemistry and Chemical Engineering, Wuhan University of Science and Technology, Wuhan 430081, P. R. China. E-mail: guiyang@wust.edu.cn; Tel: +86 13409630857
bDepartment of Materials Science and Engineering, National University of Singapore, Singapore 119077, Singapore. E-mail: msedjb@nus.edu.sg; Tel: +65 65166289
First published on 6th April 2021
Abstract
A capacitive deionization cell designed with symmetric activated carbon electrodes was demonstrated to be able to successfully reduce wastewater Pb2+ concentrations to below the 5 ppm statuary limited for discharge into public sewers. The investigation found that the removal efficiency shows a maximum of 98% with an initial Pb2+ concentration of 100 ppm under an optimized voltage of 1.3 V. Although the reversibility of the process was poor during the first charge/discharge cycle, in part due to cathodic electrodeposition of lead hydroxycarbonates, this was improved by acidification of the electrolyte and subsequent cycles showed good reversibility. Finally, it was demonstrated that Na+ ions, with 50% removal efficiency and 100% reversibility, do not interfere with either the removal rate of Pb2+ ions or the reversibility of this process, providing a new angle on desalination applications for the system.
Introduction
The disposal of heavy metals in aquatic environments is a major concern worldwide, due to its adverse effects on ecosystems and human health.1–5 The heavy metals with high mobility are easily absorbed by living organisms where they accumulated. In the human body, even at a low amount can induce severe illnesses like cancer, damage to organs and the nervous system, and even lead to death.6 Heavy metal contamination can be found in a variety of industrial processes such as etching, electrolysis deposition,7,8 milling, electroplating and anodizing-cleaning9 and these metal ions cannot be degraded into harmless end products.10 Therefore, treatment technologies for the removal of heavy metals from industrial waste water and other effluents have received much attention.11–15The conventional methods for removing heavy metals from waste water include adsorption, chemical precipitation,16 electrochemical deposition, flotation and ion exchange.7,8,17–22 Among these processes, chemical precipitation is presently the most favored for the removal of inorganic heavy metals from effluent waste, due to its simple operation and inexpensive assembly.16 However, it has a major drawback as it produces large volumes of sludge, which requires secondary treatment.23 An alternative is membrane filtration, but unfortunately this technology has always been plagued with fouling problem.24,25 Likewise, ion exchange and electro-winning technologies show limitations in the availability of stable exchanger resins and corrosion of the electrodes.26 Conventional electro-winning also become uneconomical for Pb2+ concentrations below a few 100 ppm, which is still well above environmentally acceptable levels for discharge.
According to the water quality standard, the lead content must below 5 ppm for discharge of industrial waste into public sewers. As a comparison, the common chemical treatment, like adsorption by different natural materials, is inefficient with the increase of Pb2+ concentration in inlet.27 The CDI technique is on the one hand providing a much wider process range for one desired target.28 Hence, in recent years, a series of capacitive based desalination techniques, such as simple CDI, MCDI and FCDI has been considered.29–33 However, fouling of the membrane by carbonates in the MCDI is still a concern and the membrane is usually expensive. Whereas to maintain a continuous and stable FCDI system requires high economical support. Therefore, as a comparison, a simple CDI is still more facile and economical than the more advanced methods.
CDI works by electrosorption to remove desired ions from the target solution. The voltage that can be applied in a CDI system is limited by the electrolysis of water, fortunately this is kinetically slow on carbon electrodes so the electrochemical window is approximately 2 V wide; in neutral solutions it is from −1.072 V to +0.985 V vs. SCE (Sat'd KCl).34 As a result, CDI has been used to the removal of a number of heavy metals including, cadmium (Cd2+), chromium (Cr3+), copper (Cu2+), arsenic (As3+) and nickel (Ni2+).35 Among these investigations, Pb2+ has also been studied either as the target or the competitive ions.
So far, a large number of reports have focused on the development of different electrode materials, such as carbon nanotubes, graphitic carbon nanosheets, and especially graphene and its derivatives. Even though graphene based electrodes exhibit the highest removal efficiency on multi-ions including Pb2+, the complex oxidization process of graphene means it is difficult to keep a complete structure and defects which cause severe agglomeration. Besides the required chemicals for graphene oxide reduction are harsh, which may increase safety, economic and environmental costs.36–40 Therefore, activated carbon is still the most economical choice. However, currently, the most reported works based on various forms of activated carbon (activated carbon cloth, activated carbon fiber, activated carbon powder) for Pb2+ removal have focused on the adsorption mechanism and the pH value impact of the solution41–43 and neglected the possible impact from the dissolved O2 and CO2, which are reflected by pH fluctuations during charge/discharge process in real time. Therefore, in this work, a systematic investigation has been designed under the consideration of the presence of CO2 in the industrial water.
The lead removal reaction on electrode in a CDI cell is theoretically analogous with Pb flow battery shown below:44
Negative electrode reaction: E0 = −0.13 V vs. SHE
| Pb2+ + 2e− ↔ Pb | (1) |
Positive electrode reaction: E0 = 1.46 V vs. SHE
| Pb2+ + 2H2O ↔ PbO2 + 4H+ + 2e− | (2) |
Corresponding to charge/discharge process, Pb2+/Pb–Pb2+/PbO2 should be responsible for the removal of Pb2+. However, when used for removal of Pb2+ from industrial waste water a layer of lead carbonates is formed on the electrodes. In order to unearth the source resulting in the observed precipitation, contrast experiments that expelling CO2 out from the solution have been designed and analyzed. Note that the potential for reaction (2) will shift negative by 118 mV for every increase in pH unit, which reaction (1) is independent of pH.
The investigations are focused on the removal of lead ions (Pb2+) from artificial waste water by using CDI method, including discussions on electroplating as well. The whole process was monitored in real time by both a conductivity meter and a pH meter. Actual lead concentrations were determined ex situ by Inductively Couple Plasma-Optical Emission Spectrometry, ICP-OES. Other characterizations methods used include SEM, XRD, XPS and Raman spectrum have been adopted as well for proposing reasonable mechanisms. According to the study (i) the removal efficiency of Pb2+ can achieve a maxima at 98%; (ii) a relative lower pH value of the initial waste water is beneficial for the collection of lead during discharge process; (iii) without N2 purge before the cell operation, CO2 in waste water will lead to the formation of hydrocerussite or cerussite compound during the cyclic charge/discharge process.
Experiment
A piece of graphite sheet with dimension of 2 mm × 120 mm × 170 mm was fixed on a PVC plate by using polyimide tape. Next, placing a beaker with 120 ml dimethylformamide (DMF) (Sigma-Aldrich, anhydrous, 98%) solution on a hotplate which is set at 80 °C for 30 min. After 30 min heating, 1.5 g polyvinylidene fluoride (PVDF) (average Mw ∼ 534![[thin space (1/6-em)]](https://www.rsc.org/images/entities/char_2009.gif) 000 by GPC, Sigma-Aldrich) was dissolved into above solution under a continuous heating and stirring for another 30 min. Then 15 g activated charcoal powder (reagent grade, Scharlau) was added with the heating/stirring at 80 °C being maintained for a further 30 min to have this activated charcoal (AC) paste be ready for later use.
000 by GPC, Sigma-Aldrich) was dissolved into above solution under a continuous heating and stirring for another 30 min. Then 15 g activated charcoal powder (reagent grade, Scharlau) was added with the heating/stirring at 80 °C being maintained for a further 30 min to have this activated charcoal (AC) paste be ready for later use.
After cooling, 20 ml of above prepared AC paste was spread onto a piece of graphite sheet with an area of 10 cm × 15 cm. The thickness of the paste was controlled by two layers of the polyimide tape. After one hour at ambient temperature, the fabricated AC electrode was placed into an electric furnace set at 70 °C and left overnight to ensure the full evaporation of DMF. Finally, the AC electrode was kept in deionized water until use. The fresh AC electrodes are used in each experiment.
Fig. 1 shows a schematic construction of the CDI integrated electroplating cell (CDIE) construction. This cell contained two symmetric electrodes of activated carbon (AC) separated by a nylon mesh, the hole size of which is 1 mm × 1 mm and the thickness is 0.2 mm, and sandwiched between two pieces of polymethyl methacrylate (PMMA) with a thickness of 10 cm that were bolted together. Electrical connection to the AC electrodes were made by press contacts to two graphite strips (1.5 cm × 2 cm × 0.2 cm) that protruded from the cell. The effective geometric surface area of each AC electrode exposed to the solution was 150 cm2.
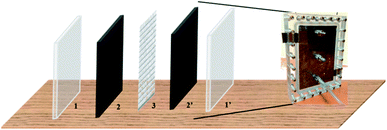 | ||
| Fig. 1 Schematic diagram of a CDI cell (1 for one of the PMMA plate; 1′ for another PMMA plate; 2 and 2′ for symmetric AC electrodes; 3 for nylon mesh). | ||
The pseudo Pb2+ waste streams (typically 100 ppm) were prepared by dissolving Pb(NO3)2 (Sigma-Aldrich, ACS reagent, ≥99%) into Milli-Q water (resistivity ∼ 10 MΩ cm) without any other chemical addition. To explore the effect of different pH conditions on the removal of Pb2+, concentrated HNO3 (Merck, ACS reagent, 63–67%) was at times used for adjusting the initial pH of the solution. The solution was pumped through the cell, by a peristatic pump (Watson-Marlow), with the total volume of solution being approximately 60 ml of which about 20 ml was within the cell at any one time. The conductivity (Hanheng Instruments DDSJ-308F meter) and pH (Hanna Instruments meter) of the pseudo waste stream solution were both recorded in real time. The voltage across the two AC electrodes is provided by a Versa STAT 4.0 (Princeton Applied Research), which was set to either 1.0 V, 1.3 V or 1.5 V for 30 min followed by alternating to 0 V for a further 30 min to complete a single cycle.
In order to obtain more accurate Pb2+ concentration changes than can be provided from conductivity measurements, 600 μl aliquots were removed at set intervals, diluted by a factor of ten and used for ex situ analysis via ICP-OES. At the end of experimental runs any deposits remaining on the AC electrodes were analyzed by a Field Emission Scanning Electron Microscopes, FESEM (Zeiss Supra 40 at an accelerating voltage of 10 kV) equipped with an energy-dispersive X-ray spectroscopy, EDS, attachment, X-ray diffraction, XRD (Brucker D8 Advance in the Bragg–Brentano theta–two-theta mode) X-ray photoelectron spectroscopy, XPS (Brand:Kratos Analytical; model: Axis Ultra DLD) and a LabRam HR Evolution Raman microscope with an argon-ion laser at 514 nm.
Results and discussions
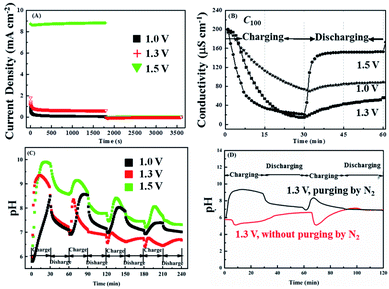
Fig. 2A shows the influence of applied voltage on the cells ability to remove lead from 100 ppm Pb2+ solutions (C100). A series of chronoamperometry curves collected by applying different voltage of 1.0 V, 1.3 V and 1.5 V respectively and switching to zero volt (i.e. short-circuit conditions) after 30 min. The solution flow rate is 2.3 ml min−1 g−1 (the schematic statement on the calculation of flow rate is in Fig. S1†). The corresponding solution conductivity changes are shown in Fig. 2B, from which it can be seen that the conductivity initially decreases more rapidly as the voltage is increased eventually falling by 63.5%, 92.5% and 89.5% after 30 min at 1.0 V, 1.3 V and 1.5 V, respectively. Note that during the 0 V period the conductivity rises, due to the release of Pb2+ ions captured during the on period, but the recovery is not 100%, being about 78% at 1.5 V and less for the other voltages. In addition, the higher current density under 1.5 V in Fig. 2A also explains the conductivity changes in Fig. 2B, which at 1.5 V is dominated by water splitting.Fig. 2C shows how the pH of C100 solution varies over the first 5 voltage cycles. During the first application of 1.3 V, the pH continuously increased with time rising from pH 5.95 to pH 9.35. This was somewhat unexpected, as reactions (1) and (2) show that the charging of a lead-based battery should cause the pH to fall. A possible explanation for this is that Pb2+ removal at the negative electrode (reaction (1)) is less efficient than at the positive electrode (reaction (2)), with competing cathodic reactions being the reduction of either dissolved oxygen or protons both of which cause the local pH to rise:
| O2 + 2H2O + 4e− → 4OH−, E = 1.23 V vs. SHE | (3) |
| H+ + 2e− → H2, E = 0.00 V vs. SHE | (4) |
Note that the reduction of nitrate ions is also thermodynamically possible, but this process is inefficient and requires large overpotentials. Fig. 2D shows that using nitrogen purging to remove the dissolved oxygen leads to anticipated decrease in pH on charging, indicating the majority of the previously observed increase in pH was due to the reduction of dissolved oxygen. It is interesting to note that the negative swing in the pH is more pronounced during the second charging cycle, possibly suggesting that reaction (1) has become more efficient. A possible explanation for this is that Pb deposition has been reported to require a nucleation overpotential,45 meaning that it requires a larger potential to nuclear the first Pb crystals on the carbon electrode but once imitated subsequent deposition of Pb onto Pb is more efficient. Therefore, if not all the Pb deposited in the first cycle was released back into the solution during the discharge cycle, the residual Pb on the carbon cathode is available to act as nucleation sites during the subsequent charging cycles.
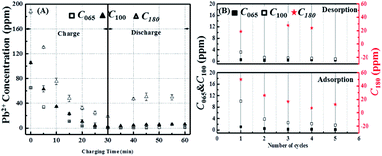
Although pH variations certainly influence conductivity readings, over the range recorded (pH 5.95 to pH 9.35) protons and hydroxide ions will contribute less than 2 μS cm−1 (with a minimum at about pH 7.2) to the overall conductivity of the solution.46 Nevertheless, changes in conductivity are not a good measure of changes in Pb2+ concentration, as when the pH changes this may influence the degree of hydration or complexation. Therefore, Fig. 3A shows lead concentrations, Cx, determined by ICP-OES, with the applied voltage being indicated in the subscript. It can be seen that the removal efficiencies (Fig. 3B) after 30 min are 82.3%, 98.0% and 91.1% for 1.0 V, 1.3 V and 1.5 V, respectively, which are in reasonable agreement with the conductivity changes (Fig. 2B) with the lowest Pb2+ concentration recorded being 1 ppm.
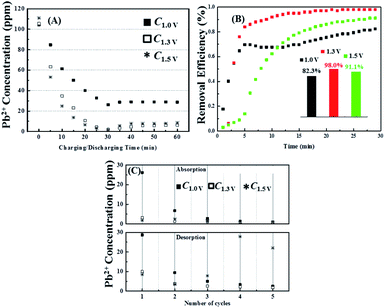 | ||
| Fig. 3 (A) Acctual concentration change of Pb2+ corresponding to the chronoamperometry condition in Fig. 2A; (B) the calculated removal efficiency of Pb2+ respecting to ICP-OES result in (A); (C) cyclic performance of the concentration change of Pb2+ within five cycles of charge/discharge process (each cycle includes exposing the fresh pair of AC electrode to the charge voltage for 30 min, followed by to the discharge voltage (0 V) for another 30 min). | ||
However, during the discharge period there is considerable disagreement between the conductivity and ICP-OES data, with the latter showing only very small increases of Pb2+ concentrations (by about 5 ppm) is at all three voltages (Fig. 3C), in contrast to the up to 78% recovery suggested by the conductivity measurements. It is thus clear that the at least one of the AC electrodes does not readily release the lead from its surface during the discharge stage. However, after the second voltage cycle the amounts of lead further extracted and subsequently release becomes reversible (Fig. 3C). The lower reversibility, as compared with >90% reversibility of sodium chloride described in the literature47 and found when NaCl was used in the present cell (see Fig. S2†) reveals that the removal of lead ions in this system is not only realized by just adsorption in the electrical double layer but also involvement of other electrochemical processes; that is reactions (1) and (2).
Finally, examination of Fig. 3A–C reveals that despite the much higher current density recorded at 1.5 V, virtually the same amount of Pb2+ was removed as seen at 1.3 V This indicates that most of the additional current at the higher voltage is being lost to water splitting rather than ion removal. Therefore 1.3 V was chosen for future experiments.
To further elucidate the possible mechanism on Pb2+ removal based on above phenomenon observation, the corresponding electrochemical characterization method has been conducted. Fig. 4 shows potential versus time profile of the negative electrode recorded when 1.3 V was applied across the two carbon based electrodes. It can be seen that this electrode adopted a potential close to −0.45 V vs. SCE (−0.16 V vs. SHE), which is consistent with the electrodeposition of Pb shown in reaction (1). The observation that the potential of the negative electrode slowly shifts negatively with time, which is consistent with a decrease in Pb2+ ion concentration (Nernst equation) and also suggests that the rate of this reaction is likely limited by mass transport of Pb2+ ions to the electrode's surface. Although the potential of the positive electrode was not measured directly, it can easily be calculated by adding 1.3 V to the potential of the negative electrode; i.e. it will have adopted a potential around +0.90 V vs. SCE (+1.14 V vs. SHE). There are two possible anodic reaction that can occur at this potential, oxygen evolution and deposition of PbO2 (reaction (2)), which at pH 7 are expected to occur at about +0.57 V vs. SCE (+0.81 V vs. SHE) and +0.39 V vs. SCE (+0.63 V vs. SHE), respectively.
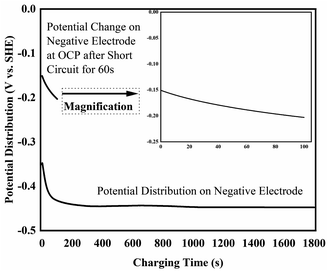 | ||
| Fig. 4 Potential versus time profile of the negative electrode recorded when 1.3 V across the cell and the corresponding OCP after short circuit for 60 s. | ||
Furthermore, after charging the cell was switched to open-circuit conditions and the voltage across the two carbon electrode was measured to be 0.86 V, which is consistent with the approximately 0.80 V one would expected to find between a Pb and PbO2 electrode at pH 7 and confirms that during charging reactions (1) and (2) occur on the negative and positive electrodes respectively. After short-circuiting the voltage for about 60 s the open-circuit voltage across the two carbon electrodes declined to 0.21 V, consistent with discharging of a Pb/PbO2 battery.
Finally, reference to the Pourbaix diagram for Pb indicates that if the pH rises above pH 9,48 the Pb2+ ions are likely to precipitate out of solution in the form of PbO will form. This could also partly explain the poor reversibility of the system during the first cycle, as Fig. 2C shows that this caused the bulk solution to exceed pH 9.
Cyclic voltammetry was also conducted, but the high resistance of the 100 ppm Pb2+ solution meant this were of little value with no clear redox peaks being observable. However, after the addition of 0.1 M NaCl as a supporting electrolyte, redox couples that were consistent with reactions (1) and (2) along with water splitting were obtained (Fig. S3†).
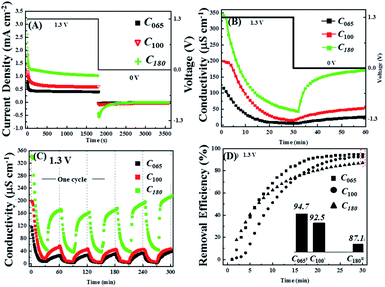
Next the influence of the initial lead concentration was investigated, for which the notation Cy was adopted where the subscript refers to the initial Pb2+ concentration in ppm that was varied from 65 ppm to 180 ppm. Fig. 5A and B show chronoamperometry and conductivity measurements for the application of 1.3 V across the cell and a flow rate of 2.3 ml min−1 g−1. It is clear that the current density increases with increasing Pb2+ concentration leading to a more rapid decrease in conductivity confirming that at 1.3 V this extra charge is used to remove more ions not for water splitting.
Fig. 5B also shows that once the voltage is switched to 0.0 V the reversibility increases with initial lead concentration, although it never reaches 100%, suggesting that there is a limit to the amount of non-removable lead that is deposited onto AC electrodes. This hypothesis is supported by subsequent voltage cycles where, unlike the first cycle, the conductivity changes are nearly reversible for all three initial lead concentrations (Fig. 5C). Indeed, the conductivity reversibility of C180 appears to slightly increase at high cycle numbers. The discharge curves also suggest that most of the lead that is available for release is so in a relatively short period of time (∼10 min) compared to that required to reach near steady-state conditions during the charging period.
However, Fig. 5D shows that although the initial rate of Pb2+ removal increases with increasing starting concentration, the long-term efficiency of the process shows the opposite trend, indicating that there is a limit to the total amount of lead that can be removed by AC electrodes in a single voltage cycle that is in addition to the minimum concentration that can ultimately be reached by the system.
To confirm the conclusions about the influence of initial Pb2+ concentration drawn from the real time conductivity measurements, ex situ ICP-OES measurements were again preformed. According to the ICP-OES results, the Pb2+ removal and reversal concentrations actually show steady-state behaviour within five cycles of circulation, therefore based on this consideration we have run five cycles with 1.3 V for the charging cycle. Fig. 6A and B show that during charging the ICP-OES is in reasonable agreement with the conductivity measurements, with the final efficiency of the Pb2+ removal being inversely proportional to its initial concentration with values 99.3%, 98% and 90% for C065, C100 and C180 respectively, which corresponds to final concentrations at the end of the 30 min test of about 0.5 ppm, 2 ppm and 18 ppm.
Fig. 6A also confirms that the reversibility of the process increases with increasing initial lead content, however the extent of the Pb2+ released is much lower than would be anticipated from the conductivity measurements being only about 18% even at the highest lead level tested. Nevertheless, the ICP-OES data in Fig. 6B again revels that the process is far more reversible after the first cycle, which is in agreement with the conductivity measurements.
To summarize, under the investigated conditions, the developed CDI system shows good performance on removing Pb2+ ions as compared to a range from 53.4% to 81% in previous reports.6,49 However, the ions are not fully released in the discharge process, especially during the first cycle. Therefore, in order to improve the release of Pb2+ ions a more acidic pseudo waste is tested using 63% HNO3 to adjust solution with 100 ppm Pb2+ from pH ∼ 5.5 to pH 2.0; labeled as C100/pH2.
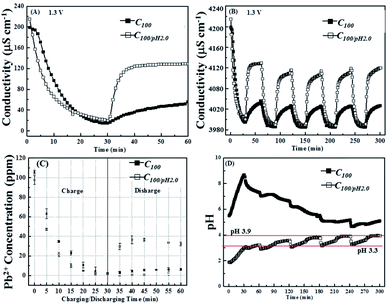
Fig. 7A shows a comparison of the conductivity changes recorded in solutions with and without HNO3 additions. It is clear that the acidic system is more reversible, recovering over 50% of its original conductivity during the discharge period as opposed to only about 10% in the control solution. Fig. 7B shows that this improved reversibility is maintained over the subsequent voltage cycles. Fig. 6C shows the corresponding ex situ ICP-OES data from which it can be seen that the acidic conditions increase the rate at which the Pb2+ ions are removed and confirms the improved reversibility, although still only 40% of the original lead ions are released during the first cycle this is seven times higher than in the control. Fig. 7C also reveals that all the ions available for release are desorbed quickly, within the first 10 min of the switch from 1.3 V to 0 V.
Fig. 7D shows that the pH of the acidified pseudo waste solution increased during both charging and discharging cycles. From the onset of the third cycle, the pH changes adopt a continuous pattern: falling rapidly to pH 3.0 after the application of 0.0 V, then rising continuously through the remaining discharge period to about pH 3.3, then once the 1.3 V charging voltage is applied there is an initial rapid increase increases up to pH 3.9, but after this it remains steady for the rest of the cycle. However, due to the logarithm nature of pH even a swing between pH 3.3 to pH 3.9 would represent a decrease in the conductivity contribution from protons from about 200 to 30 μS cm−1, which clearly shows the importance of the ICP-OES measurements to support any findings based on conductivity measurements.
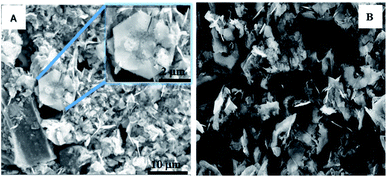
To further determine the nature of the products that were formed on electrode surface, SEM and EDS technique has been adopted. The detected precipitation on anode and cathode is shown in Fig. 8, hexagonal crystals were found on the surfaces of both the cathode and the anode. Based on EDS (Fig. S4†) result, it revealed that the crystals consisted of lead, oxygen and possibly carbon; the ubiquitous nature of carbon makes it difficult to determine by EDS. Even so, visibly the crystals looked like a white powder suggesting 2PbCO3·Pb(OH)2 (known as white lead) as opposed to PbO2 (black), PbO (yellowish) or Pb3O4 (red).
To verify this compound, X-ray diffraction (XRD) scanning has been adopted. In Fig. 9A, the major peaks in the XRD pattern taken from the cathode can be matched to hydrocerussite (Pb3(CO3)2(OH)2), which has a hexagonal structure as observed under the SEM, and the remaining smaller peaks can be matched to either cerussite (Pb2CO3) or graphite, with no peaks that could be attributed to either PbO, Pb3O4 or PbO2. The Raman spectrum in Fig. 9B is similar to that reported in the literature and is considered to be 2PbCO3·Pb(OH)2.50
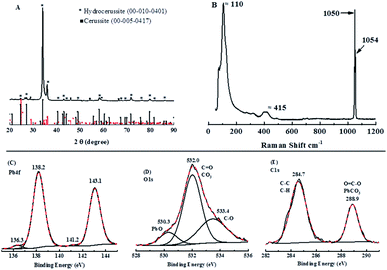 | ||
| Fig. 9 (A) XRD (X-ray diffractometry) patterns; (B) the Raman spectrum and XPS (X-ray photoelectron spectroscopy) spectra of Pb 4f (C), O 1s (D) and C 1s (E) for the cathode in Fig. 8A. | ||
To make a further agreement, XPS analysis was conducted. As can be seen in Fig. 9C, a strong pair of peaks at 138.2 eV and 143.1 eV with a confined area ratio of 3![[thin space (1/6-em)]](https://www.rsc.org/images/entities/char_2009.gif) :
:![[thin space (1/6-em)]](https://www.rsc.org/images/entities/char_2009.gif) 4 (Pb 4f5/2
4 (Pb 4f5/2![[thin space (1/6-em)]](https://www.rsc.org/images/entities/char_2009.gif) :
:![[thin space (1/6-em)]](https://www.rsc.org/images/entities/char_2009.gif) Pb 4f7/2), which is consistent with hydrocerussite as are the deconvoluted C 1s and O 1s peaks (Fig. 9D and E).51–54 However, the Pb 4f spectrum also shows a second, much weak, pair of peaks centered at 136.3 eV and 141.2 eV, which can be attributed to metallic lead from the reduction of Pb2+ during the charging process and not re-oxidized during the discharge process.55,56 Therefore, based on characterization measurements, hydrocerussite is formed on the cathode during charging and this cannot be redissolved completely during the discharging process.
Pb 4f7/2), which is consistent with hydrocerussite as are the deconvoluted C 1s and O 1s peaks (Fig. 9D and E).51–54 However, the Pb 4f spectrum also shows a second, much weak, pair of peaks centered at 136.3 eV and 141.2 eV, which can be attributed to metallic lead from the reduction of Pb2+ during the charging process and not re-oxidized during the discharge process.55,56 Therefore, based on characterization measurements, hydrocerussite is formed on the cathode during charging and this cannot be redissolved completely during the discharging process.
According to above analysis, it is proposed that during charging the local rise in pH in the vicinity of the cathode due to reaction (3) and (4), along with atmospheric CO2 causes the precipitation of the hydroxycarbonate to occur:49
| 3Pb2+ + 2CO32− + 2OH− → Pb3(CO3)2(OH)2 | (5) |
Following a mechanism similar to the cathodic electrodeposition previously reported for formation of hydroxyapatite films on titanium substrates.57 Once form, the Pb3(CO3)2(OH)2 does not redissolve as the pH rises during the discharging process. The amount of CO2 dissolved in water exposed to air is about 0.5 ppm (11 μM), which according to eqn (5) would be sufficient to remove 3.5 ppm (16.5 μM) of Pb2+ ions.
As for the traces of metallic lead found on the cathode by the XPS, this is consistent with the notion that not all the Pb deposited in the first charging cycle is released during discharging. This is actually beneficial as removes the need for a nucleation overpotential, making reaction (1) more efficient in subsequent charging cycles, such that it competes better with the reactions (3) and (4) and the extent of the pH increase in the vicinity of the cathode is reduced negating reaction (5). That is the overall Pb2+ ion removal process becomes more efficient after the first cycle.
Finally, the system's ability to handle interfering ions was tested by treating artificial industrial wastewater containing Na+, Pb2+, Cu2+ and Ni2+ ions (Fig. S5†). It was found that Na+, Cu2+ and Ni2+ ions had an insignificant effect on the Pb2+ removal rate, with no effect on the reversibility of the process (see ESI†). Furthermore, 50% of the Na+ ions (0.01 M Na+) could be removed in a process that was 100% reversible, which provides a new angle on desalination applications for the system.
Conclusions
A capacitive deionization cell designed with symmetric activated carbon electrodes was demonstrated to be able to successfully reduce dilute (<200 ppm) wastewater Pb2+ concentrations to below the 5 ppm statuary limited for discharge into public sewers. A high Pb2+ removal efficiency of 98.1% within 30 min was realized under an optimized cell voltage of 1.3 V, which compares favorably with previous reports of 54% to 81%. Although the reversibly of the process was poor during the first charge/discharge cycle, but subsequent cycles showed good reversibility. Characterization of deposits on the electrodes reveal that the poor reversibility during the first cycle was partly due to cathodic electrodeposition of lead hydroxycarbonates, a process that was reduced by acidification of the electrolyte allowing the first cycle reversibility to reach 40%. However, trace amounts of metallic Pb were also found on the discharged cathodes, indicating the formation of the carbonates was not the only cause of the lack of reversibility. Nevertheless, traces of residual metallic lead on the cathode are likely beneficial as it reduces the nucleation overpotential for Pb deposition in subsequent cycles. Finally, it was demonstrated that Na+ ions do not interfere with either the removal rate of Pb2+ ions or the reversibility of this process.Author contributions
Yang G. carried out the experiment and wrote the manuscript. D. J. Blackwood helped the idea expression and article revision. Also supervised the whole project.Conflicts of interest
There are no conflicts to declare.Acknowledgements
This work is supported by Key Laboratory of Hubei Province for Coal Conversion and New Carbon Materials, School of Chemistry and Chemical Engineering, Wuhan University of Science and Technology, P. R. China, under project No. 1050010; Singapore National 523 Research Foundation under its Environmental & Water 524 Research Programme (Project Ref No. 1301-IRIS-33) and 525 administered by PUB, Singapore’s National Water Agency.Notes and references
- L. Jarup, Br. Med. Bull., 2003, 68, 167 CrossRef PubMed.
- P. Scheeren, R. Koh, C. Buisman, L. Barnes and J. Versteegh, New biological treatment plant for heavy metal contaminated groundwater, in: EMC'91: Non-Ferrous Metallurgy-Present and Future, Springer, Springer Netherland, 1991, p. 403 Search PubMed.
- E. A. Badr, A. A. Agrama and S. A. Badr, Nutr. Food Sci., 2011, 41, 210 CrossRef.
- A. Oehmen, R. Viegas, S. Velizarov, M. A. Reis and J. G. Crespo, Desalination, 2006, 199, 405 CrossRef CAS.
- S. Cheng, W. Grosse, F. Karrenbrock and M. Thoennessen, Ecol. Eng., 2002, 18, 317 CrossRef.
- Z. Huang, L. Lu, Z. X. Cai and Z. Y. J. Ren, J. Hazard. Mater., 2016, 302, 323 CrossRef CAS PubMed.
- H. Y. Shim, K. S. Lee, D. S. Lee, D. S. Jeon, M. S. Park, J. S. Shin, Y. K. Lee, J. W. Goo, S. B. Kim and D. Y. Chung, J. Agric. Chem. Environ., 2014, 3, 130 Search PubMed.
- M. Y. A. Mollah, R. Sschennach, J. R. Parga and D. L. Cocke, J. Hazard. Mater., 2001, 84, 29 CrossRef CAS.
- M. A. Barakat, Arabian J. Chem., 2011, 4, 361 CrossRef CAS.
- L. Sorme and R. Lagerkvist, Sci. Total Environ., 2002, 298, 131 CrossRef CAS PubMed.
- B. M. Jun and N. Her, Environ. Sci.: Water Res. Technol., 2020, 6, 173 RSC.
- S. I. Abu-Eishah, Appl. Clay Sci., 2008, 42, 201 CrossRef CAS.
- S. S. Ahluwalia and D. Goyal, Bioresour. Technol., 2006, 98, 2243 CrossRef PubMed.
- A. Aklil, M. Mouflihb and S. Sebti, J. Hazard. Mater., 2004, 112, 183 CrossRef CAS PubMed.
- J. Alinnor, Fuel, 2007, 86, 853 CrossRef.
- Y. Ku and I. L. Jung, Water Res., 2001, 35, 135 CrossRef CAS PubMed.
- E. Lopez-Maldonado, M. T. Oropeza-Guzman, J. L. Jurado-Baizaval and A. Ochoa-Teran, J. Hazard. Mater., 2014, 279, 1 CrossRef CAS PubMed.
- L. D. Benefield, J. F. Judkins and B. L. Weand, Process chemistry for water and wastewater treatment, Prentice Hall Inc., 1982, p. 312 Search PubMed.
- T. Tripathy and B. R. De, J. Phys. Sci., 2006, 10, 93 Search PubMed.
- H. A. Aziz, M. N. Adlan and K. S. Ariffin, Bioresour. Technol., 2008, 99, 1578 CrossRef CAS PubMed.
- N. Dizge, B. Keskinler and H. Barlas, J. Hazard. Mater., 2009, 167, 915 CrossRef CAS PubMed.
- O. Hamdaoui, J. Hazard. Mater., 2009, 161, 737 CrossRef CAS PubMed.
- F. Fu and Q. Wang, J. Environ. Manage., 2011, 92, 407 CrossRef CAS PubMed.
- S. Petrov and V. Nenov, Desalination, 2004, 162, 201 CrossRef CAS.
- K. Trivunac and S. Stevanovic, Chemosphere, 2006, 64, 486 CrossRef CAS PubMed.
- T. A. Kurniawan, G. Y. S. Chan, W. H. Lo and S. Babel, Chem. Eng. J., 2006, 118, 83 CrossRef CAS.
- F. L. Fu and Q. Wang, J. Environ. Manage., 2011, 92, 407 CrossRef CAS PubMed.
- A. J. Bard and L. R. Faulkner, Electrochemical Methods, John Wiley & Sons, New York, 1980 Search PubMed.
- Y. Oren, Desalination, 2008, 228, 10 CrossRef CAS.
- C. Forrestal, P. Xu and Z. Ren, Energy Environ. Sci., 2012, 5, 7161 RSC.
- Y. Oren and A. Soffer, J. Electrochem. Soc., 1978, 125, 869 CrossRef CAS.
- J. G. Gamaethiralalage, K. Singh, S. Sahin, J. Yoon, M. Elimelech, M. E. Suss, P. Liang, P. M. Biesheuvel, R. L. Zornitta and L. C. P. M. de Smet, Energy Environ. Sci., 2021, 14, 1095 RSC.
- C. Y. Zhang, J. X. Ma, L. Wu, J. Y. Sun, L. Wang, T. Y. Li and T. D. Waite, Environ. Sci. Technol., 2021, https://pubs.acs.org/toc/esthag/0/0 Search PubMed.
- S. Porada, R. Zhao, A. Van Der Wal, V. Presser and P. Biesheuvel, Prog. Mater. Sci., 2013, 58, 1388 CrossRef CAS.
- T. Alfredy, Y. A. C. Jande and T. Pogrebnaya, J. Water Reuse Desalin., 2019, 9, 282 CrossRef CAS.
- P. Liu, T. Yan, J. Zhang, L. Shi and D. Zhang, J. Mater. Chem. A, 2017, 5, 14748 RSC.
- Q. Ji, C. Hu, H. Liu and J. Qu, Chem. Eng. J., 2018, 350, 608 CrossRef CAS.
- Y. Wei, L. Xu, Y. Tao, C. Yao, H. Xue and Y. Kong, Ind. Eng. Chem. Res., 2016, 55, 1912 CrossRef CAS.
- Z. Sui, Q. Meng, X. Zhang, R. Ma and B. Cao, J. Mater. Chem., 2012, 22, 8767 RSC.
- L. Liu, X. Guo, R. Tallon, X. Huang and J. Chen, Chem. Commun., 2017, 53, 881 RSC.
- Z. Huang, L. Lu, Z. Cai and Z. J. Ren, J. Hazard. Mater., 2016, 302, 323 CrossRef CAS PubMed.
- M. Ziati and S. Hazourli, Microchem. J., 2019, 146, 164 CrossRef CAS.
- Y. Wei, W. Zhao, L. Xu, X. Jiang, W. Yao and Z. Shi, Oxid. Commun., 2018, 41, 296 Search PubMed.
- R. G. A. Wills, J. Collins, D. Stratton-Campbell, C. T. J. Low, D. Pletcher and F. C. Walsh, J. Appl. Electrochem., 2010, 40, 955 CrossRef CAS.
- D. Pletcher, R. Greef, R. Peat, L. M. Peter and J. Robinson, Instrumental Methods in Electrochemistry, Horwood Publishing, Limited, England, 1985, pp. 210–212 Search PubMed.
- J. O'Brien, Theoretical conductivity as a function of pH, DOE Fundamentals Handbook-Chemistry, 2014, vol. 2, p. 20 Search PubMed.
- M. E. Suss, S. Porada, X. Sun, P. M. Biesheuvel, J. Yoon and V. Presser, Energy Environ. Sci., 2015, 8, 2296 RSC.
- M. Pourbaix, Atlas of Electrochemical Equilibria in Aqueous Solutions, NACE International Cebeicor, 1974 Search PubMed.
- L. F. Yang, Z. Shi and W. H. Yang, Surf. Coat. Technol., 2014, 251, 122 CrossRef CAS.
- L. Burgio, R. J. H. Clark and S. Firth, Analyst, 2001, 126, 222 RSC.
- F. Garbassi and A. M. Marabini, J. Chem. Soc., Faraday Trans. 1, 1986, 82, 2043 RSC.
- H. Nohira, W. Tsai, W. Besling, E. Young, J. Petry, T. Conard, W. Vandervorst, S. D. Gendt, M. Heyns, J. Maes and M. Tuominen, J. Non-Cryst. Solids, 2002, 303, 83 CrossRef CAS.
- A. V. Shchukarev and D. V. Korolkov, Cent. Eur. J. Chem., 2004, 2, 347 CAS.
- L. Largitte, S. Gervelas, T. Tant and P. C. Dumesnil, Adsorption, 2014, 20, 689 CrossRef CAS.
- E. J. Kim and J. E. Herrera, Environ. Sci. Technol., 2010, 44, 6054 CrossRef CAS PubMed.
- L. R. Pedersen, J. Electron Spectrosc. Relat. Phenom., 1982, 28, 203 CrossRef.
- D. J. Blackwood and K. H. W. Seah, Mater. Sci. Eng., C, 2010, 30, 561 CrossRef CAS.
Footnote |
| † Electronic supplementary information (ESI) available. See DOI: 10.1039/d1ra01121a |
| This journal is © The Royal Society of Chemistry 2021 |

