 Open Access Article
Enhanced luminescence properties of Ca1+xSr2−xAl2O6:Eu3+ (0 ≤ x ≤ 1) red phosphors based on composition modulation†
Biao Shen,
Jianghang Xu,
Qinan Mao* and
Jiasong Zhong *
*
College of Materials and Environmental Engineering, Hangzhou Dianzi University, Hangzhou 310018, China. E-mail: maoqinan@hdu.edu.cn; jiasongzhong@hdu.edu.cn
First published on 6th April 2021
Abstract
A series of solid solution Ca1+xSr2−xAl2O6:Eu3+ (0 ≤ x ≤ 1) phosphors has been successfully synthesized via a high-temperature solid-state method. The phase structures, photoluminescence performances, and fluorescence lifetimes, as well as the thermal stability properties, have been systematically investigated. All of the samples possess a cubic structure system and belong to the Pa![[3 with combining macron]](https://www.rsc.org/images/entities/char_0033_0304.gif) (205) space-group. Owing to the 5D0 → 7F2 transition of the Eu3+ ions, the photoluminescence emission (PL) spectra demonstrate a strong red emission band at around 612 nm. As the Sr2+ ions have been substituted by Ca2+ ions in the CaSr2Al2O6:Eu3+ composition, the luminous intensities are gradually enhanced owing to the average bond lengths of Ca–O, Sr/Ca–O, and Sr–O, which are shorter. In addition, the PL intensities at 423 K for the CaSr2Al2O6:0.02Eu3+, Ca1.5Sr1.5Al2O6:0.02Eu3+, and Ca2SrAl2O6:0.02Eu3+ phosphors retain 84.5%, 76.1%, and 75.7% of their intensities, respectively, compared with their initial intensities at 303 K. The results demonstrate that high-performance Eu3+-activated red-emitting phosphors can be obtained via cation substitution.
(205) space-group. Owing to the 5D0 → 7F2 transition of the Eu3+ ions, the photoluminescence emission (PL) spectra demonstrate a strong red emission band at around 612 nm. As the Sr2+ ions have been substituted by Ca2+ ions in the CaSr2Al2O6:Eu3+ composition, the luminous intensities are gradually enhanced owing to the average bond lengths of Ca–O, Sr/Ca–O, and Sr–O, which are shorter. In addition, the PL intensities at 423 K for the CaSr2Al2O6:0.02Eu3+, Ca1.5Sr1.5Al2O6:0.02Eu3+, and Ca2SrAl2O6:0.02Eu3+ phosphors retain 84.5%, 76.1%, and 75.7% of their intensities, respectively, compared with their initial intensities at 303 K. The results demonstrate that high-performance Eu3+-activated red-emitting phosphors can be obtained via cation substitution.
1. Introduction
In the last few decades, white light-emitting diodes (WLEDs) have been widely studied, owing to their typical advantages such as long lifetime, high luminous efficiency, small volume, high brightness, being environmentally friendly and having an excellent stability, and they are considered as the fourth generation of all-solid-state green lighting sources.1–7 Currently, the most common way to fabricate commercial WLEDs is by combining a blue InGaN LED chip with a YAG:Ce3+ (Y3Al5O12:Ce3+) yellow-emitting phosphor.8–11 Nonetheless, owing to the deficiency of the red-emitting component, the devices have some disadvantages, such as a high correlated color temperature (CCT) and a poor color rendering index (CRI).12–14 Consequently, these WLEDs do not meet the requirements for indoor illuminations, which limit their further development as light sources in this field.15–17 Therefore, in order to improve the CCT and CRI, more and more well-performing red-emitting phosphors have been studied.18,19 However, compared with commercially available blue and green phosphors, many obvious shortcomings exist in red-emitting phosphors.8,17,20 For instance, M2Si5N8:Eu2+ (M = Ca, Sr and Ba) and Y2O2S:Eu3+ possess poor performances in terms of the chemical stability, luminescence efficiency and environmental protection (for example, the production of sulfide gas).20–22 Therefore, the development of a novel red-emitting phosphor at a low cost, that is non-polluting, has a superior stability, and satisfactory luminous efficiency is urgently needed to satisfy the requirements of warm WLEDs.14,19In order to obtain a well performing red phosphor for use in WLEDs, the host lattice is one of the important factors.23 In recent years, aluminate-based phosphors have been extensively used for their excellent properties, such as a good luminous efficiency, high CRI and wide excitation range.24–26 For example, Ce3+-doped Lu3Al5O12 yellow phosphor and Eu2+-doped SrAl2O4 green phosphor possess good luminescence performances.27,28 Furthermore, compounds containing the M3Al2O6 (M = Ca, Sr) structure have received significant attention owing to their particular crystal structure and excellent chemical stability.15,24,29 In particular, there are several kinds of cation sites in the crystal structure of M3Al2O6 with a low symmetry, which effectively enhance the intensity of the 5D0–7F2 transition.20 Additionally, the composition of the host structure can be adjusted by modifying the cations in the M site, and then improving the activator environment and luminescent properties.30 It is well known that the Eu3+ ion is one of the most efficient red luminescent rare-earth activators, which always emit a bright red light with a high luminous efficiency.12,14,31 In addition, the Eu3+ ions have two intense excitation peaks at approximately 393 nm (7F0–5L6) and 465 nm (7F0–5D2) in most host lattices, which are suitable for use in near-ultraviolet LED chips and blue LED chips.21,32 Moreover, the Eu3+ ions possess strong red emission peaks at approximately 590 nm and 615 nm originating from their 5D0–7Fi (i = 1, 2) transitions.3,33,34
In this work, a Eu3+-doped Ca1+xSr2−xAl2O6 (0 ≤ x ≤ 1) composite has been studied as a potential alternative to red-emitting phosphors. The luminous efficiency and thermal stability can be improved by adjusting the proportion of the Ca2+ and Sr2+ ions. In addition, Ca1+xSr2−xAl2O6 has a cubic structure with a Pa![[3 with combining macron]](https://www.rsc.org/images/entities/char_0033_0304.gif) (205) space-group, which provides a suitable environment for Eu3+ ions. Furthermore, the ionic radius of the Eu3+ ions (r = 0.947 Å, CN = 6) is similar to that of Ca2+ ions (r = 1.00 Å, CN = 6) and Sr2+ ions (r = 1.18 Å, CN = 6), indicating the significant possibility of using the Eu3+ ion to replace the Ca2+ and Sr2+ sites in the Ca1+xSr2−xAl2O6 host lattice. Hence, a series of Ca1+xSr2−xAl2O6(0 ≤ x ≤ 1) red phosphors have been synthesized using the solid-state reaction method. The crystal structures, morphologies and photoluminescence emission (PL) properties of the phosphor samples have been studied in detail. In addition, the concentration quenching and thermal stability have also been investigated.
(205) space-group, which provides a suitable environment for Eu3+ ions. Furthermore, the ionic radius of the Eu3+ ions (r = 0.947 Å, CN = 6) is similar to that of Ca2+ ions (r = 1.00 Å, CN = 6) and Sr2+ ions (r = 1.18 Å, CN = 6), indicating the significant possibility of using the Eu3+ ion to replace the Ca2+ and Sr2+ sites in the Ca1+xSr2−xAl2O6 host lattice. Hence, a series of Ca1+xSr2−xAl2O6(0 ≤ x ≤ 1) red phosphors have been synthesized using the solid-state reaction method. The crystal structures, morphologies and photoluminescence emission (PL) properties of the phosphor samples have been studied in detail. In addition, the concentration quenching and thermal stability have also been investigated.
2. Experimental section
2.1 Preparation of the samples
A series of CaSr2Al2O6:yEu3+ (y = 0.005, 0.01, 0.02, 0.03, 0.04, 0.05 and 0.10) and Ca1+xSr2−xAl2O6:0.02Eu3+ (x = 0, 0.2, 0.4, 0.6, 0.8 and 1.0) phosphors were successfully synthesized using a high-temperature solid-state method. CaCO3 (99.99%), SrCO3 (99.99%), Al2O3 (99.99%) and Eu2O3 (99.99%) were used as raw materials. First, these starting materials were weighed according to the stoichiometric ratio, and then mixed uniformly, and ground thoroughly for 30 min. After that, the compounds were placed into alumina crucibles and pre-sintered at 800 °C for 6 h in air. The phosphor samples were then reground for 20 min and calcined at 1250 °C for 5 h. Finally, the resulting powder samples were naturally cooled to room temperature in the furnace and ground again for further characterization.2.2 Characterization
The phase purity information of the samples was characterized on a MiniFlex 600 X-ray diffractometer using Cu Kα (λ = 1.5405 Å) radiation. Scanning steps of 1° min−1 were used when scanning the 2θ range from 10° to 80°. The crystal structure parameters were further analyzed and refined via the Rietveld method using the software program General Structure Analysis System (GSAS). The morphology was detected using scanning electron microscopy (SEM, FEI Apreo HiVac). The element compositions were studied using energy dispersive X-ray spectrometry (EDX), using a spectrometer attached to the SEM. X-ray photoelectron spectroscopy (XPS) analysis was carried out using the monochromatic Al Kα excitation source. The PL spectra, photoluminescence excitation (PLE) spectra and the luminescence decay curves of the prepared samples were measured on a spectrometer (UK, Edinburgh, FS5) using a continuous and pulsed xenon lamp (150 W) as the excitation source. The thermal quenching was studied from 303 to 503 K using PL equipment with a homemade temperature control system.3. Results and discussion
3.1 Phase structures and morphology analysis
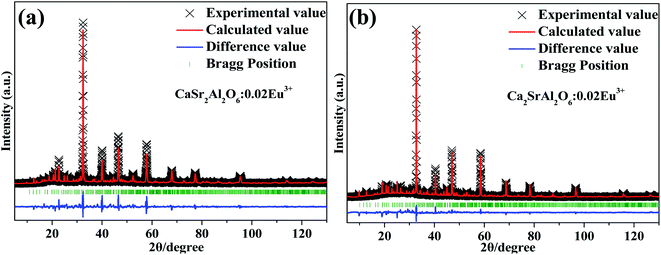
The crystal structure and occupation probability, as well as the phase purity of the CaSr2Al2O6:0.02Eu3+ and Ca2SrAl2O6:0.02Eu3+ samples were developed using the GSAS Rietveld refinement, as illustrated in Fig. 1. The crystallographic standard data cards of ICSD-520249(CaSr2Al2O6) and ICSD-520250(Ca2SrAl2O6) were employed as the initial structural model. The final refinement results for the CaSr2Al2O6:0.02Eu3+ and Ca2SrAl2O6:0.02Eu3+ samples, as well as their standard cell parameters, are presented in Table 1. Accordingly, the CaSr2Al2O6:0.02Eu3+ and Ca2SrAl2O6:0.02Eu3+ samples possess a cubic structure system with a space-group of Pa![[3 with combining macron]](https://www.rsc.org/images/entities/char_0033_0304.gif) (205). In addition, the unit cell volume of CaSr2Al2O6:0.02Eu3+ (a = 15.456 Å, V = 3692.4 Å3) and Ca2SrAl2O6:0.02Eu3+ (a = 15.380 Å, V = 3638.3 Å3) are smaller than those of pure CaSr2Al2O6 (a = 15.550 Å, V = 3760.0 Å3) and the Ca2SrAl2O6 (a = 15.408 Å, V = 3658.0 Å3) host, respectively. The shrinking of the unit cell volume further demonstrates that the Eu3+ ions have successfully moved into the host. It is well known that the percentage difference for the ion radius between the host and doped ions should be less than 30%.8 As for Al3+ ions (r = 0.39 Å, CN = 4), Ca2+ ions (r = 1.00 Å, CN = 6) and Sr2+ ions (r = 1.18 Å, CN = 6), the values were calculated and found to be −142.82%, 5.3% and 19.7%, respectively. Therefore, there is no possibility of Eu3+ ions being doped into Al3+ sites. Moreover, the unit cell crystal structure diagrams of the CaSr2Al2O6 and Ca2SrAl2O6 samples with the coordination environments of Ca2+, Sr2+, Al3+ are presented in Fig. 2. Obviously, there are six kinds of crystallographic sites for the Ca and Sr atoms in the three crystal structures, including Ca1, Ca2, Ca3, Sr2/Ca4, Sr3/Ca5 and Sr1 in CaSr2Al2O6 and Ca1, Ca2, Ca3, Sr2/Ca4, Ca5 and Sr1 in Ca2SrAl2O6, respectively. The abundant octahedrons [CaO6] consist of Ca2+ ions surrounded by six O2−. In addition, the Sr1, Sr2/Ca4 and Sr3/Ca5 sites are coordinated with nine, eight and seven oxygen atoms, respectively. Among them, the polyhedral structures of the Ca and Sr atoms provide suitable conditions for the Ca2+ and Sr2+ ions, which can be easily replaced by Eu3+ ions.
(205). In addition, the unit cell volume of CaSr2Al2O6:0.02Eu3+ (a = 15.456 Å, V = 3692.4 Å3) and Ca2SrAl2O6:0.02Eu3+ (a = 15.380 Å, V = 3638.3 Å3) are smaller than those of pure CaSr2Al2O6 (a = 15.550 Å, V = 3760.0 Å3) and the Ca2SrAl2O6 (a = 15.408 Å, V = 3658.0 Å3) host, respectively. The shrinking of the unit cell volume further demonstrates that the Eu3+ ions have successfully moved into the host. It is well known that the percentage difference for the ion radius between the host and doped ions should be less than 30%.8 As for Al3+ ions (r = 0.39 Å, CN = 4), Ca2+ ions (r = 1.00 Å, CN = 6) and Sr2+ ions (r = 1.18 Å, CN = 6), the values were calculated and found to be −142.82%, 5.3% and 19.7%, respectively. Therefore, there is no possibility of Eu3+ ions being doped into Al3+ sites. Moreover, the unit cell crystal structure diagrams of the CaSr2Al2O6 and Ca2SrAl2O6 samples with the coordination environments of Ca2+, Sr2+, Al3+ are presented in Fig. 2. Obviously, there are six kinds of crystallographic sites for the Ca and Sr atoms in the three crystal structures, including Ca1, Ca2, Ca3, Sr2/Ca4, Sr3/Ca5 and Sr1 in CaSr2Al2O6 and Ca1, Ca2, Ca3, Sr2/Ca4, Ca5 and Sr1 in Ca2SrAl2O6, respectively. The abundant octahedrons [CaO6] consist of Ca2+ ions surrounded by six O2−. In addition, the Sr1, Sr2/Ca4 and Sr3/Ca5 sites are coordinated with nine, eight and seven oxygen atoms, respectively. Among them, the polyhedral structures of the Ca and Sr atoms provide suitable conditions for the Ca2+ and Sr2+ ions, which can be easily replaced by Eu3+ ions.
| CaSr2Al2O6 | CaSr2Al2O6:0.02Eu3+ | Ca2SrAl2O6 | Ca2SrAl2O6:0.02Eu3+ | |
|---|---|---|---|---|
| Crystal system | Cubic | Cubic | Cubic | Cubic |
| Space group | Pa![[3 with combining macron]](https://www.rsc.org/images/entities/char_0033_0304.gif) (205) (205) |
Pa![[3 with combining macron]](https://www.rsc.org/images/entities/char_0033_0304.gif) (205) (205) |
Pa![[3 with combining macron]](https://www.rsc.org/images/entities/char_0033_0304.gif) (205) (205) |
Pa![[3 with combining macron]](https://www.rsc.org/images/entities/char_0033_0304.gif) (205) (205) |
| Units, Z | 24 | 24 | 24 | 24 |
| a (Å) | 15.550 | 15.456 | 15.408 | 15.380 |
| V (Å3) | 3760.0 | 3692.4 | 3658.0 | 3638.3 |
| Rp (%) | 10.05 | 8.01 | ||
| Rwp (%) | 13.53 | 11.24 | ||
| RE (%) | 4.58 | 4.94 | ||
| χ2 | 8.718 | 5.187 |
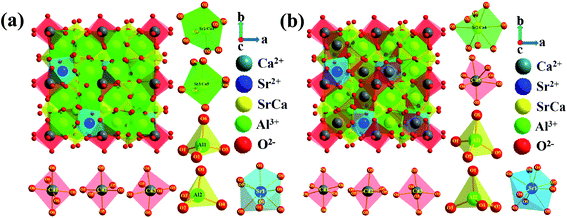 | ||
| Fig. 2 Unit cell crystal structures of (a) CaSr2Al2O6, and (b) Ca2SrAl2O6 with the coordination environments for Ca2+, Sr2+, and Al3+. | ||
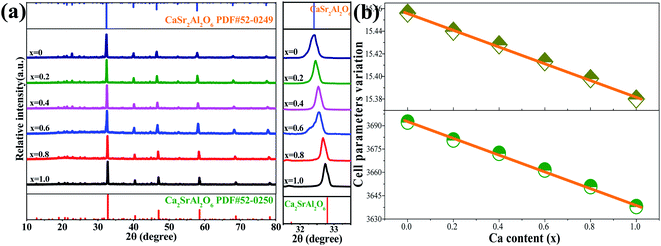
The XRD patterns of the CaSr2Al2O6:yEu3+ (y = 0.005, 0.01, 0.02, 0.03, 0.04, 0.05 and 0.10) and Ca1+xSr2−xAl2O6:0.02Eu3+ (x = 0, 0.2, 0.4, 0.6, 0.8 and 1.0) samples were measured and are shown in Fig. 3a and S1a.† As the Eu3+ ions are doped into the host or Sr2+ ions are substituted by Ca2+ ions, no other impurity phases can be observed. In addition, with the increasing Eu3+ concentration, the main diffraction peaks gradually shift towards the higher side of the angles, as presented in Fig. S1b.† Based on the Bragg equation (2d![[thin space (1/6-em)]](https://www.rsc.org/images/entities/char_2009.gif) sin
sin![[thin space (1/6-em)]](https://www.rsc.org/images/entities/char_2009.gif) θ = nλ), in which d, λ and θ, respectively, correspond to interplanar crystal spacing, the wavelength of the X-ray and the diffraction angle, this phenomenon can be attributed to the Ca2+ or Sr2+ ions that are replaced by the Eu3+ ions. Thus, with the increasing concentration of Eu3+ ions, the interplanar crystal spacing (d) will decrease owing to the effective ionic radius of the Eu3+ ions (r = 0.947 Å, CN = 6) being smaller than those of the Ca2+ or Sr2+ ions. Similarly, the Sr2+ ions are gradually replaced by Ca2+ ones in the Ca1+xSr2−xAl2O6:0.02Eu3+ (x = 0, 0.2, 0.4, 0.6, 0.8 and 1.0) samples, the main diffraction peaks shift to a larger angle value, as shown in Fig. 3a, which can be attributed to the larger Sr2+ ions, which are displaced by smaller Ca2+ ones. In addition, the variations in the cell parameter a and the unit cell volume V in the Ca1+xSr2−xAl2O6:0.02Eu3+ samples have been demonstrated in Fig. 3b. Obviously, the lattice parameters present a linear decline owing to the enhancement of the Ca2+ contents, in which the a and V reduce from 15.456 to 15.380 Å and 3692.4 to 3638.3 Å3, respectively. These results further confirm the substituted Ca2+ for the Sr2+ sites in the host lattice of Ca1+xSr2−xAl2O6:0.02Eu3+.
θ = nλ), in which d, λ and θ, respectively, correspond to interplanar crystal spacing, the wavelength of the X-ray and the diffraction angle, this phenomenon can be attributed to the Ca2+ or Sr2+ ions that are replaced by the Eu3+ ions. Thus, with the increasing concentration of Eu3+ ions, the interplanar crystal spacing (d) will decrease owing to the effective ionic radius of the Eu3+ ions (r = 0.947 Å, CN = 6) being smaller than those of the Ca2+ or Sr2+ ions. Similarly, the Sr2+ ions are gradually replaced by Ca2+ ones in the Ca1+xSr2−xAl2O6:0.02Eu3+ (x = 0, 0.2, 0.4, 0.6, 0.8 and 1.0) samples, the main diffraction peaks shift to a larger angle value, as shown in Fig. 3a, which can be attributed to the larger Sr2+ ions, which are displaced by smaller Ca2+ ones. In addition, the variations in the cell parameter a and the unit cell volume V in the Ca1+xSr2−xAl2O6:0.02Eu3+ samples have been demonstrated in Fig. 3b. Obviously, the lattice parameters present a linear decline owing to the enhancement of the Ca2+ contents, in which the a and V reduce from 15.456 to 15.380 Å and 3692.4 to 3638.3 Å3, respectively. These results further confirm the substituted Ca2+ for the Sr2+ sites in the host lattice of Ca1+xSr2−xAl2O6:0.02Eu3+.
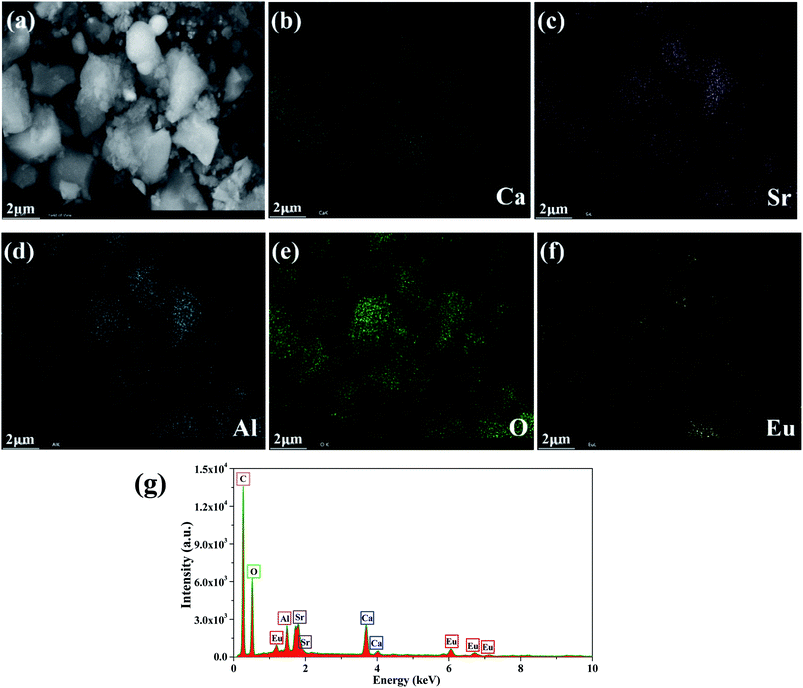
The morphology and composition of the as-prepared CaSr2Al2O6:0.02Eu3+ sample were examined using SEM and are presented in Fig. 4a. Obviously, irregular blocky particles with sizes ranging from 0.5 to 10 μm can be observed. Furthermore, the elemental distribution was studied using EDX mapping, as exhibited in Fig. 4b–f. It was found that the Ca, Sr, Al, O and Eu elements are distributed homogeneously on the surface. As expected, the EDX spectrum further proves that only the Ca, Sr, Al, O and Eu elements exist, as demonstrated in Fig. 4g. Meanwhile, to confirm whether some Eu2+ ions existed in the CaSr2Al2O6:Eu3+ sample, the high-resolution XPS scan spectrum for the Eu 4d region is shown in Fig. S2.† The presence of two peaks located at 134.4 and 141.0 eV are indicative of the Eu3+ 4d5/2 and 4d3/2 core levels, respectively, and the well-known peak around 129.4 eV associated with Eu2+ (4d5/2) was not observed.35 Therefore, there was no Eu2+ present in the prepared sample.
3.2 Photoluminescence properties
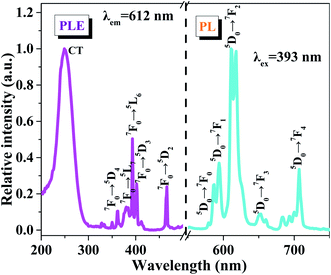
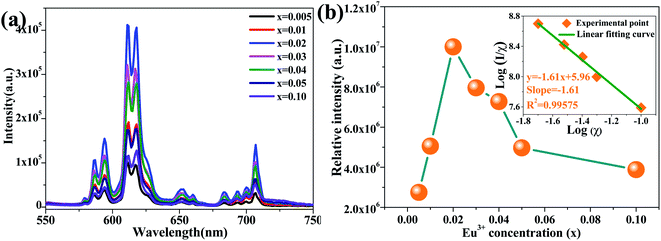
The PLE and PL spectra of the CaSr2Al2O6:0.02Eu3+ sample are shown in Fig. 5. The broad band with a maximum at approximately 250 nm is known as the charge transfer (CT) process, which is ascribed to the transition from the O2− 2p state to the Eu3+ 4f state. Meanwhile, the PLE spectrum contains several sharp peaks between 350 and 500 nm owing to the typical intra-4f transitions of the Eu3+ ions.19,36 Obviously, the two strongest peaks at 393 and 465 nm, originating from the 7F0 → 5L6 and 7F0 → 5D2 transitions of the Eu3+ ions, respectively, can be observed, which illustrate the prepared sample can be excited by the near ultraviolet and blue LED chips effectively.36 Upon excitation at 393 nm, several emission peaks from 550 to 750 nm, corresponding to the electronic 5D0 → 7Fi (i = 0, 1, 2, 3, 4) transitions, are present in the PL spectrum.3 The most intense emission peak at 612 nm and four other weaker emission peaks at 579, 594, 653 and 707 nm can be found, which are in good agreement with the 5D0 → 7F2, 5D0 → 7F0, 5D0 → 7F1, 5D0 → 7F3 and 5D0 → 7F4 transitions of the Eu3+ ions, respectively.32,37,38 These results reveal that the Eu3+ ions have occupied a site with a narrow crystal symmetry in the lattice of CaSr2Al2O6.In order to investigate the influence of Eu3+ concentrations on the luminescent intensity, the PL spectra of the CaSr2Al2O6:yEu3+ (y = 0.005, 0.01, 0.02, 0.03, 0.04, 0.05 and 0.10) phosphors with different Eu3+ ion concentrations have been measured, as shown in Fig. 6a. Clearly, all of the samples exhibit the same spectral shapes around 612 nm, except for the luminous intensities. With the increase in the concentration of Eu3+ ions, the emission intensity is first enhanced and then reaches the maximum at 2 mol%, and then decreases gradually owing to the concentration quenching mechanism, as demonstrated in Fig. 6b. In the CaSr2Al2O6 matrix, the spacing between the adjacent Eu3+ ions will become smaller if the doping concentration of the Eu3+ ions reaches a certain value. Thus, the non-radiative energy transfer will increase, and then result in a decrease in the emission intensity. In general, non-radiative energy transfer occurs as an exchange interaction or electric multipole–multipole interaction from the sensitizer ions to the activator ions.37 Among these, the exchange interaction makes a vast difference when the critical distance is less than 5 Å. Thus, the critical distance Rc between the Eu3+ ions is calculated according to the Blasse theory.8 For the CaSr2Al2O6:0.02Eu3+ phosphor, the values obtained were V = 3692.4 Å3, Xc = 0.02 and N = 48. Therefore, the Rc was found to be 19.44 Å, which is much larger than 5 Å. Therefore, the non-radiative energy transfer between the Eu3+ ions is the electric multipole–multipole interaction. Herein, there are three types of electric multipole–multipole interaction, including dipole–dipole (d–d), dipole–quadrupole (d–q) and quadrupole–quadrupole (q–q) interactions, respectively. Based on Dexter's theory, the type of electric multipole–multipole interaction can be verified using the following formula:31
 | (1) |
After that, to systematically investigate the change in the luminescent intensity of the Eu3+ ions in the Ca1+xSr2−xAl2O6 host when the Sr2+ ions are increasingly replaced by Ca2+ ions, we adjusted the molar ratio of Ca![[thin space (1/6-em)]](https://www.rsc.org/images/entities/char_2009.gif) :
:![[thin space (1/6-em)]](https://www.rsc.org/images/entities/char_2009.gif) Sr from 1
Sr from 1![[thin space (1/6-em)]](https://www.rsc.org/images/entities/char_2009.gif) :
:![[thin space (1/6-em)]](https://www.rsc.org/images/entities/char_2009.gif) 2 to 2
2 to 2![[thin space (1/6-em)]](https://www.rsc.org/images/entities/char_2009.gif) :
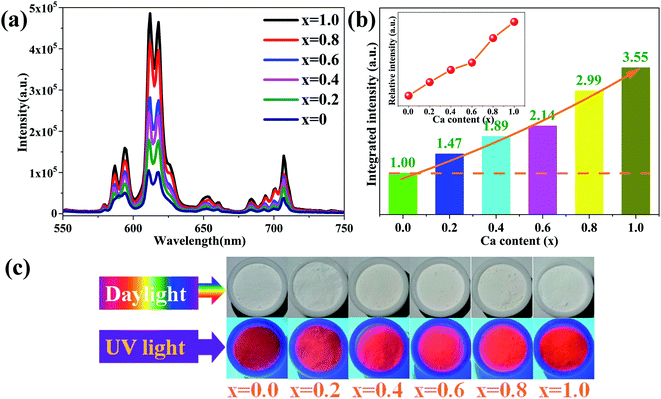
:![[thin space (1/6-em)]](https://www.rsc.org/images/entities/char_2009.gif) 1. In addition, we used 2 mol% as the doped concentration of Eu3+ ions, which has been verified as the optimal concentration in CaSr2Al2O6. As seen in Fig. 7a, all of the samples show the same spectral shapes with increasing Ca2+ concentrations (x) from 0 to 1.0. Clearly, the luminous intensities of the Eu3+ ions gradually increase with the enhancement of the Ca2+ concentrations. When x reaches 1.0, the emission intensity of the Ca2SrAl2O6:0.02Eu3+ phosphor was found to be 3.55 times greater than that of the CaSr2Al2O6:0.02Eu3+ phosphor, as depicted in Fig. 7b. The enhancement of the PL characteristics with the addition of Ca2+ may be attributed to some different factors. The bond lengths of the Ca, Sr/Ca and Sr ions coordinated with their ligands is one of the most prominent of these. Herein, the average bond lengths of Ca–O, Sr/Ca–O and Sr–O are shorter in Ca2SrAl2O6 than those in CaSr2Al2O6, as illustrated in Table S1.† Thus, with the increment of the Ca2+ doping concentrations, the average bond lengths of Ca–O, Sr/Ca–O and Sr–O are shorter, resulting in a larger average distance between the doping elements. The larger distance will weaken the non-radiative energy transfer from one Eu3+ to another Eu3+, and finally significantly enhance the efficiency of the radiative transition in the Ca2SrAl2O6 host.5,39,40 Furthermore, the Commission International de l’Eclairage (CIE 1931) chromaticity coordination diagram for the Ca1+xSr2−xAl2O6:0.02Eu3+ phosphors is exhibited in Fig. S3.† When the value of x increases from 0 to 1.0, the CIE chromaticity coordinates shift slightly from (0.6311, 0.3684) to (0.6488, 0.3508). All of the results demonstrate that the obtained phosphors can be used as excellent red-emitting phosphors for potential applications in the field of solid-state lighting. Meanwhile, the internal quantum efficiency (IQE) of CaSr2Al2O6:0.02Eu3+ and the Ca2SrAl2O6:0.02Eu3+ samples were obtained and found to be 36.5% and 46.3%, respectively, which are higher than those of the commercially available phosphors Y2O2S:Eu3+ (IQE: 35%),22 illustrating that the samples have promising application prospects in solid-state lighting.
1. In addition, we used 2 mol% as the doped concentration of Eu3+ ions, which has been verified as the optimal concentration in CaSr2Al2O6. As seen in Fig. 7a, all of the samples show the same spectral shapes with increasing Ca2+ concentrations (x) from 0 to 1.0. Clearly, the luminous intensities of the Eu3+ ions gradually increase with the enhancement of the Ca2+ concentrations. When x reaches 1.0, the emission intensity of the Ca2SrAl2O6:0.02Eu3+ phosphor was found to be 3.55 times greater than that of the CaSr2Al2O6:0.02Eu3+ phosphor, as depicted in Fig. 7b. The enhancement of the PL characteristics with the addition of Ca2+ may be attributed to some different factors. The bond lengths of the Ca, Sr/Ca and Sr ions coordinated with their ligands is one of the most prominent of these. Herein, the average bond lengths of Ca–O, Sr/Ca–O and Sr–O are shorter in Ca2SrAl2O6 than those in CaSr2Al2O6, as illustrated in Table S1.† Thus, with the increment of the Ca2+ doping concentrations, the average bond lengths of Ca–O, Sr/Ca–O and Sr–O are shorter, resulting in a larger average distance between the doping elements. The larger distance will weaken the non-radiative energy transfer from one Eu3+ to another Eu3+, and finally significantly enhance the efficiency of the radiative transition in the Ca2SrAl2O6 host.5,39,40 Furthermore, the Commission International de l’Eclairage (CIE 1931) chromaticity coordination diagram for the Ca1+xSr2−xAl2O6:0.02Eu3+ phosphors is exhibited in Fig. S3.† When the value of x increases from 0 to 1.0, the CIE chromaticity coordinates shift slightly from (0.6311, 0.3684) to (0.6488, 0.3508). All of the results demonstrate that the obtained phosphors can be used as excellent red-emitting phosphors for potential applications in the field of solid-state lighting. Meanwhile, the internal quantum efficiency (IQE) of CaSr2Al2O6:0.02Eu3+ and the Ca2SrAl2O6:0.02Eu3+ samples were obtained and found to be 36.5% and 46.3%, respectively, which are higher than those of the commercially available phosphors Y2O2S:Eu3+ (IQE: 35%),22 illustrating that the samples have promising application prospects in solid-state lighting.
To further verify the promoting effect of the Ca2+ ions on the Ca1+xSr2−xAl2O6:0.02Eu3+ phosphors, the luminescent decay curves of Ca1+xSr2−xAl2O6:0.02Eu3+ (0 ≤ x ≤ 1.0) were measured, as presented in Fig. 8. Obviously, all of the curves are in accordance with the following single exponential attenuation formula:10,14
I(t) = I0 + A![[thin space (1/6-em)]](https://www.rsc.org/images/entities/char_2009.gif) exp(−t/τ) exp(−t/τ)
| (2) |
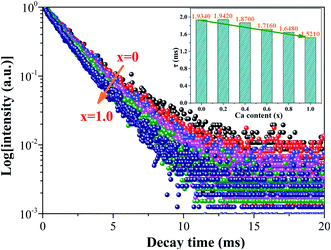 | ||
| Fig. 8 The luminescent decay curves of the Ca1+xSr2−xAl2O6:0.02Eu3+ (0 ≤ x ≤ 1.0) phosphors. The inset shows the luminous lifetimes with different Ca2+ concentrations. | ||
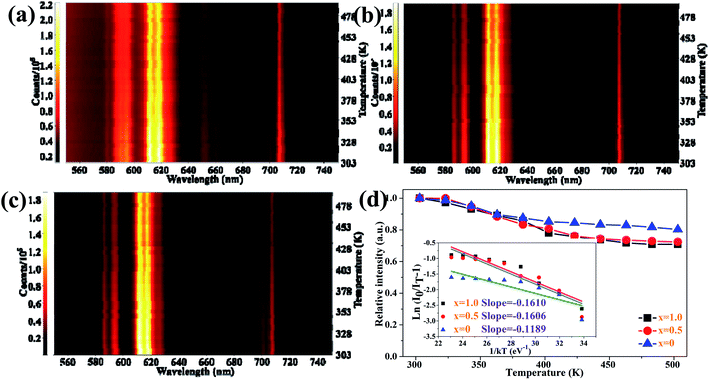
As one of the crucial factors for the practical application of WLEDs, thermal stability has been studied systematically. The temperature-dependent PL emission spectra of the Ca1+xSr2−xAl2O6:0.02Eu3+ phosphors with various Ca2+ concentrations have been shown in Fig. 9a–c. Evidently, the PL intensities of these phosphors present a slight decline as the temperature increases from 303 to 503 K. Additionally, the trend is described more clearly in Fig. 9d, in which the emission intensities decrease gradually with the increase in temperature. In particular, the PL intensity at 423 K for the CaSr2Al2O6:0.02Eu3+, Ca1.5Sr1.5Al2O6:0.02Eu3+ and Ca2SrAl2O6:0.02Eu3+ phosphors drops to 84.5%, 76.1% and 75.7% compared with the initial intensity at 303 K, respectively. All of the phosphors possess excellent thermal stability performances. Generally speaking, the rigidity of the crystal structure is an important factor for thermal stability, and superior structural rigidity can produce an excellent thermal stability.41 As for the Ca1+xSr2−xAl2O6:0.02Eu3+ phosphors, the rigidity of the crystal structure will be reduced if the larger Sr2+ ions (r = 1.18 Å, CN = 6) are replaced by smaller Ca2+ ions (r = 1.00 Å, CN = 6), which eventually results in a decline in the thermal stability. Subsequently, in order to further confirm the mechanism of thermal quenching, the activation energy (ΔE) of CaSr2Al2O6:0.02Eu3+, Ca1.5Sr1.5Al2O6:0.02Eu3+ and Ca2SrAl2O6:0.02Eu3+ was calculated using a modified Arrhenius equation as follows:16
 | (3) |
4. Conclusions
In conclusion, a series of novel red-emitting CaSr2Al2O6:yEu3+ and Ca1+xSr2−xAl2O6:0.02Eu3+ phosphors has been successfully synthesized using a high-temperature solid-state method. The phase purities and crystal structures have been systematically investigated, and the results illustrate that all the samples possess a cubic structure system with a Pa![[3 with combining macron]](https://www.rsc.org/images/entities/char_0033_0304.gif) (205) space-group. The PL spectra demonstrate that strong red emission located at 612 nm, owing to the 5D0 → 7F2 transition of Eu3+ ions, is observed. The optimal doping concentration is 2 mol%, and the concentration quenching mechanism was determined and found to be a dipole–dipole interaction. The substitution of Sr2+ ions by Ca2+ ions can significantly increase the luminous intensities of the Ca1+xSr2−xAl2O6:0.02Eu3+ phosphors, and the emission intensity of the Ca2SrAl2O6:0.02Eu3+ phosphor was revealed to be 3.55 times greater than that of the CaSr2Al2O6:0.02Eu3+ one. Impressively, the Ca1+xSr2−xAl2O6:0.02Eu3+ phosphors exhibit excellent thermal stability performances, and at 423 K, the PL intensities of the CaSr2Al2O6:0.02Eu3+, Ca1.5Sr1.5Al2O6:0.02Eu3+, and Ca2SrAl2O6:0.02Eu3+ phosphors retain 84.5%, 76.1% and 75.7% of their intensities compared to their initial intensities at 303 K, respectively.
(205) space-group. The PL spectra demonstrate that strong red emission located at 612 nm, owing to the 5D0 → 7F2 transition of Eu3+ ions, is observed. The optimal doping concentration is 2 mol%, and the concentration quenching mechanism was determined and found to be a dipole–dipole interaction. The substitution of Sr2+ ions by Ca2+ ions can significantly increase the luminous intensities of the Ca1+xSr2−xAl2O6:0.02Eu3+ phosphors, and the emission intensity of the Ca2SrAl2O6:0.02Eu3+ phosphor was revealed to be 3.55 times greater than that of the CaSr2Al2O6:0.02Eu3+ one. Impressively, the Ca1+xSr2−xAl2O6:0.02Eu3+ phosphors exhibit excellent thermal stability performances, and at 423 K, the PL intensities of the CaSr2Al2O6:0.02Eu3+, Ca1.5Sr1.5Al2O6:0.02Eu3+, and Ca2SrAl2O6:0.02Eu3+ phosphors retain 84.5%, 76.1% and 75.7% of their intensities compared to their initial intensities at 303 K, respectively.
Conflicts of interest
There are no conflicts to decare.Acknowledgements
This work was supported by the National Natural Science Foundation of China (52072101, 51972088).References
- M. Gao, Y. Pan, Y. Jin and J. Lin, RSC Adv., 2021, 11, 760–779 RSC.
- Z. Xia and Q. Liu, Prog. Mater. Sci., 2016, 84, 59–117 CrossRef CAS.
- Q. Mao, B. Shen, T. Yang, J. Zhong and G. Wu, Ceram. Int., 2020, 46, 19328–19334 CrossRef CAS.
- T. Hu, Y. Gao, X. Ji, Z. Xia and Q. Zhang, Inorg. Chem. Front., 2020, 7, 2685–2691 RSC.
- J. Yang, J. Zhang, Z. Gao, M. Tao, P. Dang, Y. Wei and G. Li, Inorg. Chem. Front., 2019, 6, 2004–2013 RSC.
- R. J. Xie and N. Hirosaki, Sci. Technol. Adv. Mater., 2016, 8, 588–600 CrossRef.
- M. G. Brik, C. Ma, A. M. Srivastava and M. Piasecki, Chin. J. Lumin., 2020, 41, 1011–1029 Search PubMed.
- J. Zhong, S. Zhou, D. Chen, J. Li, Y. Zhu, X. Li, L. Chen and Z. Ji, Dalton Trans., 2018, 47, 8248–8256 RSC.
- P. Dang, G. Li, S. Liang, H. Lian and J. Lin, J. Mater. Chem. C, 2019, 7, 5975–5987 RSC.
- J. Zhong, L. Li, M. Liu, K. Wang, Y. Zhu, X. Li, Z. Ji and D. Chen, J. Am. Ceram. Soc., 2019, 102, 7376–7385 CrossRef CAS.
- Q. Wu, X. Chen, H. Chen, H. Zhang and J. Zhou, J. Am. Ceram. Soc., 2019, 102, 6068–6076 CrossRef CAS.
- W. Zhang, Y. Tong, F. Hu, R. Wei, L. Chen and H. Guo, Ceram. Int., 2021, 47, 284–291 CrossRef CAS.
- H. Chen, J. Ding, X. Ding, X. Wang, Y. Cao, Z. Zhao and Y. Wang, Inorg. Chem., 2017, 56, 10904–10913 CrossRef CAS PubMed.
- Z. Wang, Z. Wang, Y. Li, J. Liu, Q. Bao, X. Meng, K. Qiu, Z. Yang, D. Wang and P. Li, RSC Adv., 2021, 11, 2706–2717 RSC.
- Y. Li, Y. Shi, G. Zhu, Q. Wu, H. Li, X. Wang, Q. Wang and Y. Wang, Inorg. Chem., 2014, 53, 7668–7675 CrossRef CAS PubMed.
- J. Li, J. Yan, D. Wen, W. U. Khan, J. Shi, M. Wu, Q. Su and P. A. Tanner, J. Mater. Chem. C, 2016, 4, 8611–8623 RSC.
- P. Halappa, B. Devakumar and C. Shivakumara, New J. Chem., 2019, 43, 63–71 RSC.
- M. K. Sahu, H. Kaur, B. V. Ratnam, J. S. Kumar and M. Jayasimhadri, Ceram. Int., 2020, 46, 26410–26415 CrossRef CAS.
- M. Liu, B. Shen, K. Wang, J. Zhong and D. Chen, RSC Adv., 2019, 9, 20742–20748 RSC.
- Y. Li, Y. Shi and Y. Wang, ECS J. Solid State Sci. Technol., 2013, 2, R208–R212 CrossRef CAS.
- X. Min, Y. Sun, L. Kong, M. Guan, M. Fang, Y. g. Liu, X. Wu and Z. Huang, Dyes Pigm., 2018, 157, 47–54 CrossRef CAS.
- D. Wen, J. Feng, J. Li, J. Shi, M. Wu and Q. Su, J. Mater. Chem. C, 2015, 3, 2107–2114 RSC.
- S. Wang, Q. Sun, B. Devakumar, B. Li, H. Guo and X. Huang, J. Lumin., 2019, 206, 571–577 CrossRef CAS.
- M. Li, J. Zhang, J. Han, Z. Qiu, W. Zhou, L. Yu, Z. Li and S. Lian, Inorg. Chem., 2017, 56, 241–251 CrossRef CAS PubMed.
- Y. Wei, L. Cao, L. Lv, G. Li, J. Hao, J. Gao, C. Su, C. C. Lin, H. S. Jang, P. Dang and J. Lin, Chem. Mater., 2018, 30, 2389–2399 CrossRef CAS.
- Y. Zhang, X. Li, K. Li, H. Lian, M. Shang and J. Lin, ACS Appl. Mater. Interfaces, 2015, 7, 2715–2725 CrossRef CAS PubMed.
- J. Wan, Y. Zhang, Y. Wang, R. Ma, Y. Wu, X. Qiao and X. Fan, J. Mater. Chem. C, 2018, 6, 3346–3351 RSC.
- Y. Chen, J. He, X. Zhang, M. Rong, Z. Xia, J. Wang and Z. Q. Liu, Inorg. Chem., 2020, 59, 1383–1392 CrossRef CAS PubMed.
- M. Jiao, Y. Jia, W. Lu, W. Lv, Q. Zhao, B. Shao and H. You, Dalton Trans., 2014, 43, 3202–3209 RSC.
- J. Zhong, D. Chen, S. Yuan, M. Liu, Y. Yuan, Y. Zhu, X. Li and Z. Ji, Inorg. Chem., 2018, 57, 8978–8987 CrossRef CAS PubMed.
- J. Zhong, Y. Peng, D. Chen, M. Liu, X. Li, Y. Zhu and Z. Ji, J. Mater. Chem. C, 2018, 6, 13305–13315 RSC.
- J. Zhao, H. Gao, H. Xu, Z. Zhao, H. Bu, X. Cao, L. He, Z. Yang and J. Sun, RSC Adv., 2021, 11, 8282–8289 RSC.
- Q. Liu, X. Li, B. Zhang, L. Wang, Q. Zhang and L. Zhang, Ceram. Int., 2016, 42, 15294–15300 CrossRef CAS.
- C. Xia, C. Yu, M. Cao, J. Xia, D. Jiang, G. Zhou, D. Zhang and H. Li, Ceram. Int., 2018, 44, 21040–21046 CrossRef CAS.
- J. Liu, Z. Wang, X. Li, X. Meng, K. Qiu, D. Wang, J. Zhao, W. Lai, Z. Yang and P. Li, CrystEngComm, 2020, 22, 5323–5337 RSC.
- Z. Liu, C. Shen, L. Yuan, Y. Chen, L. Shen, M. He, R. Yuan, X. Liang, J. Liu and W. Xiang, J. Am. Ceram. Soc., 2019, 102, 3823–3828 CrossRef CAS.
- W. Xie, Y. Mo, C. Zou, F. Kang and G. Sun, Inorg. Chem. Front., 2018, 5, 1076–1084 RSC.
- C. Xia, Y. Xu, M. M. Cao, Y. P. Liu, J. F. Xia, D. Y. Jiang, G. H. Zhou, R. J. Xie, D. F. Zhang and H. L. Li, Talanta, 2020, 212, 120795 CrossRef CAS PubMed.
- B. Mutelet, P. Perriat, G. Ledoux, D. Amans, F. Lux, O. Tillement, C. Billotey, M. Janier, C. Villiers, R. Bazzi, S. Roux, G. Lu, Q. Gong and M. Martini, J. Appl. Phys., 2011, 110, 094317 CrossRef.
- S. Saha, S. Das, U. K. Ghorai, N. Mazumder, D. Ganguly and K. K. Chattopadhyay, J. Phys. Chem. C, 2015, 119, 16824–16835 CrossRef CAS.
- Q. Wang, Z. Mu, S. Zhang, X. Feng, Q. Zhang, D. Zhu, Q. Du and F. Wu, Lumin, 2018, 33, 1371–1376 CrossRef CAS PubMed.
- N. Zhang, C. Guo, J. Zheng, X. Su and J. Zhao, J. Mater. Chem. C, 2014, 2, 3988–3994 RSC.
- C. Yang, S. Das and C. Lu, J. Lumin., 2015, 168, 199–206 CrossRef CAS.
Footnote |
| † Electronic supplementary information (ESI) available. See DOI: 10.1039/d1ra01291f |
| This journal is © The Royal Society of Chemistry 2021 |

