 Open Access Article
Creative Commons Attribution 3.0 Unported Licence
Density-functional study of pressure-induced phase transitions and electronic properties of Zn2V2O7
Daniel Díaz-Anichtchenko a,
Lourdes Gracia
 b and
Daniel Errandonea
 *a
*a
aDepartamento de Física Aplicada-ICMUV, Universidad de Valencia, Dr. Moliner 50, Burjassot, 46100 Valencia, Spain. E-mail: daniel.errandonea@uv.es
bDepartamento de Química Física, Universidad de Valencia, Dr. Moliner 50, Burjassot, 46100 Valencia, Spain
First published on 10th March 2021
Abstract
We report a study of the high-pressure behavior of the structural and electronic properties of Zn2V2O7 by means of first-principle calculations using the CRYSTAL code. Three different approaches have been used, finding that the Becke–Lee–Yang–Parr functional is the one that best describes Zn2V2O7. The reported calculations contribute to the understanding of previous published experiments. They support the existence of three phase transitions for pressures smaller than 6 GPa. The crystal structure of the different high-pressure phases is reported. We have also made a systematic study of the electronic band-structure, determining the band-gap and its pressure dependence for the different polymorphs. The reported results are compared to previous experimental studies. All the polymorphs of Zn2V2O7 have been found to have a wide band gap, with band-gap energies in the near-ultraviolet region of the electromagnetic spectrum.
1. Introduction
Zinc pyrovanadate (Zn2V2O7) and related compounds are receiving a great deal of attention because of the multiple practical applications of these compounds. The applications include hydrogen storage,1 photocatalytic water splitting,2 batteries,3 and supercapacitors,4 among others. These vanadates not only have optimal optical and electronic properties for such uses, but also are chemically stable under mild alkaline conditions. As a consequence, their properties are being currently systematically studied.1–8 In addition to technological applications, Zn2V2O7 has recently raised attention because of its interesting behavior under high-pressure conditions.8 In particular, it has been reported that Zn2V2O7 (with a bulk modulus of 58 GPa (ref. 7)) is extremely more compressible that related vanadates like ZnV2O6 and Zn3V2O8 (with bulk moduli of 129 and 120 GPa, respectively).7 Not only that, differences between the compressibility of Zn2V2O7 and other vanadates also affect the structural stability under compression. According to X-ray diffraction experiments, Zn2V2O7 experiences three structural phase transitions under relative small compression (pressure < 11 GPa), while in the other compounds there are no phase transitions in the same pressure range.7 In particular, in Zn2V2O7 the transition from the ambient-pressure monoclinic polymorph (α-phase) to another monoclinic polymorph (β-phase) occurs at 1.1 GPa (ref. 7) and subsequent transitions take place at 3.8 GPa) (to a triclinic polymorphs named as γ-phase) and 10.8 GPa (post-γ-phase).7 For two of the high-pressure (HP) polymorphs (β and γ) a crystal structure has been proposed from previous X-ray diffraction studies; however, the crystal structures have not been properly solved.7 The proposed structures involve large changes in the unit-cell volume and a modification of the coordination polyhedra. Therefore, they are expected to affect other physical properties, in particular, the electronic band gap.8 However, the influence of high-pressure on the electronic properties of Zn2V2O7 has not been studied yet. Thus additional HP studies on Zn2V2O7 are relevant and timely.Density-functional theory (DFT) calculations have proven to be a quite efficient tool to study the HP behavior of ternary oxides, and in particular vanadates.9–12 In this work, we will use this technique to examine the existence of pressure-driven phase transitions in Zn2V2O7. By considering the previously proposed HP crystal structures7 for this compound and other candidate structures, we have obtained a structural sequence, which will be compared to previous experiments.7 In addition, to crystallographic information on the different structures, we will also report their compressibilities and equations of state as well as their band structures and electronic densities of states. The band-structure calculations here reported support that Zn2V2O7 is a wide band-gap material, clarifying discrepancies found in the literature with values for band-gap energy (Eg) going from 2.5 to 3.5 eV.2,13–16
2. Computational details
First-principles total-energy calculations have been carried out within the periodic DFT framework using the CRYSTAL14 program package.17 The applied density-functional approximations were the popular Becke–Lee–Yang–Parr (B3LYP)18,19 and Heyd–Scuseria–Ernzerhof (HSE06)20 hybrid functionals as well as the widely used Perdew–Burke–Ernzerhof (PBE) functional.21 For the calculations, Zn, V, and O atoms have been described by 86-4111d41G, 86-411d3G, and 6-31d1G all electron basis sets, respectively, which were taken from the Crystal website.22The candidate structures are those proposed in the previous experimental study7 and potential structures selected according to crystal-chemistry arguments:23 α-Zn2V2O7 (space group (S.G.) C2/c),24 β-Zn2V2O7 (S. G. C2/m, isomorphous to Cd2V2O7),25 γ-Zn2V2O7 (S. G. P![[1 with combining macron]](https://www.rsc.org/images/entities/char_0031_0304.gif) , isomorphous to Mg2V2O7),26 δ-Zn2V2O7 (S. G. Pnma, isomorphous to Hg2V2O7),27 ε-Zn2V2O7 (S. G. P21/c, isomorphous to Pb2V2O7),28 ω-Zn2V2O7 (S. G. P
, isomorphous to Mg2V2O7),26 δ-Zn2V2O7 (S. G. Pnma, isomorphous to Hg2V2O7),27 ε-Zn2V2O7 (S. G. P21/c, isomorphous to Pb2V2O7),28 ω-Zn2V2O7 (S. G. P![[1 with combining macron]](https://www.rsc.org/images/entities/char_0031_0304.gif) , isomorphous to Sr2V2O7),29 κ-Zn2V2O7 (S. G. P21/c, isomorphous to Ni2V2O7).30 From now on, we will use the names α, β, γ, δ, ε, ω and κ for denoting the different phases in the rest of the manuscript.
, isomorphous to Sr2V2O7),29 κ-Zn2V2O7 (S. G. P21/c, isomorphous to Ni2V2O7).30 From now on, we will use the names α, β, γ, δ, ε, ω and κ for denoting the different phases in the rest of the manuscript.
The diagonalization of the Fock matrix has been performed at adequate k-point grids in the reciprocal space which depend on the phase under treatment using Pack–Monkhorst/Gilat shrinking factors (IS = ISP = 4), being the total number of k-points 24, 24, 36, 27, 30, 36 and 36 in the α, β, γ, δ, ε, ω and κ structures, respectively. The number of atoms in the unit cells is 22, 11, 22, 44, 44, 44 and 44 for the α, β, γ, δ, ε, ω, and κ structures, respectively. Thresholds controlling the accuracy of the calculation of Coulomb and exchange integrals have been set to 10−8 and 10−14 which assure a convergence in total energy better than 10−7 hartree in all cases, whereas the percent of Fock/Kohn–Sham matrices mixing has been set to 40 (IPMIX = 40). Since the choice of the exchange–correlation functional is of critical importance as it has a significant influence on the properties obtained,31 a complete structure optimization in terms of unit-cell parameters and atomic positions of the different Zn2V2O7 structures has been performed by using the B3LYP, HSE06, and PBE functionals.
In a previous study on ZnV2O6 (zinc metavanadate)9 it was shown that the empirical-correction scheme to energy that considers the long-range dispersion contributions proposed by Grimme32 should be included for properly describing this zinc vanadate. However, in the case of Zn2V2O7 (zinc pyrovanadate) we have found that structural and electronic properties were practically unaltered when including the Grimme dispersion correction. In particular, in α-Zn2V2O7, the unit-cell parameters at ambient pressure change 1% when including this semi-empirical correction. In addition, the shape of the electronic band structure and value on the band-gap energy remain nearly unchanged when including the Grimme correction. This indicates that long-range correlation interactions which capture van der Waals forces are weak in Zn2V2O7 not playing, as first-approximation, any relevant role in Zn2V2O7. Consequently, for the sake of computational efficiency, the Grimme extension was not included in the HP calculations.
In order to determine the thermodynamically stable phases and the possible phase transitions, the total energy was calculated as a function of the unit-cell volume through the optimization of the crystal structure. From total-energy calculations, the pressure (P)–volume (V) relationship was obtained from the energy (E) versus volume (V) curves by means of an equation of state (EOS) fit using a third-order Birch–Murnaghan EOS;33 where the fitting parameters were the volume at zero pressure (V0), the zero pressure bulk modulus (B0), and its pressure derivative ( ). Then, the enthalpy (H = E + P × V) of different polymorphs was determined as a function of pressure. The enthalpy/pressure curves obtained for Zn2V2O7 polymorphs were used to probe the thermodynamic stability of the system and to determine the values of theoretical transition pressures. The electronic-density of states (DOS) and band structure have been calculated for different polymorphs based on the optimized geometries. They allow determining the pressure dependence of the band-gap energy.
3. Results and discussion
3.1 Pressure-induced phase transitions
In order to study the effect of pressure in the crystal structure we have performed calculations considering seven different potential polymorphs (described explicitly in the previous section). These structures include the three phases that were previously found in experiments (α, β, and γ),7 which were already mentioned in the introduction, and four additional phases. These four phases have crystal structures isomorphic to other pyrovanadates. They were considered in our study because according to crystal chemistry arguments they are susceptible to become stable under HP conditions in Zn2V2O7.24 Schematic representations of the crystal structures of the seven phases are shown in Fig. 1.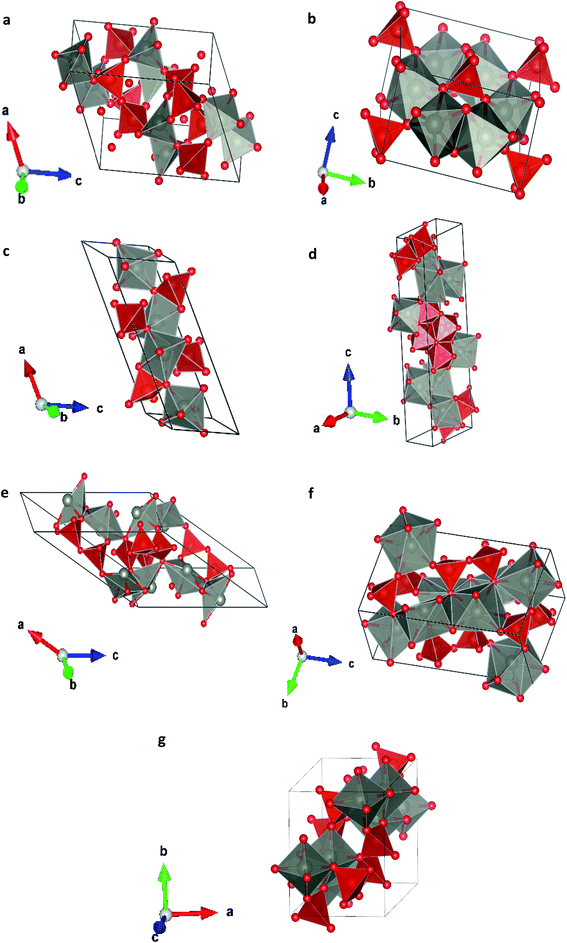 | ||
| Fig. 1 Different crystallographic structures proposed, (a) α-phase, (b) β-phase, (c) γ-phase, (d) δ-phase, (e) ε-epsilon, (f) ω-phase, (g) κ-phase. | ||
We have performed calculations using three different functionals and found that according to all of them that at ambient pressure α-Zn2V2O7 is the minimum enthalpy phase. We also found that the B3LYP functional is the one that best describe the crystal structure of Zn2V2O7 at ambient conditions. Values of the obtained unit-cell parameters are summarized in Table 1. There it can be seen that B3LYP underestimates the unit-cell volume by 1.7%. In contrast, the HSE06 and PBE functionals underestimate the volume by 4.4% and 2.8%, respectively (see Table 1). In Table 1 it can be also seen that previous calculations using the PBE formulation within the CASTEP code largely underestimated the unit-cell volume of Zn2V2O7. The atomic positions here calculated are given in Table 2, where it can be seen an excellent agreement of present calculations using the B3LYP functional with the experiments.25
| (b) | B3LYP | HSE06 | PBE | Exp.7 |
|---|---|---|---|---|
| a (Å) | 6.7274 | 6.4925 | 6.5135 | 6.648(5) |
| b (Å) | 8.3913 | 8.3992 | 8.4469 | 8.446(6) |
| c (Å) | 4.9888 | 4.9423 | 4.9973 | 4.9606(5) |
| β (°) | 105.84 | 103.57 | 103.54 | 106.0(2)° |
| V0 (Å3) | 135.5 | 131.0 | 133.7 | 133.9(3) |
| (c) | B3LYP | HSE06 | PBE |
|---|---|---|---|
| a (Å) | 14.1808 | 13.3671 | 13.5985 |
| b (Å) | 5.4681 | 5.4266 | 5.4417 |
| c (Å) | 5.1222 | 5.0044 | 5.0977 |
| α (°) | 76.78 | 79.97 | 78.41 |
| β (°) | 110.56 | 106.54 | 107.92 |
| γ (°) | 130.86 | 130.19 | 130.42 |
| V0 (Å3) | 140.6 | 132.9 | 136.6 |
| (d) | B3LYP | HSE06 | PBE |
|---|---|---|---|
| a (Å) | 6.9068 | 6.8402 | 6.8648 |
| b (Å) | 3.5667 | 3.5460 | 3.5779 |
| c (Å) | 19.6966 | 19.4272 | 19.6090 |
| V0 (Å3) | 121.3 | 117.8 | 120.4 |
| (e) | B3LYP | HSE06 | PBE |
|---|---|---|---|
| a (Å) | 6.6247 | 6.5664 | 6.6145 |
| b (Å) | 8.4115 | 8.3480 | 8.3944 |
| c (Å) | 9.5001 | 9.4223 | 9.4919 |
| β (°) | 100.47 | 100.39 | 100.29 |
| V0 (Å3) | 130.1 | 127.0 | 129.6 |
| Atom | Site | x | y | z | x | y | z |
|---|---|---|---|---|---|---|---|
| Zn | 8f | 0.4551 | 0.1797 | 0.0202 | 0.45 | 0.1760 | 0.0196 |
| V | 8f | 0.2096 | 0.0011 | 0.2066 | 0.202 | 0.0049 | 0.206 |
| O1 | 4e | 0 | 0.0412 | 0.25 | 0 | 0.0612 | 0.25 |
| O2 | 8f | 0.0910 | 0.4782 | 0.1401 | 0.102 | 0.481 | 0.138 |
| O3 | 8f | 0.2458 | 0.1606 | 0.1104 | 0.244 | 0.154 | 0.106 |
| O4 | 8f | 0.3311 | 0.3336 | 0.3900 | 0.347 | 0.335 | 0.386 |
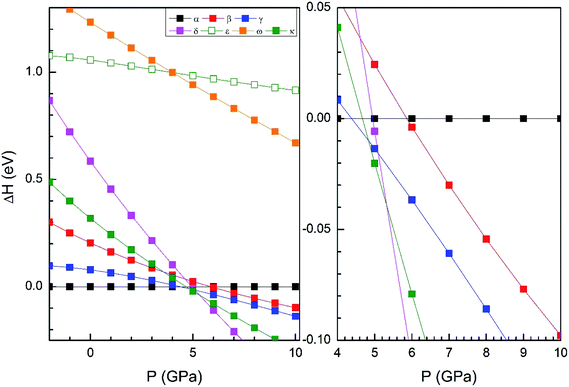
From our simulations, we have found that the three functionals we used in the calculations give a qualitatively similar HP structural sequence. Thus, to avoid redundancies we will mainly focus on describing the results obtained using B3YLP, the approach that better describe the ambient-pressure structure. In order to determine the thermodynamically most-stable phase of Zn2V2O7 at different pressures (determining therefore possible phase transitions) we have represented the enthalpy versus pressures for different phases in Fig. 2 (results calculated using B3YLP). This figure shows that the α-phase is the lowest enthalpy phase at ambient pressure and therefore it is the most stable, in agreement with experiments.7 We observe that the B3LYP functional predicts the first transition at 4.4 GPa approximately (HSE06 finds it at 2 GPa and PBE at 2.1 GPa). The α-phase is the one with lowest enthalpy (i.e. the most stable phase) up to this pressure, becoming the γ-phase the lowest enthalpy phase beyond 4.4 GPa, which supports the occurrence of the α–γ transition at this pressure. Calculations also predict a second phase transition at 4.8 GPa from the γ phase to the κ-phase followed by a subsequent transition to the δ-phase at 5.3 GPa. This phase is the lowest enthalpy phase among the seven considered phases up to 10 GPa.
We will compare now our finding with experiments.7 Experiments found first a α–β transition, being the onset of the transition at 0.7 GPa, but coexisting both phases up to 1.1 GPa. Experiments also found the β–γ transition at 3.8 GPa. Our calculations, in contrast, predict a direct α–γ transition at 4.4 GPa. Thus both experiments and calculations found the γ-phase to be the stable polymorph after a compression of around 4 GPa. We will comment next on the fact that the β-phase is not find by calculations between the α- and γ-phases. In Fig. 2 it can be seen that the β phase is competitive in enthalpy to the γ-phase (the difference is smaller than 0.05 eV). Thus, the experimental finding of the β-phase7 as the first HP phase of Zn2V2O7 could be related to the existence of a kinetic barrier blocking the transition to the γ-phase, which is a typical phenomenon of complex oxides under compression.34,35 The fact that the β-phase has been also obtained at high-temperature and ambient conditions36 supports the kinetic barrier hypothesis. The same argument applies for other phases with lower enthalpy than the β-phase at the theoretical transition pressure (for instance the κ-phase). Another possibility, is that entropy effects related to temperature (calculations have been carried out at 0 K) could favor the transition to the β-phase at room temperature.37 Performing finite temperature calculations is beyond the scope of the present study. Regarding the other candidate structures, from Fig. 2 it can be concluded that the ε and ω phases can be ruled out as possible candidates for HP polymorphs of Zn2V2O7. On the other hand, the finding of a post-γ-phase in the experiments is consistent with our finding that the δ- and κ-phases are more stable than the α-phase beyond 5.3 GPa.
In Table 1 we report the calculated unit-cell parameters for the β-phase. They agree well with those determined from HP XRD experiments.5 The calculated atomic positions (given in Table 3) also agree well with the literature.36 The similitude between the calculated and measured crystal structure of the β-phase supports the α–β transition found in experiments. In addition, the similarities of the calculated γ-phase with the γ-phase found in the experiments, support the observation of this phase at 3.8 GPa.
| Atom | Site | x | y | z | x | y | z |
|---|---|---|---|---|---|---|---|
| Zn | 4h | 0 | 0.3121 | 0 | 0 | 0.3158 | 0 |
| V | 4i | 0.2327 | 0 | 0.4061 | 0.2174 | 0 | 0.4049 |
| O1 | 2a | 0 | 0 | 0.5 | 0 | 0 | 0.5 |
| O2 | 8j | 0.2248 | 0.1677 | 0.2162 | 0.2151 | 0.1519 | 0.2085 |
| O3 | 4i | 0.5790 | 0 | 0.2775 | 0.5909 | 0 | 0.2950 |
In order to display further evidence that the functional B3LYP describes well the structure of the α and β phases, and the changes induced by pressure on it, we compare the calculated and measured pressure dependence of unit-cell parameters. Fig. 3 shows the unit-cell parameters of α and β phases versus the pressure. The results from calculations agree well with experiments5 (maximum 2% of relative error).
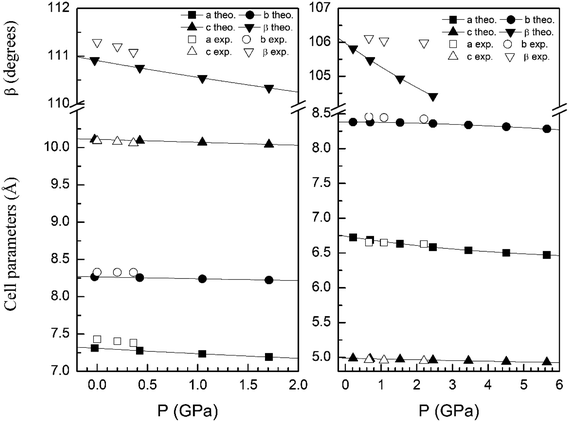 | ||
| Fig. 3 Cell parameters of α- (left graph) and β- (right graph) phases versus the pressure, compared with experimental results.7 | ||
In Fig. 4 we compare the pressure dependence of the volume showing a good agreement with experiments.7 A 4% collapse of the volume happening at the α–β transition. For the γ-phase, no comparison can be done for the pressure dependence of unit-cell parameters with experiments because this experimental information is not available yet. According to the present calculations, in the pressure range of stability of the γ-phase, it has a similar volume and compressibility than the β-phase.
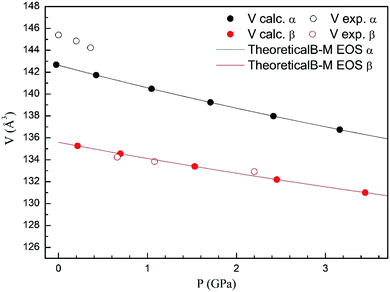 | ||
| Fig. 4 Unit cell volume of α- and β-phases versus the pressure, compared with experimental results.7 | ||
For completeness and favoring comparison with future studies, in Tables 4–6 we report the calculated atomic positions for the γ, κ- and δ-phases, respectively. The atomic positions of the γ-phase were not determined from previous powder XRD experiments, and the crystal structure of the post-γ-phase of Zn2V2O7 has not been even proposed yet. Thus, the results of the Tables 3–5 cannot be compared with previous studies, but they can help as a guide for the solution of the crystal structures of the γ-phase and post-γ-phase of Zn2V2O7 in future studies. According to our calculations, the post-γ-phase could be either the κ- or δ-phase, but as will comment below, we predict the κ-phase to be most probably the post-γ-phase.
| Atom | Site | x | y | z |
|---|---|---|---|---|
| Zn1 | 2i | 0.1151 | 0.3706 | 0.4627 |
| Zn2 | 2i | 0.4229 | 0.6311 | 0.4582 |
| V1 | 2i | 0.6344 | 0.9688 | 0.0776 |
| V2 | 2i | 0.8524 | 0.9714 | 0.9077 |
| O1 | 2i | 0.7300 | 0.9064 | 0.9990 |
| O2 | 2i | 0.9564 | 0.9803 | 0.2178 |
| O3 | 2i | 0.7329 | 0.3200 | 0.2371 |
| O4 | 2i | 0.9203 | 0.3175 | 0.7352 |
| O5 | 2i | 0.4659 | 0.0292 | 0.2283 |
| O6 | 2i | 0.2278 | 0.3472 | 0.3157 |
| O7 | 2i | 0.4553 | 0.3413 | 0.7158 |
| Atom | Site | x | y | z |
|---|---|---|---|---|
| Zn1 | 4e | 0.1467 | 0.1232 | 0.4640 |
| Zn2 | 4e | 0.3107 | 0.3921 | 0.6823 |
| V1 | 4e | 0.3598 | 0.7585 | 0.5307 |
| V2 | 4e | 0.1921 | 0.0198 | 0.8157 |
| O1 | 4e | 0.6102 | 0.1285 | 0.1212 |
| O2 | 4e | 0.4312 | 0.1288 | 0.3984 |
| O3 | 4e | 0.1687 | 0.3712 | 0.4605 |
| O4 | 4e | 0.2573 | 0.3621 | 0.1862 |
| O5 | 4e | 0.6823 | 0.3691 | 0.3476 |
| O6 | 4e | 0.0250 | 0.0831 | 0.2462 |
| O7 | 4e | 0.8504 | 0.3770 | 0.0082 |
| Atom | Site | x | y | z |
|---|---|---|---|---|
| Zn1 | 4c | 0.3094 | 0.25 | 0.7560 |
| Zn2 | 4c | 0.0684 | 0.25 | 0.3500 |
| V1 | 4c | 0.0422 | 0.25 | 0.1294 |
| V2 | 4c | 0.2887 | 0.25 | 0.5143 |
| O1 | 4c | 0.4311 | 0.25 | 0.7985 |
| O2 | 4c | 0.3869 | 0.25 | 0.3048 |
| O3 | 4c | 0.2606 | 0.25 | 0.1701 |
| O4 | 4c | 0.1240 | 0.25 | 0.0281 |
| O5 | 4c | 0.4569 | 0.25 | 0.6058 |
| O6 | 4c | 0.0832 | 0.25 | 0.5517 |
| O7 | 4c | 0.2507 | 0.25 | 0.4289 |
3.2 Bulk modulus and compressibility tensor
Next we will discuss the volume compressibility of the different phases. In Fig. 5 we report the pressure dependence of the unit-cell volume of the five relevant phases for this study up to 10 GPa. The dependence of the volume with pressure is well described with a third-order Birch–Murnaghan equation of state (EOS).33 In Table 7 we report the volume at zero pressure (V0), bulk modulus (B0), and its pressure derivative ( ) obtained for the EOS of different phases. Results obtained from different functionals are included in the table. All functionals give a qualitative similar behavior. The β-phase is less compressible than the α- and γ-phases, and the δ- and κ-phases are the least compressible phases. The bulk modulus of the different phase correlates with the inverse of the unit-cell volume at ambient pressure. The larger the volume the more compressible the phase, as expected.38 From Fig. 5 it can be seen that the transition from the γ-phase to the κ- and δ-phase involve a large volume collapse. In the first case the change in volume is nearly 6% (similar to the volume change between α and β or γ), but in the second case, the volume collapse is more than 13%, which is very large. The large volume change that occurs from γ to δ also supports the idea that a kinetic barrier could block the γ–δ transition, being more easily to obtain experimentally the transition for the γ-phase to a metastable κ-phase, which has associated a smaller volume collapse and consequently has associated less drastic changes in bonds.
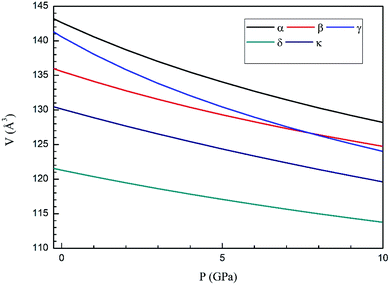 | ||
| Fig. 5 Pressure dependence of the unit-cell volume of Zn2V2O7 in B3LYP of α-, β-, γ-, δ- and κ-phases using A Birch–Murnaghan equation of state. | ||
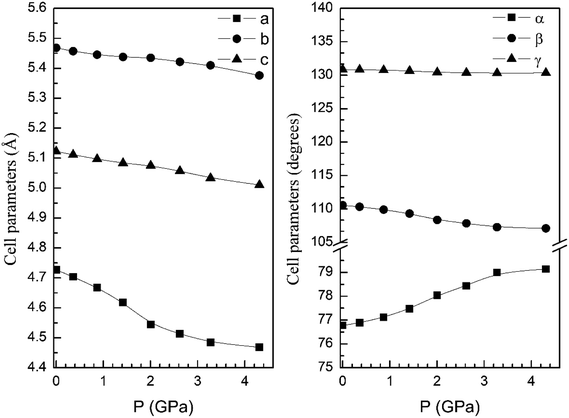
From our calculations we have also found that the response to pressure of the different polymorphs is anisotropic. This can be clearly seen in Fig. 3 for the α- and β-phases. A similar qualitative behavior has been found for the other polymorphs. This can be seen in Fig. 6 and 7 where we represent the pressure dependence of the unit-cell parameters for the γ-, δ-, and κ-phases. For instance, in the δ-phase the less compressible axis is the b-axis (see Fig. 7); being the linear compressibilities κa = κc = 3.26 × 10⁻³ GPa−1 and κb = 1.63 × 10⁻³ GPa−1. From these values a bulk modulus of 122 GPa is obtained in very good agreement with our EOS calculations (see Table 7). In the other structures is not so evident to determine the most compressible direction, given their monoclinic or triclinic symmetry. For the triclinic structure, the behavior is non-isotropic but also strongly non-linear as can be seen in Fig. 6. In the case of the monoclinic structures, the compressibility is described by a symmetric tensor with four elements different than zero.39 We have calculated it for the α-, β-, and γ-phases (the three monoclinic polymorphs) at zero pressure to further investigate its behavior under compression. The eigenvalues and eigenvectors of the compressibility tensor describe the magnitudes and directions of the principal axes of compression.40 We have obtained them for α-Zn2V2O7, β-Zn2V2O7, and γ-Zn2V2O7 using PASCAL.41 Their values are given in Table 8.
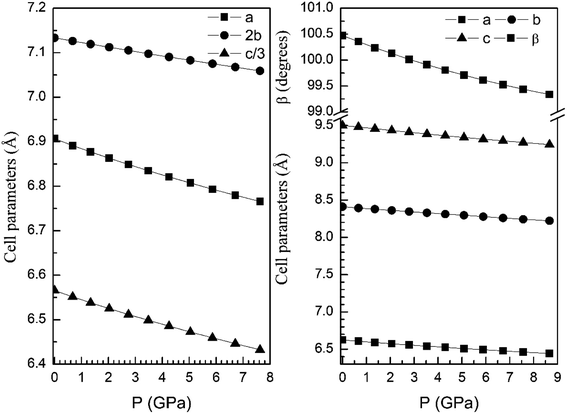 | ||
| Fig. 7 Unit-cell parameters of δ- (left graph) and κ-phases (right graph) versus the pressure. For the δ-phase we plot c/3 and 2b to facilitate the comparison between unit-cell parameters. | ||
| λ1 = 8.4(1) × 10−3 GPa−1 | eν1 = (0.9753, 0, −0.2208) |
| λ2 = 1.4(1) × 10−3 GPa−1 | eν2 = (0, −1, 0) |
| λ3 = 1.0(2) × 10−3 GPa−1 | eν3 = (−0.6404, 0, −0.7680) |
| λ1 = 5.5(3) × 10−3 GPa−1 | eν1 = (0.8410, 0, −0.5410) |
| λ2 = 3.3(1) × 10−3 GPa−1 | eν2 = (0, −1, 0) |
| λ3 = −0.9(1) × 10−3 GPa−1 | eν3 = (−0.4422, 0, −0.8969) |
| λ1 = 4.04(4) × 10−3 GPa−1 | eν1 = (−0.8321, 0, 0.5546) |
| λ2 = 2.59(1) × 10−3 GPa−1 | eν2 = (0, −1, 0) |
| λ3 = 1.84(1) × 10−3 GPa−1 | eν3 = (0.8117, 0, 0.5840) |
We have found that in the α-phase, the major compression direction is approximately parallel to the [50![[1 with combining macron]](https://www.rsc.org/images/entities/char_0031_0304.gif) ] crystallographic axis, being this direction at least six times more compressible than any other direction. The minimum compression direction is also in the plane perpendicular to the unique b-axis, approximately along the [405] crystallographic axis, but the compressibility in this direction is similar to the compressibility along the b-axis (see Table 8). From PASCAL we have obtained a bulk modulus of 62.3(5) GPa, which is in agreement with the result obtained from our EOS analysis.
] crystallographic axis, being this direction at least six times more compressible than any other direction. The minimum compression direction is also in the plane perpendicular to the unique b-axis, approximately along the [405] crystallographic axis, but the compressibility in this direction is similar to the compressibility along the b-axis (see Table 8). From PASCAL we have obtained a bulk modulus of 62.3(5) GPa, which is in agreement with the result obtained from our EOS analysis.
In the case of the β-phase, we found that upon compression two principal axes undergoes contraction but the third axis undergo an expansion, as can be seen by the negative value of the eigenvalue in Table 8. This anomalous behavior of lattice directions under pressure suggests an auxetic behavior of β-Zn2V2O7.42 This conclusion should be supported by future elastic constants calculations (which are beyond the scope of this work) and a detail evaluation of Poisson ratios.43,44 As can be seen in Table 8, in the β-phase, the direction the maximum compression is nearly parallel to the [30![[2 with combining macron]](https://www.rsc.org/images/entities/char_0032_0304.gif) ] crystallographic axis, being the linear compressibility along this direction 5/3 times the one along the b-axis. On the other hand, the direction that slightly expands under compression is nearly parallel to the [102] crystallographic axis. From PASCAL41 we have obtained a bulk modulus of 89.2(5) GPa, which is in agreement with the result obtained from our EOS analysis.
] crystallographic axis, being the linear compressibility along this direction 5/3 times the one along the b-axis. On the other hand, the direction that slightly expands under compression is nearly parallel to the [102] crystallographic axis. From PASCAL41 we have obtained a bulk modulus of 89.2(5) GPa, which is in agreement with the result obtained from our EOS analysis.
In the case of the κ-phase, the direction the maximum compression is nearly parallel to the [![[3 with combining macron]](https://www.rsc.org/images/entities/char_0033_0304.gif) 02] crystallographic axis, being the linear compressibility along this direction more than two times than the minimum compressibility (see Table 8). On the other hand, the direction of minimum compressibility is nearly parallel to the [403] crystallographic axis. From PASCAL41 we have obtained a bulk modulus of 101.6(5) GPa, which is in agreement with the result obtained from our EOS analysis.
02] crystallographic axis, being the linear compressibility along this direction more than two times than the minimum compressibility (see Table 8). On the other hand, the direction of minimum compressibility is nearly parallel to the [403] crystallographic axis. From PASCAL41 we have obtained a bulk modulus of 101.6(5) GPa, which is in agreement with the result obtained from our EOS analysis.
Additional information on the structural changes induced by pressure can be obtained by the analysis of coordination polyhedra. In the Table 9 we report the calculated average bond distances (Zn–O and V–O) of the different phases at ambient pressure. We also include other parameters relevant for the polyhedra like the distortion index and coordination number (CN). There it can be seen that the transition from α to β involves little changes in the coordination polyhedra. In fact, the transition can be related to a tilting of ZnO5 polyhdra of the α-phase, which favour formation of ZnO6 distorted octahedra in the β-phase, with four short equatorial bonds (∼2.05 Å) and two long apical distances (∼2.4 Å). Thus the effective coordination number (as defined by Hoppe et al.45) of ZnO6 in the β-phase is smaller than five (4.92), as in the α-phase. Thus the above mentioned transition only requires small collective displacements of atoms, being probably a displacive transition. In contrast, all the rest of the HP phases involve an abrupt increase of the coordination number (CN) of Zn atoms, which have a truly octahedral coordination in the γ- δ-, and κ-phases, with an effective CN larger than five and in cases close to six. Such a change in the sphere of coordination of Zn will imply a very important structural reorganization, being probably the transition reconstructive. This observation supports the existence of a kinetic barrier for the proposed reconstructive α–γ transition, blocking this transition and allowing the occurrence of the displacive α–β transition. Another important fact to highlight is that the Zn coordination in the β-phase gradually increases under compression, reaching a value of 5.3 a 4 GPa, which is a coordination number closer to that of Zn in the γ-phase. Therefore, the β-phase probably plays the role of a bridge metastable phase between α and γ, which is fully consistent with the kinetic barrier argument.
| Sample | Zn–O | Distortion | CN | V–O | Distortion | CN |
|---|---|---|---|---|---|---|
| α | 2.0327 | 0.0216 | 4.89 | 1.7161 | 0.0204 | 3.90 |
| β | 2.1924 | 0.0675 | 4.92 | 1.6334 | 0.0140 | 3.97 |
| γ | 2.0856 | 0.0229 | 5.79 | 1.6998 | 0.0328 | 3.81 |
| δ | 2.4225 | 0.0620 | 5.22 | 1.9212 | 0.0738 | 4.51 |
| κ | 2.0556 | 0.0131 | 5.96 | 1.7350 | 0.0313 | 3.83 |
If we look to the V coordination polyhedron, in Table 6 it can be seen that most structures have V atoms in the tetrahedral coordination as in the α-phase. Only the δ-phase shows a change in the V polyhedra. In this structure V is in octahedral coordination, being the effective CN 4.5. Such a change in the V coordination is quite unusual at pressure below 10 GPa (ref. 8) and could involve quite large kinetic barriers, requesting therefore the phase transition the simultaneous application of pressure and temperature. On the other hand, by compression at room temperature, more probably the γ–κ transition will be observed instead of the γ–δ transition. Future experiments should be performed to test these predictions.
3.3 Electronic properties
In addition to the structural study, we have explored the influence of pressure in the electronic properties of Zn2V2O7. The calculate band structure and electronic DOS for the different phases are shown in Fig. 8–12. We have found that at ambient pressure Zn2V2O7 is an indirect gap material with a wide band gap. The calculated value of the band-gap energy (Eg) at ambient pressure using B3LYP is 4.2 eV. Using HSE06 we obtained 3.98 eV and using PBE we obtained 2.29 eV. The B3LYP and HSE06 values are slightly larger than the experimental value determined from photoluminescence (3.5 eV).16 This ultraviolet band-gap of Zn2V2O7 has been challenged by diffuse-reflectance measurements14 and calculations.13–15 Previous calculations have estimated the band-gap energy of the α-phase to be 2.5 eV and reflectance experiments report a band gap 2.86 eV.13–15 However, the are several facts that points towards a band-gap underestimation in reflectance measurements and previous calculations. A first fact is that the reflectance measurements were performed in doped samples which might induce a sub-bandgap optical absorption.46 A second fact that reflectance measurements only give a lower limit for Eg (ref. 46) and not to the fundamental band-gap. On the other hand, previous calculations have been carried out using the PBE functional, which is known to underestimate the band gap of vanadates.47 These reasons and the present calculations indicate that the most correct determination of the band-gap is 3.5 eV. This is supported not only our calculations but also by the white color of Zn2V2O7. In Table 10 we report the calculated Eg for different phases. There it can be seen that the PBE functional considerably underestimate Eg, as expected,40,47 while HSE06 functional provides Eg values intermediate between B3LYP and PBE formulations, which only deviate by 10% from the experimental value. The fact that PBE underestimate the band-gap energy by approximately 1 eV (in our and previous studies13) is consistent with recent studies from related vanadates,47 which showed that the Hubbard U contribution should be included in PBE calculations to properly describe electronic structures of multiple vanadates.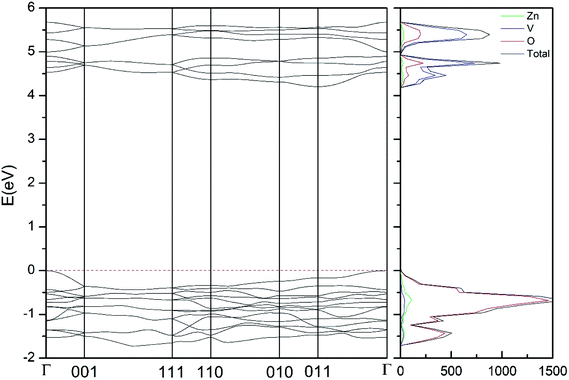 | ||
| Fig. 8 Band structure and DOS of the α-phase calculated at ambient pressure with the B3LYP potential. | ||
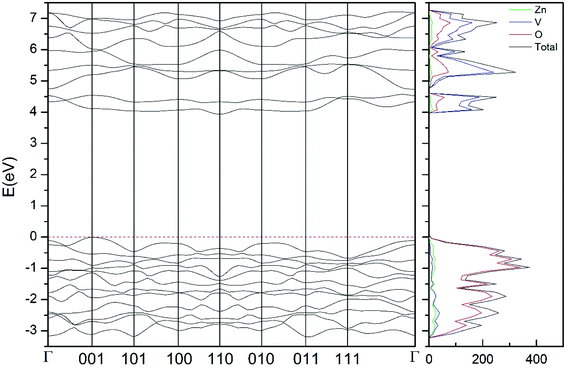 | ||
| Fig. 9 Band structure and DOS of the β-phase calculated at ambient pressure with the B3LYP potential. | ||
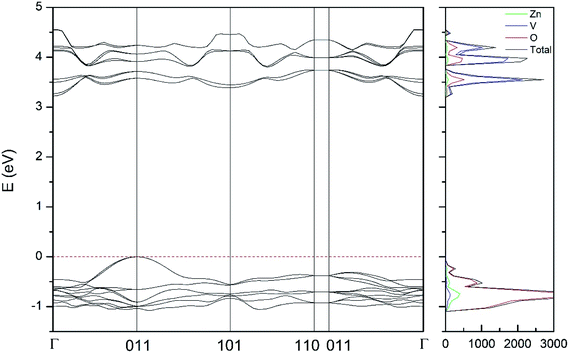 | ||
| Fig. 10 Band structure and DOS of the δ-phase calculated at ambient pressure with the B3LYP potential. | ||
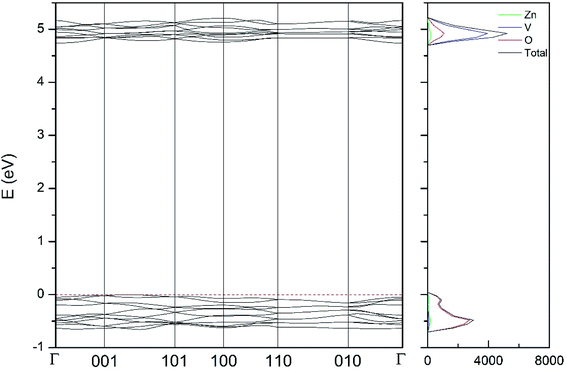 | ||
| Fig. 11 Band structure and DOS of the κ-phase calculated at ambient pressure with the B3LYP potential. | ||
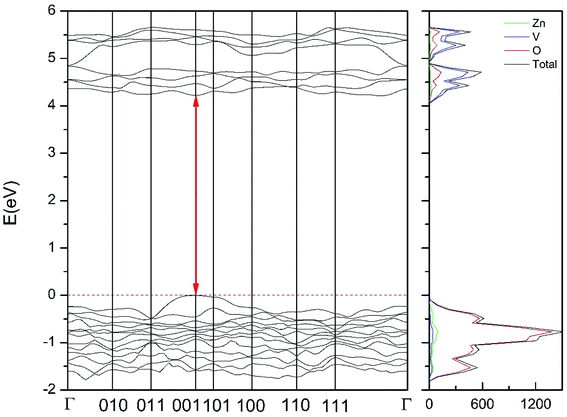 | ||
| Fig. 12 Band structure and DOS of the γ-phase calculated at ambient pressure with the B3LYP potential. The red line with arrows shows the direct band gap. | ||
As can be seen in Fig. 8, we have found that α-Zn2V2O7 has an indirect band gap. The position of the maximum of the valence band (VB) and the minimum of the conduction band (CB) are given in Table 10. We have also found that most relevant phases are indirect materials and have a large band gap (see Table 10 and Fig. 8–12). The only exception is γ-Zn2V2O7, which is a wide gap material but with a direct band gap at ambient pressure. From the calculated partial electronic DOS we have found that the states at the top of the VB are dominated by O 2p orbitals, while the states near the bottom of the CB are dominated by V 3d orbitals, which are partially hybridized with O 2p orbitals. The Zn states have a negligible contribution to the states near the Fermi level. This feature is common to α-, β-, γ-, δ-, and κ-phases. It is also similar to the topology of the band structure of ZnV2O6.7 In fact, it is not surprising that the different polymorphs of zinc vanadates have energy band gap in the 3–4 eV region, and that this value is comparable to the band-gap energy of multiple orthovanadates.48 This is not a mere coincidence, but a consequence of the fact than Zn orbitals (or those from equivalent cations) have little influence in the states near the Fermi level, being them dominated by V and O orbitals as described above.
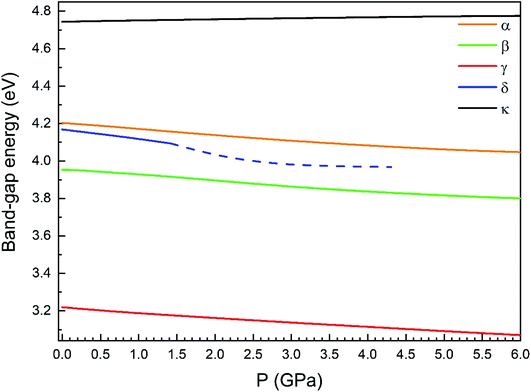
Regarding the influence of pressure in band structure of different polymorph, we have found that in most polymorphs pressure modifies the band-gap energy but does not change the topology of the band structure. Only in the case of γ-Zn2V2O7 we found that pressure induces a band crossing, changing at 1.5 GPa the nature of the bang gap from direct (top of the valence band and bottom of the conduction band at 001) to indirect (010 becomes the absolute minimum of the conduction band at 1.5 GPa). To illustrate this fact, we show in Fig. 13 the calculated band structure at 4 GPa of γ-Zn2V2O7, which can be compared with its band structure at ambient pressure, shown in Fig. 12. The distortion of the topology of the band structure of triclinic γ-Zn2V2O7 and the observed band crossing could be probably related to the non-linear behavior of unit-cell parameters in this polymorph that we previously described (see Fig. 6).
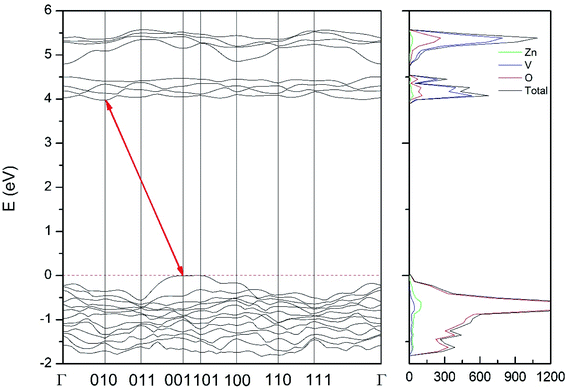 | ||
| Fig. 13 Band structure and DOS of the γ-phase calculated at 4 GPa with the B3LYP potential. The red line with arrows shows the indirect band gap. | ||
Regarding the evolution of the gap, in Fig. 14 it can be seen that in most phases Eg decreases under compression, as also happens for ZnV2O6.7 The pressure dependence of Eg in the different phases can be described as nearly linear function, with the only exception of the triclinic γ-phase which shows a non-linear behavior caused by the previously described band crossing. The pressure coefficients at zero pressure (dEg/dP) are summarized in Table 10. In all the phases, except in the κ-phase the band-gap decreases with pressure. In the α-, β-, and δ-phase the pressure coefficients are similar, but in the γ-phase the pressure coefficient doubles the value of the same parameter in the other three phases. In contrast, in the κ-phase the pressure coefficient has not only the opposite sign (the gap opens under compression), but the absolute value is very small. The closing of the gap with pressure in most of the polymorphs is an indication of the enhancement under compression of the hybridization between V 3d and O 2p orbitals. In the case of the κ-phase the band-gap increases under pressure because of the increase of repulsion between bonding and antibonding states. Such repulsion is what makes this phase to be the one with the largest band gap. In the pressure-range of this study, Zn2V2O7 is a wide band-gap material with an ultraviolet band gap.
Since the different polymorphs of Zn2V2O7 have very different compressibilities (see Table 7), in addition of comparing changes induced by pressure in the band-gap energy, it is interesting to compare changes of the band-gap energy with volume changes. This can be done by introducing a parameter equivalent to the Grüneisen parameter, which we will name as band-gap Grüneisen parameter (γgap) and it is defined as  , where B0 is the bulk modulus. This parameter describes the effect that changing the volume of the crystal lattice has on band-gap energy. The values obtained for γgap are given in Table 10. There is can be seen that influence of volume change in the band-gap energy decrease following the sequence γ → δ → β → α → κ. The γgap value obtained for the κ-phase is comparable with values from orthovanadates (e.g. CrVO4 and PrVO4).49,50 The larger sensitivity of the band-gap of other phases of Zn2V2O7 to volume changes in comparison with the κ-phase and other vanadates is an indication that pressure considerably affect orbital hybridization in the α-, β-, γ-, and δ-phase of Zn2V2O7.
4. Conclusions
In this work by means of density-functional theory calculations we have studied the high-pressure behavior of zinc pyrovanadate (Zn2V2O7). After considering three different functionals we have found that B3LYP is the one that describe better the crystal structure of Zn2V2O7. Our calculations predict the existence of three phase transitions for pressure smaller than 10 GPa, which contributes to the understanding of previous experimental findings.7 The predicted phase transition sequence is α–γ–κ being all the phases in the structural sequence either monoclinic or triclinic. The β-phase found in experiments is very close in enthalpy to the γ-phase. The presence of kinetic barriers has been proposed as the possible reason of the existence of β-Zn2V2O7 as an intermediate phase between the α and γ polymorphs. The compressibility of the different phases has been also studied, being found that Zn2V2O7 is much more compressible than other vanadates. In addition, the response to pressure is found to be non-isotropic. For the different polymorphs, the anisotropy has been discussed in detail, being the principal compression axis determined. Finally, the band-structure and electronic density of states of the different phase have been obtained. All the phases of Zn2V2O7 are found to have a large band gap. Not only the band-gap energy but its pressure dependence is reported. Explanations for the observed phenomena are provided together with a comprehension with previous studies in Zn2V2O7 and related compounds.Author contributions
All authors have contributed equally to this work.Conflicts of interest
There are no conflicts to declare.Acknowledgements
The authors thank the financial support from the Spanish Ministerio de Ciencia, Innovacion y Universidades, Spanish Research Agency (AEI), Generalitat Valenciana, and European Fund for Regional Development (ERDF, FEDER) under grants no. PGC2018-094417-B-I00, PID2019-106383GB-C41, RED2018-102612-T (MALTA Consolier Team), and Prometeo/2018/123 (EFIMAT). D. D.-A. acknowledges the PhD fellowship granted by Generalitat Valencia (ACIF/2020/009). The authors also thank MALTA for allocating computational time at the MALTA computer cluster. D. E. acknowledge the computer resources, technical expertise, and assistance provided by the Tirant supercomputer facility at Universitat de Valencia.References
- S. Ashrafi, M. Mousavi-Kamazani, S. Zinatloo-Ajabshir and A. Asgharic, Novel sonochemical synthesis of Zn2V2O7 nanostructures for electrochemical hydrogen storage, Int. J. Hydrogen Energy, 2020, 41, 21611–21624 CrossRef.
- H. Sameie, A. A. Sabbagh Alvani, N. Naseri, S. Du and F. Rosei, First-principles study on ZnV2O6 and Zn2V2O7: Two new photoanode candidates for photoelectrochemical water oxidation, Ceram. Int., 2018, 44, 6607–6613 CrossRef CAS.
- H. Liu and Y. Cui, Microwave-assisted hydrothermal synthesis of hollow flower-like Zn2V2O7 with enhanced cycling stability as electrode for lithium ion batteries, Mater. Lett., 2018, 228, 369–371 CrossRef CAS.
- Y. D. Li, Y. F. Teng, Z. Q. Zhang, Y. Feng, P. Xue, W. M. Tong and X. Y. Liu, Microwave-assisted synthesis of novel nanostructured Zn3(OH)2V2O7·2H2O and Zn2V2O7 as electrode materials for supercapacitors, New J. Chem., 2017, 41, 15298–15304 RSC.
- D. Diaz-Anichtchenko, R. Turnbull, E. Bandiello, S. Anzellini and D. Errandonea, High-Pressure Structural Behavior and Equation of State of Kagome Staircase Compound, Ni3V2O8, Crystals, 2020, 10, 910 CrossRef CAS.
- Z. Chen, W. Huang, D. Lu, R. Zhao and H. Chen, Hydrothermal synthesis and electrochemical properties of crystalline Zn2V2O nanorods, Mater. Lett., 2013, 107, 35–38 CrossRef CAS.
- D. Díaz-Anichtchenko, D. Santamaria-Perez, T. Marqueño, J. Pellicer-Porres, J. Ruiz-Fuertes, R. Ribes, J. Ibañez, S. N. Achary, C. Popescu and D. Errandonea, Comparative study of the high-pressure behavior of ZnV2O6, Zn2V2O7 and Zn3V2O8, J. Alloys Compd., 2020, 837, 155505 CrossRef.
- D. Errandonea, High pressure crystal structures of orthovanadates and their properties, J. Appl. Phys., 2020, 128, 040903 CrossRef CAS.
- A. Beltrán, L. Gracia and J. Andrés, Polymorphs of ZnV2O6 under Pressure: A First-Principle Investigation, J. Phys. Chem. C, 2019, 123, 3239–3253 CrossRef.
- S. Lopez-Moreno, D. Errandonea, P. Rodríguez-Hernández and A. Muñoz, Polymorphs of CaSeO4 under Pressure: A First-Principles Study of Structural, Electronic, and Vibrational Properties, Inorg. Chem., 2015, 54, 1765–1777 CrossRef CAS PubMed.
- A. Benmakhlouf, D. Errandonea, M. Bouchenafa, S. Maabed, A. Bouhemadou and A. Bentabet, New pressure-induced polymorphic transitions of anhydrous magnesium sulfate, Dalton Trans., 2017, 46, 5058–5068 RSC.
- D. Errandonea, L. Gracia, R. Lacomba-Perales, A. Polian and J. C. Chervin, Compression of scheelite-type SrMoO4 under quasi-hydrostatic conditions: Redefining the high-pressure structural sequence, J. Appl. Phys., 2013, 113, 123510 CrossRef.
- Y. Yan, Y. Yu, D. Wu, Y. Yang and Y. Cao, TiO2/vanadate (Sr10V6O25, Ni3V2O8, Zn2V2O7) heterostructured photocatalysts with enhanced photocatalytic activity for photoreduction of CO2 into CH4, Nanoscale, 2016, 8, 949–958 RSC.
- Y. A. González-Rivera, A. N. Meza-Rocha, L. Aquino-Meneses, S. Jiménez-Sandoval, E. Rubio-Rosas, U. Caldiño, E. Álvarez, O. Zelaya-Angel, M. Toledo-Solano and R. Lozada-Morales, Photoluminescent and electrical properties of novel Nd3+ doped ZnV2O6 and Zn2V2O7, Ceram. Int., 2016, 42, 8425–8430 CrossRef.
- Y. Guan, Y. Cheng, Y. Huang, T. Tsuboi, W. Huang, P. Cai and H. J. Seo, Spectral conversion from ultraviolet to near infrared in Yb3+-doped pyrovanadate Zn2V2O7 Particles, J. Am. Ceram. Soc., 2014, 97, 3202–3207 CrossRef CAS.
- S. P. Kuang, Y. Menga, Y. Liua, Z. C. Wua and L. S. Zhao, A new self-activated yellow emitting phosphor Zn2V2O7 for white LED, Optik, 2013, 124, 5517–5519 CrossRef CAS.
- R. Dovesi, V. R. Saunders, C. Roetti, R. Orlando, C. M. Zicovich-Wilson, F. Pascale, B. Civalleri, K. Doll, N. M. Harrison, I. J. Bush, P. D'Arco, M. Llunell, M. Causà and Y. Noë, CRYSTAL14 User's Manual, University of Torino, Torino, 2014 Search PubMed.
- A. D. Becke, Density-functional thermochemistry. III. The role of exact exchange, J. Chem. Phys., 1993, 98, 5648–5652 CrossRef CAS.
- C. Lee, W. Yang and R. G. Parr, Development of the Colle-Salvetti correlation-energy formula into a functional of the electron density, Phys. Rev. B, 1988, 37, 785–789 CrossRef CAS PubMed.
- J. Heyd, G. E. Scuseria and M. Erratum Ernzerhof, Hybrid functionals based on a screened Coulomb potential, J. Chem. Phys., 2003, 118, 8207–8215 CrossRef CAS.
- J. P. Perdew and Y. Wang, Accurate and simple analytic representation of the electron-gas correlation energy, Phys. Rev. B, 1992, 45, 13244–13249 CrossRef PubMed.
- http://www.crystal.unito.it/basis-sets.php/.
- D. Errandonea and F. J. Manjón, Pressure effects on the structural and electronic properties of ABX4 scintillating crystals, Prog. Mater. Sci., 2008, 53, 711–773 CrossRef CAS.
- R. Gopal and C. Calvo, Crystal structure of α – Zn2V2O7, Can. J. Chem., 1973, 51, 1004–1009 CrossRef CAS.
- P. K. L. Au and C. Calvo, Crystal structure of Cd2V2O7, Can. J. Chem., 1967, 45, 2297–2302 CrossRef CAS.
- R. Gopal and C. Calvo, Crystal structure of magnesium divanadete Mg2V2O7, Acta Crystallogr. B, 1974, 30, 2491–2493 CrossRef.
- M. Quarton, J. Angenault and A. Rimsky, Structure cristalline de alpha-Hg2V2O7, Acta Crystallogr. B, 1973, 29, 567–573 CrossRef CAS.
- R. D. Shannon and C. Calvo, Refinement of the Crystal Structure of Synthetic Chervetite, Pb2V2O7, Can. J. Chem., 1973, 51, 70–76 CrossRef CAS.
- A. A. Vedernikov, Y. A. Velikodnyi, V. V. Lliyukhin and V. K. Trunov, Crystal structure of strontium diorthovanadate Hg2V2O7, Sov. Phys. Dokl., 1982, 27, 180–181 Search PubMed.
- U. G. Nielsen, H. J. Jakobsen, J. Skibsted and P. Norby, Crystal structure of α-Mg2V2O7 from synchrotron X-ray powder diffraction and characterization by 51V MAS NMR spectroscopy, Dalton Trans., 2001, 21, 3214–3218 RSC.
- C. Freysoldt, B. Grabowski, T. Hickel, J. Neugebauer, G. Kresse, A. Janotti and C. G. van de Walle, First-principles calculations for point defects in solids, Rev. Mod. Phys., 2014, 86, 253–305 CrossRef.
- S. Grimme, Semiempirical GGA-type density functional constructed with a long-range dispersion correction, Journal Computing Chemistry, 2006, 27, 1787–1799 CrossRef CAS PubMed.
- F. Birch, Elasticity and constitution of the Earth's interior, J. Geophys. Res., 1952, 57, 227–286 CrossRef CAS.
- E. Bandiello, D. Errandonea, J. Pellicer-Porres, A. B. Garg, P. Rodriguez-Hernandez, A. Muñoz, D. Martinez-Garcia, R. Rao and C. Popescu, Effect of High pressure on the crystal structure and vibrational properties of olivine-type LiNiPO4, Inorg. Chem., 2018, 57, 10265–10276 CrossRef CAS PubMed.
- D. Errandonea, O. Gomis, D. Santamaría-Perez, B. García-Domene, A. Muñoz, P. Rodríguez-Hernández, S. N. Achary, A. K. Tyagi and C. Popescu, Exploring the high-pressure behaviour of the three known polymorphs of BiPO4: Discovery of a new polymorph, J. Appl. Phys., 2015, 117, 105902 CrossRef.
- T. I. Krasnenko, V. G. Zubkov, A. P. Tyutyunnik, L. V. Zolotukhina and E. F. Vasyutinskaya, Crystal structure of β-Zn2V2O7, Crystallogr. Rep., 2003, 48, 35–38 CrossRef CAS.
- J. Gonzalez-Platas, S. Lopez-Moreno, E. Bandiello, M. Bettinelli and D. Errandonea, Precise Characterization of the Rich Structural Landscape Induced by Pressure in Multifunctional FeVO4, Inorg. Chem., 2020, 59, 6623–6630 CrossRef CAS PubMed.
- T. Ouahrani, F. Z. Medjdoub, S. Gueddida, A. Lobato Fernandez, R. Franco, N. E. Benkhettou, M. Badawi, A. Liang, J. Gonzalez and D. Errandonea, Understanding the pressure effect on the elastic, electronic, vibrational, and bonding properties of the CeScO3 perovskite, J. Phys. Chem. C, 2021, 125, 107–119 CrossRef CAS.
- K. S. Knight, Analytical expressions to determine the isothermal compressibility tensor and the isobaric thermal expansion tensor for monoclinic crystals: application to determine the direction of maximum compressibility in jadeite, Physical Chemical Minerals, 2010, 37, 529–533 CrossRef CAS.
- R. Turnbull, D. Errandonea, V. P. Cuenca-Gotor, J. A. Sans, O. Gomis, A. Gonzalez, P. Rodríguez-Hernandez, C. Popescu, M. Bettinelli, K. K. Mishra and F. J. Manjon, Experimental and theoretical study of dense YBO3 and the influence of non-hydrostaticity, J. Alloys Compd., 2021, 850, 156562 CrossRef CAS.
- M. J. Cliffe and A. L. Goodwin, PASCAL: a principal axis strain calculator for thermal expansion and compressibility determination, J. Appl. Crystallogr., 2012, 45, 1321–1329 CrossRef CAS.
- H. Kimizuka, S. Ogata and Y. Shibutani, High-pressure elasticity and auxetic property of α-cristobalite, Mater. Trans., 2005, 46, 1161–1166 CrossRef CAS.
- K. Adachi, H. Ogi, N. Takeuchi, N. Nakamura, H. Watanabe, T. Ito and Y. Ozaki, Unusual elasticity of monoclinic β-Ga2O3, J. Appl. Phys., 2018, 124, 085102 CrossRef.
- J. Singh, V. K. Sharma, V. Kanchana, G. Vaitheeswaran and D. Errandonea, High-pressure structural, lattice dynamics, and electronic properties of beryllium aluminate studied from first-principles theory, Mater. Today Commun., 2020, 101801 Search PubMed.
- R. Hoppe, S. Voigt, H. Glaum, J. Kissel, H. P. Müller and K. Bernet, A new route to charge distributions in ionic solids, J. Less Common. Met., 1989, 156, 105–122 CrossRef CAS.
- P. Botella, D. Errandonea, A. B. Garg, P. Rodriguez-Hernandez, A. Muñoz, S. N. Achary and A. Vomiero, High-pressure characterization of the optical and electronic properties of InVO4, InNbO4, and InTaO4, SN Applied Sciences, 2019, 1, 389 CrossRef.
- R. Schira and C. Latouche, DFT an hybrid-DFT calculations on the electronic properties of vanadate materials: theory meets experiments, New J. Chem., 2020, 44, 11602–11607 RSC.
- D. Errandonea and A. B. Garg, Recent progress on the characterization of the high-pressure behaviour of AVO4 orthovanadates, Prog. Mater. Sci., 2018, 97, 123–169 CrossRef CAS.
- P. Botella, S. López-Moreno, D. Errandonea, F. J. Manjón, J. A. Sans, D. Vie and A. Vomiero, High-pressure characterization of multifunctional CrVO4, J. Phys. Condens. Matter, 2020, 32, 385403 CrossRef CAS PubMed.
- E. Bandiello, C. Popescu, E. Lora da Silva, J. A. Sans, D. Errandonea and M. Bettinelli, PrVO4 under high pressure: Effects on structural, optical, and electrical properties, Inorg. Chem., 2020, 59(24), 18325–18337 CrossRef CAS PubMed.
| This journal is © The Royal Society of Chemistry 2021 |

