 Open Access Article
Peroxymonosulfate activation by tea residue biochar loaded with Fe3O4 for the degradation of tetracycline hydrochloride: performance and reaction mechanism
Qirui Wang,
Yixuan Shi,
Shiyi Lv,
Ying Liang and
Pengfei Xiao *
*
College of Forestry, Northeast Forestry University, Harbin 150040, China. E-mail: xpfawd@nefu.edu.cn
First published on 22nd May 2021
Abstract
The recycling of agricultural and food waste is an effective way to reduce resource waste and ameliorate the shortage of natural resources. The treatment of antibiotic wastewater is a current research hotspot. In this study, waste tea residue was used as a raw material to prepare biochar (T-BC) and loaded with Fe3O4 as a catalyst to activate peroxymonosulfate (PMS) for oxidative degradation of tetracycline hydrochloride (TCH). Analysis techniques such as BET, SEM, XRD, FT-IR, XPS and VSM indicated that the heterogeneous catalyst (Fe3O4@T-BC) with good surface properties and magnetic properties was successfully prepared. The results of batch-scale experiments illustrated that when the dose of the Fe3O4@T-BC catalyst was 1 g L−1, the concentration of PMS was 1 g L−1, and the initial pH was 7, the degradation rate of TCH with a concentration of 50 mg L−1 reached 97.89% after 60 minutes of reaction. When the initial pH was 11, the degradation rate of TCH reached 99.86%. After the catalyst was recycled four times using an external magnet, the degradation rate of TCH could still reach 71.32%. The data of removal of TCH could be best fitted by a pseudo-first-order model. The analysis of the degradation mechanism through a free radical quenching experiment and EPR analysis, as well as the exploration of TCH intermediate products and reaction paths through the LC-MS method, all confirmed that the Fe3O4@T-BC prepared by this method is expected to become a cost-effective and environmentally friendly heterogeneous catalyst for activating persulfate degradation of tetracycline antibiotics.
1. Introduction
Because of the deterioration of the ecological environment and the shortage of natural resources, the recycling of agricultural and food waste has received extensive attention in the reduction of wasting resources and saving material costs.1 Tea is the second most popular beverage in the world, and its consumption is second only after water. As a significant tea-drinking country, China's tea consumption is among the highest in the world, and national tea production reached more than 2.8 million tons in 2019.2 With the rapid development of the tea industry, a large amount of waste tea residue is generated every year, most of which is treated and disposed of as waste, resulting in a large waste of resources. Therefore, it is urgent to explore new ways to make tea dregs fully utilized. Recently, the use of tea dregs as a raw material to make biochar has become an important method for its resource utilization,3 and its applications in the environmental field have gradually increased.4 However, most of these applications rely on its adsorption capacity as an adsorbent to remove heavy metal ions,5 inorganic pollutant ions,6 and organic pollutants7 in wastewater. There are few studies on using tea residue biochar as a carrier of metal oxides to activate persulfate to degrade organic pollutants synergistically.Antibiotics used to treat various bacterial and pathogen infections are widely used in livestock and poultry breeding and pharmaceutical industries. They have a wide variety and complex structure, and difficult to degrade.8 The potential toxicity, teratogenicity and genotoxicity of antibiotics remaining in the aquatic environment to humans and aquatic organisms have attracted widespread attention as severe environmental concerns.9 Among them, tetracycline antibiotics are broad-spectrum antibiotics widely present in the environment and have the highest detection frequency. The long-term accumulation of tetracyclines can inhibit the development of young children and bone growth and seriously endanger human health.10 Therefore, it is vital to find a green and efficient way to control antibiotic pollution in the water environment.
At present, the methods for removing antibiotic pollutants in wastewater include adsorption,11 biological, ion exchange, photocatalysis,12 and advanced oxidation. In the adsorption method, the number of regeneration and utilization of the adsorbent cannot be guaranteed. The photocatalytic method requires high light transmittance of the photocatalyst, light source and water quality, which leads to poor practical application effects.13 The ion exchange method has low current efficiency, high operating costs, and secondary pollution. By contrast, based on sulfate radicals, the advanced oxidation method can decompose difficult-to-degrade organic pollutants into CO2, H2O and other small molecule compounds in a short period of time under the condition of neutral pH at normal temperature and pressure.14 Because of its high efficiency and thoroughness, simple process and lack of secondary pollution, it has received extensive attention from researchers and has broad application prospects in the field of water treatment and groundwater remediation.15 This method mainly activates peroxymonosulfate (PMS) or peroxodisulfate (PDS) through transition metal ions, high temperature, ultraviolet light or ultrasonic irradiation to produce SO4−˙, which with a strong oxidizing ability (redox potential of approximately 2.5–3.1 V) to remove organic pollutants.16 Compared with PDS with steric hindrance, the non-polar PMS with asymmetric molecular structure is more susceptible to attack by nucleophiles and more easily activated.17 And PMS will generate SO42− after its oxidation, which causes little harm to the water environment. Among the activation methods, the use of external energy such as ultrasonic and ultraviolet activation is an effective method, but the high energy consumption in the process and harsh reaction conditions hinder its large-scale application.17 Transition metals and their oxides have better activation efficiency and can be conducted with simple operation under normal temperature and pressure.18 However, due to the small particle size and high surface energy, nano metal oxides, especially magnetic particles such as Fe3O4, are prone to agglomeration and ion leaching to cause secondary pollution problems, limiting their application in practice.17 The preparation of nanometer iron oxide composite materials using porous materials as the carrier,18 can improve the dispersibility and reactivity of nanometer iron oxides and can utilize the synergistic effect of iron oxide and carrier materials to improve the removal effect of pollutants.19,20 Among them, carbon materials have shown broad application prospects in the field of catalysis by virtue of their unique nanostructure, excellent conductivity, chemical stability and adsorption characteristics. Using carbon materials as a carrier can also promote adsorption and cooperate with metal oxides to activate PMS, showing a higher activation effect.
In this study, tea residue biochar (T-BC) was prepared by high-temperature pyrolysis method using tea residue as raw material, and a series of heterogeneous catalysts (Fe3O4@T-BC) with different percentage loading of Fe3O4 were prepared by the impregnation–coprecipitation method. With tetracycline hydrochloride (TCH) as the target pollutant, Fe3O4@T-BC is used as an activator to activate peroxymonosulfate to degrade TCH oxidatively. The catalyst materials were tested and evaluated, including surface morphology, crystal structure, phase composition, and recycling characteristics. To find the best degradation conditions for TCH, the effects of various parameters, such as catalyst dosage, initial TCH concentration, PMS concentration, initial pH, and inorganic anions, on the degradation effect of tetracycline were explored. More importantly, in order to further confirm the superiority of the application of the catalyst Fe3O4@T-BC prepared in this research in activating PMS to degrade TCH, the following research is also conducted: first, through free radical quenching experiment and EPR analysis aimed to determine the activated species and participating mechanisms. Second, by using LC-MS to analyze the intermediate products, this research also discussed the possible reaction pathways and mechanism of action of the catalytic degradation system. Third, the reusability of the catalyst was studied. This research is expected to provide a scientific basis and theoretical support for the further application of this technology in antibiotic wastewater treatment.
2. Experimental
2.1 Chemicals and reagents
Tetracycline hydrochloride (C22H25N2O8Cl, 96%), potassium monopersulfate (KHSO5·0.5KHSO4·0.5K2SO4, ≥42% KHSO5 basis), sodium hydroxide (NaOH, 96%), ethanol (EtOH, AR, ≥99.5%), tert-butanol (TBA, GR, ≥99.5%), furfuryl alcohol (FFA, CP, 97%), p-benzoquinone (p-BQ, 99%), ferric chloride (FeCl3·6H2O, AR, 99%), ferrous sulfate (FeSO4·7H2O, AR, 99%), sodium carbonate (Na2CO3, 99.8%), sodium sulfate (Na2SO4, AR, 99%), sodium chloride (NaCl, 99.5%), sodium bicarbonate (NaHCO3, 99.5%) and sodium acetate (CH3COONa, AR) were purchased from Aladdin Shanghai. In the experimental process, all the reagents were analytically pure, and the water for dilution and dissolution was ultrapure water.2.2 Preparation of catalysts
The feedstock for catalyst preparation was tea residues (the tea leaf that was used) collected from the Northeast Forestry University campus drink shops. After being washed with ultrapure water several times, the clean tea residues were dried at 60 °C in an oven. Then, the dry tea residues were pyrolyzed at 500 °C in a muffle furnace under oxygen-limited conditions with a retention time of 2 h, ground with a mortar and passed through a 100-mesh sieve. Finally, the biochar was washed with ultrapure water several times to remove ash produced by pyrolysis, dried at 60 °C for 12 h and labeled T-BC.Using T-BC as the raw material, iron oxide-modified biochar of origin was prepared by the impregnation–coprecipitation method. The synthesis procedure of Fe3O4@T-BC was described as follows: 2 g T-BC was dispersed into 30 mL ultrapure water and placed in a magnetic stirrer. Next, 10 mL mixed solutions containing 0.25 M FeSO4·7H2O and 0.5 M FeCl3·6H2O (volume ratio of 1![[thin space (1/6-em)]](https://www.rsc.org/images/entities/char_2009.gif) :
:![[thin space (1/6-em)]](https://www.rsc.org/images/entities/char_2009.gif) 1) were rapidly added into the above solution. After being sealed, the mixture was stirred evenly and then soaked for 0.5 h. Afterwards, 5 M NaOH was added dropwise at a constant speed into the mixture until the pH rose to approximately 10–11 with a black precipitate generated. Stir for another 1 h before setting for approximately 2 h at 80 °C. Finally, the black solid was separated and washed with ultrapure water until a neutral pH was achieved, dried at 60 °C for 12 h and stored in an airtight container.
1) were rapidly added into the above solution. After being sealed, the mixture was stirred evenly and then soaked for 0.5 h. Afterwards, 5 M NaOH was added dropwise at a constant speed into the mixture until the pH rose to approximately 10–11 with a black precipitate generated. Stir for another 1 h before setting for approximately 2 h at 80 °C. Finally, the black solid was separated and washed with ultrapure water until a neutral pH was achieved, dried at 60 °C for 12 h and stored in an airtight container.
2.3 Experimental procedures
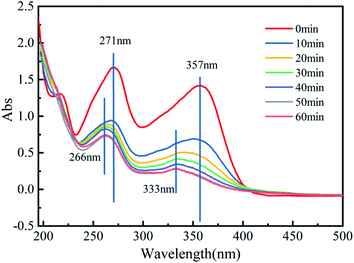
In all batch trials, the TCH removal experiments were conducted in a series of 100 mL conical flasks. Fifty milliliters of PMS solution was placed in a flask containing 50 mL of TCH solution, then the catalyst (Fe3O4@T-BC) was rapidly added to the reactors, and the glass vials were capped tightly. The conical flasks were placed in a thermostatic air bath shaker at 25 °C to initiate the reaction. During the reaction, 3 mL of sample supernatant was filtered through a 0.45 μm filter into a cuvette every 10 min, and the supernatant was immediately analyzed to determine the residual TCH concentration using a UV-Vis spectrophotometer at 357 nm.14 Single-variable control trials were carried out to research and optimize the removal conditions, including initial pH (3.0–11.0), initial TCH concentration (25–100 mg L−1), PMS concentration (0.5–2.0 g L−1), Fe3O4@T-BC dosage (0.2–1.0 g L−1) and reaction time (0–60 min). The initial solution pH was adjusted with 0.1 M HCl or 0.1 M NaOH. The experiments with catalyst and PMS were set as the blank.In the free radical quenching experiments, EtOH was used to quench both SO4−˙ and ˙OH.21 TBA was used to quench ˙OH.22 FFA was used to quench 1O2.23 p-BQ was used to quench ˙O2−.24 In the experiment, TCH solution, Fe3O4@T-BC, quencher (ethanol, tert-butanol, furfuryl alcohol or p-benzoquinone) and PMS solution were sequentially added to the conical flask. The conditions for each test were controlled as follows: system volume = 100 mL, [TCH] = 50 mg L−1, Fe3O4@T-BC dosage = 1 g L−1, [PMS] = 1 g L−1, quencher concentration = 50 mM, and reaction time = 1 h. During the reaction, samples were taken after every 10 minutes to determine the remaining TCH concentration. All reaction tests were repeated three times, and the average of the obtained results was taken for data analysis.
2.4 Analytical methods
The degradation solution of TCH was determined by UV-1800 (Mapada, China) and TU-1901 (PERSEE, China) UV-Vis spectrophotometry. Using ASAP 2460 series automatic fast physical adsorption analyzer (Micromeritics, China), the surface area, pore volume and pore size of T-BC and Fe3O4@T-BC were analyzed. The microscopic surface morphology and loading status of Fe3O4@T-BC were recorded by a su8020 field emission scanning electron microscope (SEM) (Hitachi, Japan). The microscope was coupled to a HORIBA EX250 energy dispersive spectroscopy (EDS) detector (HORIBA, Japan) for elemental analysis. The X-ray diffraction (XRD) patterns of T-BC and Fe3O4@T-BC were recorded by a TD-3500 in situ reaction X-ray powder diffractometer (Tongda, China). Use X-ray photoelectron spectrometer (XPS) (Thermo Fisher, US) to analyze the elemental composition of materials. Chemical characterizations of T-BC and Fe3O4@T-BC were carried out using iS10 FT-IR spectrometer Fourier transform infrared spectrophotometer (FT-IR) (Nicolet, US). The magnetic properties of the material are tested with the MPMS-3 magnetic measurement system (VSM) (Quantum Design, US). The electron paramagnetic resonance spectra of trapped radicals were obtained by an A300-10/12 electron paramagnetic resonance device (EPR) (Bruker, Germany), which used 5,5-dimethyl-1-pyrroline N-oxide (DMPO) and 2,2,6,6-tetramethyl-4-piperidine (TEMP) as the radical spin-trapping agents to identify the radicals generated from the Fe3O4@T-BC/PMS system. The concentration of leached iron was measured by a UV-1800 spectrophotometer at 510 nm using the 1,10-phenanthroline method. The LC-MS analysis was carried by an Ultimate 3000 UPLC with Thermo Scientific Q Exactive mass spectrometer (Thermo Fisher, US). The mineralization of TCH was determined by total organic carbon (TOC) using a TOC-L CPN analyzer (Shimadzu, Japan).3. Results and discussion
3.1 Characterization of Fe3O4@T-BC
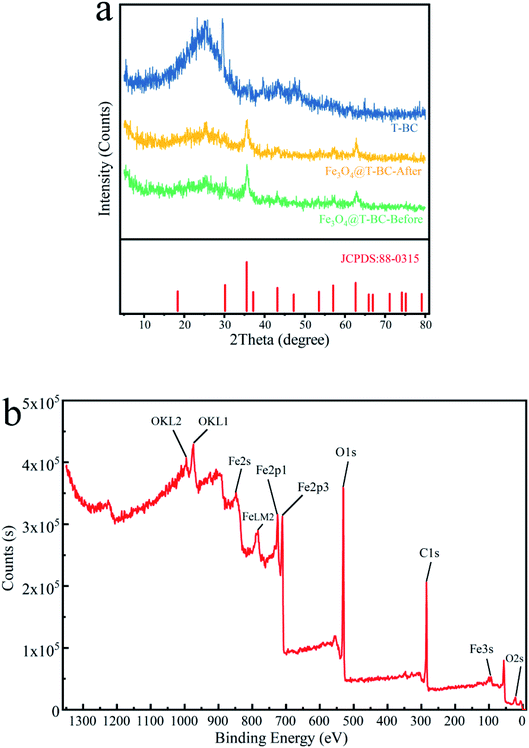
Fig. 2b shows the XPS spectrum of Fe3O4@T-BC catalyst material. It can be seen from the figure that the sample contains Fe, C and O elements, and the binding energy of Fe at 711.08 eV and 725.08 eV can be confirmed as Fe 2p3/2 and Fe 2p1/2 of Fe3O4. This is consistent with Mashesh's research conclusion.25 The peak at 284.8 eV, 530.17 eV and 711.05 eV assigned to C 1s, O 1s and Fe 2p, accounted for 43.57%, 38.53% and 17.9%, respectively.
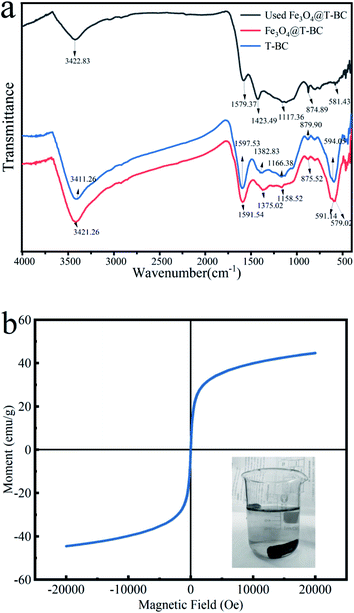
![[double bond, length as m-dash]](https://www.rsc.org/images/entities/char_e001.gif) O bond stretching.29 The peak at 594.05 cm−1 showed the presence of O–S in the infrared spectrum of T-BC, which can also be seen in the infrared spectrum of Fe3O4@T-BC.30 In addition, the difference between Fe3O4@T-BC and T-BC is that there is a strong Fe–O absorption peak at 579.02 cm−1,27 which indirectly proves that Fe3O4 was successfully synthesized on the biochar. Studies have shown that these oxygen-containing functional groups on the surface of carbon materials can directly act as catalytic sites or intermediates for electron transfer to affect the catalytic activity of biochar. First, oxygen-containing functional groups directly act as catalytic sites to activate PMS and promote pollutant degradation.31 Secondly, oxygen-containing functional groups also can be used as an electronic medium to promote the degradation of pollutants.32 In addition, oxygen-containing functional groups can also affect its catalytic activity by regulating the conductivity or surface charge of biochar.33 The FT-IR spectrum (Fig. 3a) also compares the infrared spectra before and after Fe3O4@T-BC is used. The absorption peak decreases after four cycles of Fe3O4@T-BC. In addition, after Fe3O4@T-BC participates in the catalytic degradation reaction, there is still an Fe–O absorption peak at 581.43 cm−1 in the infrared spectrum, which indicates that the Fe3O4 on the surface has not fallen off after Fe3O4@T-BC is used.
O bond stretching.29 The peak at 594.05 cm−1 showed the presence of O–S in the infrared spectrum of T-BC, which can also be seen in the infrared spectrum of Fe3O4@T-BC.30 In addition, the difference between Fe3O4@T-BC and T-BC is that there is a strong Fe–O absorption peak at 579.02 cm−1,27 which indirectly proves that Fe3O4 was successfully synthesized on the biochar. Studies have shown that these oxygen-containing functional groups on the surface of carbon materials can directly act as catalytic sites or intermediates for electron transfer to affect the catalytic activity of biochar. First, oxygen-containing functional groups directly act as catalytic sites to activate PMS and promote pollutant degradation.31 Secondly, oxygen-containing functional groups also can be used as an electronic medium to promote the degradation of pollutants.32 In addition, oxygen-containing functional groups can also affect its catalytic activity by regulating the conductivity or surface charge of biochar.33 The FT-IR spectrum (Fig. 3a) also compares the infrared spectra before and after Fe3O4@T-BC is used. The absorption peak decreases after four cycles of Fe3O4@T-BC. In addition, after Fe3O4@T-BC participates in the catalytic degradation reaction, there is still an Fe–O absorption peak at 581.43 cm−1 in the infrared spectrum, which indicates that the Fe3O4 on the surface has not fallen off after Fe3O4@T-BC is used.
![[thin space (1/6-em)]](https://www.rsc.org/images/entities/char_2009.gif) 000 and +20
000 and +20![[thin space (1/6-em)]](https://www.rsc.org/images/entities/char_2009.gif) 000 Oe at 298 K. Fig. 3b shows the magnetization curve of Fe3O4@T-BC. The curve does not show hysteresis effect and coercivity at room temperature, indicating that Fe3O4@T-BC is a superparamagnetic material with a saturation magnetization of 44.64 emu g−1. It is learned from the literature that the saturation magnetization of pure Fe3O4 particles is about 68.4 emu g−1, which is higher than the Fe3O4@T-BC prepared in this research. It may be due to the presence of non-magnetic T-BC in Fe3O4@T-BC. Studies have found that when the saturation magnetization exceeds 16.3 emu g−1, magnetic separation can be achieved by conventional magnetic separation.34 Therefore, the prepared magnetic catalyst material can be easily separated from solid and liquid by magnetic separation after participating in the reaction, and the recovery rate of the catalyst can be improved. Experiments have also found that when there is a permanent magnet nearby, Fe3O4@T-BC still exhibits a strong magnetic response, which indicates that Fe3O4@T-BC catalyst can be recycled, reduce the cost of use, and has the potential for practical application.
000 Oe at 298 K. Fig. 3b shows the magnetization curve of Fe3O4@T-BC. The curve does not show hysteresis effect and coercivity at room temperature, indicating that Fe3O4@T-BC is a superparamagnetic material with a saturation magnetization of 44.64 emu g−1. It is learned from the literature that the saturation magnetization of pure Fe3O4 particles is about 68.4 emu g−1, which is higher than the Fe3O4@T-BC prepared in this research. It may be due to the presence of non-magnetic T-BC in Fe3O4@T-BC. Studies have found that when the saturation magnetization exceeds 16.3 emu g−1, magnetic separation can be achieved by conventional magnetic separation.34 Therefore, the prepared magnetic catalyst material can be easily separated from solid and liquid by magnetic separation after participating in the reaction, and the recovery rate of the catalyst can be improved. Experiments have also found that when there is a permanent magnet nearby, Fe3O4@T-BC still exhibits a strong magnetic response, which indicates that Fe3O4@T-BC catalyst can be recycled, reduce the cost of use, and has the potential for practical application.3.2 Degradation of TCH in different systems
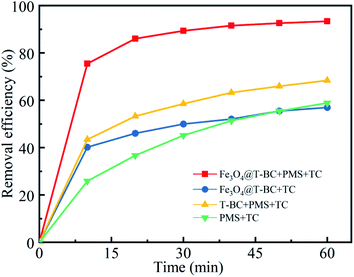
Initial assays were performed with TCH as the model compound in aqueous solution. Fig. 4 presents (1) the adsorption of TCH by Fe3O4@T-BC, (2) the degradation of TCH by PMS alone, (3) the degradation of TCH by PMS in the presence of T-BC, and (4) the degradation of TCH by PMS in the presence of Fe3O4@T-BC. The removal rate of TCH under only the Fe3O4@T-BC system reached 56.95% within 60 min. This adsorption is attributed to the loose and porous structure of Fe3O4@T-BC. However, the results showed that the TCH concentration decreased significantly only in the first ten minutes of the reaction, and there was no significant change in the TCH concentration after 30 minutes. According to Li B.,35 the reason is that the adsorption capability of Fe3O4@T-BC decreases with the increase of TCH adsorbed on Fe3O4@T-BC, and reaches adsorption saturation after 30 minutes of reaction. Only 58.89% of TCH was removed by PMS alone, which was in accordance with a previous study showing that PMS is not reactive obviously without certain activation for the degradation of tetracycline. This phenomenon was also observed in previous research.36,37 On the other hand, 68.35% of tetracycline was removed by PMS in the presence of T-BC. This adsorption is attributed to T-BC activating the degradation of TCH by persulfate. Under identical conditions, 93.50% removal of TCH could be achieved by the Fe3O4@T-BC/PMS system, and the degradation rate was as high as 75.50% in the first ten minutes of the reaction. This phenomenon was better compared with F. Shao's study, in which the highest removal efficiency was 87.58% by the nFe(0)/BC-PS system.16 The results show that the degradation rate of TCH by the Fe3O4@T-BC/PMS system is not only much higher than that of the other three systems but also faster than that of the other three systems.3.3 Experimental condition optimization
| 2S2O82− + 2H2O → 3SO42− + SO4−˙ + ˙O2− + 4H+ | (1) |
| SO4−˙ + OH− → SO42− + ˙OH | (2) |
PMS will slowly self-decompose to produce 1O2,52 which is a highly selective oxidant and the main oxidation active material produced by activating PMS, but the reaction is extremely slow and the output of 1O2 is extremely low according to Y. Qi.53 However, under alkaline conditions, Fe3O4@T-BC-activated PMS accelerates the production of 1O2 in the system; therefore, alkaline conditions can improve the degradation of TCH.
| OH− + HSO5− → SO52− + H2O | (3) |
| SO52− + HCO3− → HCO4− + SO42− | (4) |
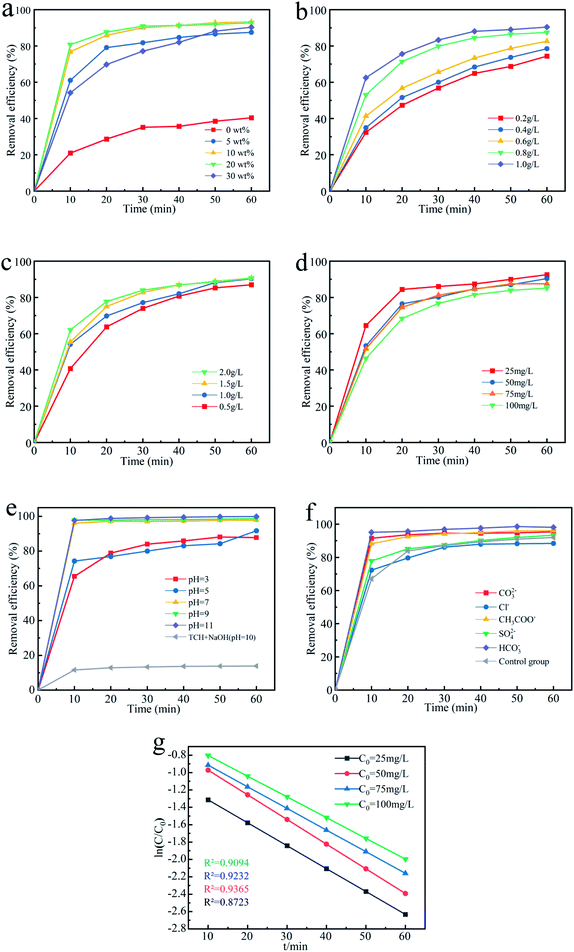
In addition, due to the effect of pH on the degradation efficiency of Fe3O4@T-BC-activated PMS, it can be seen that under alkaline conditions, it is more conducive to the degradation of TCH; thus, alkali ions can obviously promote the degradation of TCH. SO42− has almost no effect on degradation; thus, it is inferred that SO42− is not the main reactive species to degrade TCH.
| −ln(Ct/C0) = kt | (5) |
Fig. 5g shows the fitting results of pseudo-first-order kinetics of its degradation rate under different TCH concentrations. It can be seen from the figure that when the TCH concentration is 25 mg L−1, 50 mg L−1, 75 mg L−1, 100 mg L−1, the pseudo first-order degradation rate (the slope of the curve) is respectively 0.0224 min−1, 0.0234 min−1, 0.0249 min−1, 0.0252 min−1. Within a certain range, the degradation rate of TCH in the system increases with the increase of its concentration.
3.4 Reaction mechanisms
![[thin space (1/6-em)]](https://www.rsc.org/images/entities/char_2009.gif) :
:![[thin space (1/6-em)]](https://www.rsc.org/images/entities/char_2009.gif) 1
1![[thin space (1/6-em)]](https://www.rsc.org/images/entities/char_2009.gif) :
:![[thin space (1/6-em)]](https://www.rsc.org/images/entities/char_2009.gif) 1
1![[thin space (1/6-em)]](https://www.rsc.org/images/entities/char_2009.gif) :
:![[thin space (1/6-em)]](https://www.rsc.org/images/entities/char_2009.gif) 1
1![[thin space (1/6-em)]](https://www.rsc.org/images/entities/char_2009.gif) DMPO–˙O2− characteristic peak) adducts can be found, indicating the presence of ˙O2− in the system. Then, TEMP was added to another system, as shown in Fig. 7b, and the TEMP–1O2 characteristic peak with an intensity ratio of 1
DMPO–˙O2− characteristic peak) adducts can be found, indicating the presence of ˙O2− in the system. Then, TEMP was added to another system, as shown in Fig. 7b, and the TEMP–1O2 characteristic peak with an intensity ratio of 1![[thin space (1/6-em)]](https://www.rsc.org/images/entities/char_2009.gif) :
:![[thin space (1/6-em)]](https://www.rsc.org/images/entities/char_2009.gif) 1
1![[thin space (1/6-em)]](https://www.rsc.org/images/entities/char_2009.gif) :
:![[thin space (1/6-em)]](https://www.rsc.org/images/entities/char_2009.gif) 1 appeared, indicating that 1O2 also participated in the catalytic reaction. And the characteristic signal of DMPO–˙OH and DMPO–SO4−˙ adducts appeared in the Fe3O4@T-BC/PMS system (the 1
1 appeared, indicating that 1O2 also participated in the catalytic reaction. And the characteristic signal of DMPO–˙OH and DMPO–SO4−˙ adducts appeared in the Fe3O4@T-BC/PMS system (the 1![[thin space (1/6-em)]](https://www.rsc.org/images/entities/char_2009.gif) :
:![[thin space (1/6-em)]](https://www.rsc.org/images/entities/char_2009.gif) 2
2![[thin space (1/6-em)]](https://www.rsc.org/images/entities/char_2009.gif) :
:![[thin space (1/6-em)]](https://www.rsc.org/images/entities/char_2009.gif) 2
2![[thin space (1/6-em)]](https://www.rsc.org/images/entities/char_2009.gif) :
:![[thin space (1/6-em)]](https://www.rsc.org/images/entities/char_2009.gif) 1 DMPO–˙OH characteristic peak, the 1
1 DMPO–˙OH characteristic peak, the 1![[thin space (1/6-em)]](https://www.rsc.org/images/entities/char_2009.gif) :
:![[thin space (1/6-em)]](https://www.rsc.org/images/entities/char_2009.gif) 1
1![[thin space (1/6-em)]](https://www.rsc.org/images/entities/char_2009.gif) :
:![[thin space (1/6-em)]](https://www.rsc.org/images/entities/char_2009.gif) 1
1![[thin space (1/6-em)]](https://www.rsc.org/images/entities/char_2009.gif) :
:![[thin space (1/6-em)]](https://www.rsc.org/images/entities/char_2009.gif) 1
1![[thin space (1/6-em)]](https://www.rsc.org/images/entities/char_2009.gif) :
:![[thin space (1/6-em)]](https://www.rsc.org/images/entities/char_2009.gif) 1
1![[thin space (1/6-em)]](https://www.rsc.org/images/entities/char_2009.gif) :
:![[thin space (1/6-em)]](https://www.rsc.org/images/entities/char_2009.gif) 1 DMPO–SO4−˙ characteristic peak), as shown in Fig. 7c. Therefore, ˙OH and SO4−˙ were also involved in the catalytic oxidation reaction.
1 DMPO–SO4−˙ characteristic peak), as shown in Fig. 7c. Therefore, ˙OH and SO4−˙ were also involved in the catalytic oxidation reaction.
To further study the effect of free radicals in the Fe3O4@T-BC/PMS system on the degradation efficiency, quenching experiments were conducted to identify the dominant reactive radicals in the Fe3O4@T-BC/PMS system. Herein, EtOH was used to quench both SO4−˙ (kSO4−˙ = (1.6–7.7) × 107/M s) and ˙OH (k˙OH = (1.2–2.8) × 109/M s).21 TBA was used to quench ˙OH (k˙OH = (3.8–7.6) × 108/M s).22 FFA was used to quench 1O2 (k1O2 = 1.2 × 10⁸/M s).23 p-BQ was used to quench ˙O2−.24 Under the same conditions, the lower the degradation rate, the more obvious the inhibitory effect, and the greater the influence of the free radicals on the degradation reaction. As shown in Fig. 8a, the degradation rate of TCH in the blank control group reached 91.98% after 60 minutes, while the degradation rate of TCH was inhibited to varying degrees after adding the quencher, indicating that all four free radicals exist in the reaction system and play a role in the degradation process effect.59 Among them, the most obvious decline in the degradation rate of TCH was in the FFA-1O2 group (Fig. 8b); within 60 minutes of the reaction, the degradation rate of TCH in the FFA-1O2 group was always the lowest, and the reaction speed was the slowest. Therefore, 1O2 is an important ROS in the degradation process of TCH. It is worth noting that the inhibitory effect of p-BQ on TCH degradation is significantly weaker than that of FFA, indicating that ˙O2− is not the only precursor to generate 1O2 in the Fe3O4@T-BC/PMS system.23,60,61
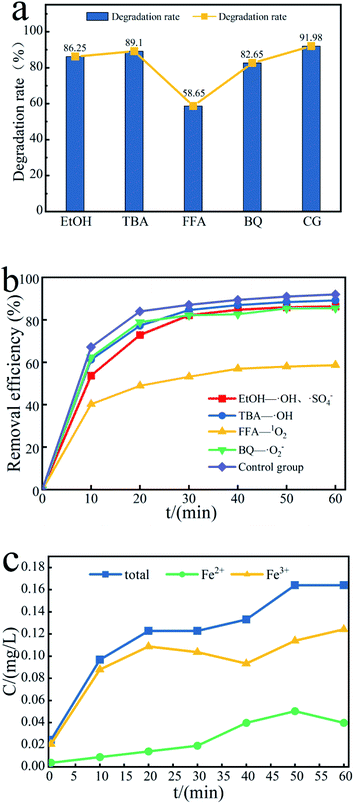 | ||
| Fig. 8 (a) Effect of free radical scavengers on TCH removal efficiency, and (b) the contribution of SO4−˙, ˙OH, ˙O2− and 1O2; (c) concentration changes of iron ions in different valence states. | ||
The production of active free radicals in the Fe3O4@T-BC/PMS system is affected by the dissolution efficiency of iron ions. According to the experimental results, Fe3+ is the main iron ion in the system. Fig. 8c reflects the changes in different valence iron ions in the solution during the degradation process. First, Fe3+ reacts with PMS to form Fe2+ and SO5−˙. PMS can cause Fe2+ to lose electrons to form Fe3+ and produce SO4−˙, which can degrade target organic pollutants. It is speculated that the possible reaction process on the catalyst surface is as follows:62,63
Within 10–20 minutes of reaction, the concentration of Fe3+ decreases and the concentration of Fe2+ increases:
| Fe3+ + HSO5− → Fe2+ + SO5−˙ + H+ | (6) |
Within 50–60 min of the reaction, the concentration of Fe2+ decreases and the concentration of Fe3+ increases:
| Fe2+ + HSO5− → Fe3+ + SO4−˙ + OH− | (7) |
As the reaction progresses, the concentration of iron ions in the solution changes only to a small extent (on the order of 0.1 mg L−1). Compared to directly adding metal catalysts to the solution, the loading method effectively reduces the concentration of iron ions in the solution and avoids secondary pollution.
The results of the abovementioned investigation on iron ions explain the production of SO4−˙ (8) and (9).62 At the same time, Fe2+ interacts with the dissolved oxygen in the system to produce ˙O2− (10).64 The generated SO4−˙ reacts with water to produce ˙OH (11). ˙O2− can react with H2O and ˙OH to generate 1O2 (12) and (13). It is speculated from the results of the quenching experiment that ˙O2− is not the only way to produce 1O2; the data show that SO5−˙ produced by Fe3+ and HSO5− can also act to produce 1O2 (14) and (15).23 Finally, the combined action of several free radicals completes the degradation of TCH (16).65,66
| Fe3+ + HSO5− → Fe2+ + SO5−˙ + H+ | (8) |
| Fe2+ + HSO5− → Fe3+ + SO4−˙ + OH− | (9) |
| Fe2+ + O2 → Fe3+ + ˙O2− | (10) |
| SO4−˙ + H2O → SO42− + ˙OH + H+ | (11) |
| 2˙O2− + H2O → H2O2 + OH− + 1O2 | (12) |
| ˙O2− + ˙OH + 2H+ → 1O2 + OH− | (13) |
| SO5−˙ + SO5−˙ → S2O82− + 1O2 | (14) |
| SO5−˙ + SO5−˙ → SO42− + 1O2 | (15) |
| TCH + SO4−˙ + ˙OH + ˙O2− + 1O2 → intermediates + CO2 + H2O | (16) |
In the above process, the sources of 1O2 are the most diverse and play a major role in the degradation system.
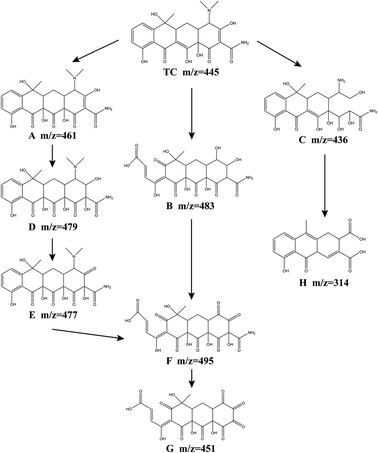
In order to further analyze the intermediate products and infer the degradation path of tetracycline, the degradation products of tetracycline were analyzed by LC-MS. 8 kinds of intermediates in the degradation process are detected, and the possible TCH degradation pathways are proposed (Fig. 10). TCH is first decomposed into tetracycline, and the initial m/z value of the original TC was 445. Through the attack of SO4−˙, ˙OH, ˙O2− and 1O2, the oxidation of TC may occur in three ways. In both route I and route II, intermediate product F is formed. In route I, ˙OH first attacked the double bond on the c ring to form product A (m/z = 461), ˙OH attacked the double bond on the d ring of product A again, and produced products D (m/z = 479), E (m/z = 477). The dimethylamino group of the product E is attacked by SO4−˙, 1O2, and the aromatic epoxide is oxidized to open the ring, and the product F is obtained. In route II, a epoxidation opens the ring, the c-ring double bond is attacked by ˙OH, and the dimethylamino group is hydroxylated to produce product B (m/z = 483). The d-ring hydroxyl group in product B is oxidized to carbonyl by 1O2.64 The product F (m/z = 495) was obtained. The product F eliminates the amide group to obtain the intermediate product G (m/z = 451).22 In route III, the D-ring double bond undergoes a hydrolysis reaction, and the dimethylamino group is demethylated to produce the product C (m/z = 436). Product C obtains intermediate product H (m/z = 314) through a series of reactions (dehydration, addition and oxidation). Finally, under the continued attack of the four free radicals, these intermediate products undergo a ring-opening reaction, and finally mineralize into NH4+, NO3−, CO2 and H2O.
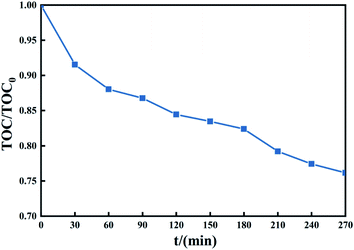
Fig. 11 shows that the treatment system can mineralize part of TCH into CO2 and H2O in a short time. After treating TCH with PMS activated by 1 g L−1 Fe3O4@T-BC, the TOC content in the system decreased. To verify the system's mineralization of TCH and the intermediate products produced by its degradation. A degradation experiment of 270 min was carried out (experimental conditions: 2 g L−1 PMS, 50 mg L−1 TCH, 2 g L−1 Fe3O4@T-BC, room temperature). The TOC change during the experiment is shown in the figure. In the first 60 min of the degradation experiment, the TOC value decreased rapidly, consistent with the TCH degradation efficiency; after 60 minutes of the experiment, the TOC value decreased gradually. It can be inferred from this that Fe3O4@T-BC effectively catalyzes the generation of a large number of active free radicals in the initial stage of degradation. These free radicals further oxidize the intermediate products of TCH degradation, attack higher bond energy chemical bonds, and finally mineralize TCH into CO2 and H2O.
3.5 Stability and reusability of Fe3O4@T-BC
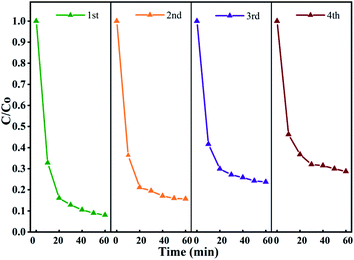
To evaluate the stability of the catalyst in the activated persulfate system and the possibility of repeated use, the stability of Fe3O4@T-BC was evaluated in a cyclic degradation test under optimal conditions, and the results are shown in Fig. 12. Four repeated experiments were carried out with 60 min as a reaction cycle, and the conditions for each test were controlled as follows: [TCH] = 50 mg L−1, Fe3O4@T-BC dosage = 1 g L−1, [PMS] = 1 g L−1. After the previous reaction cycle, an external magnet is used to recover and separate the magnetic catalyst (Fig. 3b), and washed repeatedly with ultrapure water until neutral pH was achieved, dried at 60 °C and weighed. Then, the degradation experiment was performed again under the same conditions. As shown in Fig. 12, the degradation efficiency of TCH gradually decreases as the number of cycles increases. It was found by weighing that there was a mass loss of approximately 10% in each round of catalyst recovery. The loss of the catalyst mainly includes the external magnetic field residue and a small part of Fe3O4 detached during the washing process of deionized water. In general, the Fe3O4@T-BC catalyst can still maintain a degradation rate of 71.32% after repeating the degradation experiment 4 times, indicating that the Fe3O4@T-BC catalyst is stable and can be recycled in the PMS activation of TCH degradation. In addition, for each cycle experiment, the leaching of total iron was less than 0.2 ppm, which is lower than the European standard (2 ppm).14 Fig. 2a also shows that there is no significant difference in the XRD patterns of the Fe3O4@T-BC catalyst before and after the reaction. Fe3O4@T-BC is easily separated and reused by an external magnetic field, indicating that the catalyst has high practical application value. In addition, cost accounting was carried out. Under the experimental conditions, the production of T-BC per ton of tea residue is about 700 kg. Through calculation, the electricity cost per ton for preparing T-BC is 1528.7 yuan, and the equipment depreciation is 7 yuan, totaling 1535.7 yuan. According to the market price of activated carbon, it is 10![[thin space (1/6-em)]](https://www.rsc.org/images/entities/char_2009.gif) 000–15
000–15![[thin space (1/6-em)]](https://www.rsc.org/images/entities/char_2009.gif) 000 yuan per ton. It can be seen from the above conditions that the cost of tea residue biochar is much lower than the average price of activated carbon. Considering that the raw materials for preparing Fe3O4@T-BC are widely available and low in price, the material can be used as a stable and promising composite material.
000 yuan per ton. It can be seen from the above conditions that the cost of tea residue biochar is much lower than the average price of activated carbon. Considering that the raw materials for preparing Fe3O4@T-BC are widely available and low in price, the material can be used as a stable and promising composite material.
4. Conclusions
In this study, the strategy of converting tea residue waste into biochar and loading Fe3O4 as the activator of PMS was realized for the first time, achieving waste recycling with low cost. Under the optimal reaction conditions, the removal rate of TCH within 60 minutes can reach 97.89%, which has extremely high degradation efficiency. Also, the strategy, loading Fe3O4 with catalytic properties on the biochar material to synergistically catalyze the PMS oxidative degradation of TCH, can solve the problem of the low activation effect of a single biochar and the problem of secondary pollution caused by the leaching of iron ions when a single iron activates PMS. The magnetic properties of the catalyst material are used for recycling, which has the huge potential for practical application. The mechanism of TCH degradation in the Fe3O4@T-BC/PMS system includes free radical and nonradical pathways, SO4−˙ and 1O2 played a dominant role. It is comprehensively shows that Fe3O4@T-BC is a promising magnetic biochar-based composite material that is economical, efficient, and environmentally friendly while realizing the reuse of waste resources. Therefore, the activation technology is expected to be further promoted for treat other types of antibiotic pollutants and even other organic pollutants.Conflicts of interest
There are no conflicts to declare.Acknowledgements
This work was supported by National Undergraduate Training Program for Innovation and Entrepreneurship (201910225066; 202010225090), and the Heilongjiang Provincial Natural Science Foundation (LH2019D002).References
- B. Mohammad, T. Targol, K. Elaheh and E. Ali, Mater. Circ. Econ., 2021, 3, 3 CrossRef.
- Q. Xu, K. Hu, X. Wang, D. Wang and M. T. Knudsen, J. Cleaner Prod., 2019, 233, 782–792 CrossRef.
- B. Li, Y. Mei and S. Fan, Environ. Sci. Technol., 2020, 43(9), 67–78 Search PubMed.
- V. Basumatary, R. Saikia, R. Narzari, N. Bordoloi, L. Gogoi, D. Sut, N. Bhuyan and R. Kataki, Mater. Today: Proc., 2018, 5(11), 23413–23422 CAS.
- B. Shen, L. Tian, F. Li, X. Zhang, H. Xu and S. Singh, Fuel, 2017, 187, 189–196 CrossRef CAS.
- H. Qiao, L. Mei, G. Chen, H. Liu, C. Peng, F. Ke, R. Hou, X. Wan and H. Cai, Appl. Surf. Sci., 2019, 483, 114–122 CrossRef CAS.
- S. Fan, W. Liu, J. Wang, H. Hu and N. Zhou, Environ. Sci., 2020, 41(3), 1308–1318 Search PubMed.
- I. T. Carvalho and L. Santos, Environ. Int., 2016, 94, 736–757 CrossRef PubMed.
- M. Bilal, S. Mehmood, T. Rasheed and H. M. N. Iqbal, Curr. Opin. Environ. Sci. & Health, 2020, 13, 68–74 Search PubMed.
- L. Xu, H. Zhang, P. Xiong, Q. Zhu, C. Liao and G. Jiang, Sci. Total Environ., 2020, 753, 141975 CrossRef PubMed.
- H. Wang, X. Lou, Q. Hu and T. Sun, J. Mol. Liq., 2021, 325, 114967 CrossRef CAS.
- G. Sharma, A. Kumar, S. Sharma, A. H. A. Muhtaseb, M. Naushad, A. Ghfar, T. Ahamad and F. J. Stadler, Sep. Purif. Technol., 2019, 211, 895–908 CrossRef CAS.
- G. Sharma, D. Dionysiou, S. Sharma, A. Kumar, A. H. A. Muhtaseb, M. Naushad and F. J. Stadler, Catal. Today, 2019, 335, 437–451 CrossRef CAS.
- Z. Pi, X. Li, D. Wang, Q. Xu, Z. Tao, X. Huang, F. Yao, Y. Wu, L. He and Q. Yang, J. Cleaner Prod., 2019, 235, 1103–1115 CrossRef CAS.
- H. Chao, D. E. Que, A. C. Aquino, Y. Gou, L. Tayo, Y. Lin, M. Tsai, F. Hsu, I. Lu, S. Lin, N. Srikhao, C. Shy and K. Huang, Environ. Monit. Assess., 2020, 192, 220–229 CrossRef PubMed.
- F. Shao, Y. Wang, Y. Mao, T. Shao and J. Shang, Chemosphere, 2020, 261, 127844 CrossRef CAS PubMed.
- P. Xiao, L. An and D. Wu, N. Carbon Mater., 2020, 35, 667–683 CrossRef.
- K. Zhu, Q. Bin, Y. Shen, J. Huang, D. He and W. Chen, Chem. Eng. J., 2020, 402, 126090 CrossRef CAS.
- L. An and P. Xiao, RSC Adv., 2020, 10, 19401–19409 RSC.
- D. Ouyang, J. Yan, L. Qian, Y. Chen, L. Han, A. Su, W. Zhang, H. Ni and M. Chen, Chemosphere, 2017, 184, 609–617 CrossRef CAS PubMed.
- S. Shao, L. Qian, X. Zhan, M. Wang, K. Lu, J. Peng, D. Miao and S. Gao, Chem. Eng. J., 2020, 382, 123005 CrossRef CAS.
- X. Chen, J. Zhou, Y. Chen, Y. Zhou and X. Li, Process Saf. Environ. Prot., 2020, 145, 346–377 Search PubMed.
- Y. Yan, H. Zhang, W. Wang, W. Li, Y. Ren and X. Li, J. Hazard. Mater., 2020, 411, 124952 CrossRef PubMed.
- Z. Li, K. Li, S. Ma, B. Dang and Q. Meng, J. Colloid Interface Sci., 2020, 582, 598–609 CrossRef PubMed.
- K. Mahesh, D. Kuo and B. Huang, J. Mol. Catal. A: Chem., 2015, 396, 290–296 CrossRef CAS.
- R. Gurav, S. Bhatia, T. Choi, Y. Park, J. Park, Y. Han, G. Vyavahare, J. Jadhav, J. Song, P. Yang, J. Yoon, A. Bhatnagar, Y. Choi and Y. Yang, Bioresour. Technol., 2019, 297, 122472 CrossRef PubMed.
- B. Chen, Z. Chen and S. Lv, Bioresour. Technol., 2011, 102(2), 716–723 CrossRef CAS PubMed.
- A. Kumar, G. Sharma, M. Naushad, A. H. Al-Muhtaseb, A. Kumar, I. Hira, T. Ahamad, A. A. Ghfar and F. J. Stadler, J. Environ. Manage., 2019, 231, 1164–1175 CrossRef CAS PubMed.
- G. Sharma, S. Bhogal, V. K. Gupta, S. Agarwal, A. Kumar, D. Pathania, G. T. Mola and F. J. Stadler, J. Mol. Liq., 2019, 275, 499–509 CrossRef CAS.
- J. Hoslett, H. Ghazal, E. Katsou and H. Jouhara, Sci. Total Environ., 2021, 751, 141755 CrossRef CAS PubMed.
- X. Duan, H. Sun, J. Kang, Y. Wang, S. Indrawirawan and S. Wang, ACS Catal., 2015, 5, 4629–4636 CrossRef CAS.
- J. Yan, L. Han, W. Gao, S. Xue and M. Chen, Bioresour. Technol., 2015, 175, 269–274 CrossRef CAS PubMed.
- W. Oh, Z. Dong and T. Lim, Appl. Catal., B, 2016, 218, 77–83 Search PubMed.
- Z. Ma, Y. Guan and H. Liu, J. Polym. Sci., Part A: Polym. Chem., 2005, 43(15), 3433–3439 CrossRef CAS.
- B. Li, Y. Zhang, J. Xu, Y. Mei, S. Fan and H. Xu, Chemosphere, 2020, 267, 129283 CrossRef PubMed.
- Y. Lei, C. Chen, Y. Tu, Y. Huang and H. Zhang, Environ. Sci. Technol., 2015, 49, 6838–6845 CrossRef CAS PubMed.
- J. Wang, Z. Liao, J. Ifthikar, L. Shi, Y. Du, J. Zhu and Z. Chen, Chemosphere, 2017, 185, 754–763 CrossRef CAS PubMed.
- Y. Du, M. Dai, J. Cao and C. Peng, RSC Adv., 2019, 9, 33486–33496 RSC.
- P. Duan, Y. Qi, S. Feng, X. Peng, W. Wang, Y. Yue, Y. Shang, Y. Li, B. Gao and X. Xu, Appl. Catal., B, 2020, 267, 118717 CrossRef CAS.
- D. Ma, Y. Yang, B. Liu, G. Xie, C. Chen, N. Ren and D. Xing, Chem. Eng. J., 2021, 408, 127992 CrossRef CAS.
- L. Hou, X. Li, Q. Yang, F. Chen, S. Wang, Y. Ma, Y. Wu, X. Zhu, X. Huang and D. Wang, Sci. Total Environ., 2019, 663, 453–464 CrossRef CAS PubMed.
- Y. Ji, C. Dong, D. Kong, J. Lu and Q. Zhou, Chem. Eng. J., 2015, 263, 45–54 CrossRef CAS.
- Z. Li, C. Guo, J. Lu, Z. Hu and M. Ge, J. Hazard. Mater., 2019, 373, 85–96 CrossRef CAS PubMed.
- S. Luo, P. Qin, J. Shao, L. Peng, Q. Zeng and J. Gu, Chem. Eng. J., 2013, 223, 1–7 CrossRef CAS.
- C. Zhu, G. Fang, D. Dionysiou, C. Liu, J. Gao, W. Qin and D. Zhou, J. Hazard. Mater., 2016, 316, 232–241 CrossRef CAS PubMed.
- A. Ioannidi, P. Oulego, S. Collado, A. Petala, V. Arniella, Z. Frontistis, G. N. Angelopoulos, M. Diaz and D. Mantzavinos, J. Environ. Manage., 2020, 270, 110820 CrossRef CAS PubMed.
- F. Li, F. Duan, W. Ji and X. Gui, Ecotoxicol. Environ. Saf., 2020, 198, 110653 CrossRef CAS PubMed.
- M. Nalinrut, R. Chavalit and M. Lu, Environ. Sci. Technol., 2009, 43(22), 8629–8634 CrossRef PubMed.
- W. Zhai, M. Li and Q. Zhang, China Environ. Sci., 2020, 40(6), 2483–2492 Search PubMed.
- Y. Guan, J. Ma, X. Li, J. Fang and L. Chen, Environ. Sci. Technol., 2011, 45(21), 9308–9314 CrossRef CAS PubMed.
- S. Yao, X. Ma and S. Li, China Environ. Sci., 2018, 38(11), 4166–4172 Search PubMed.
- Z. Guo, G. Bai, B. Huang, N. Cai, P. Guo and L. Chen, J. Hazard. Mater., 2021, 408, 124802 CrossRef CAS PubMed.
- Y. Qi, B. Ge, Y. Zhang, B. Jiang, C. Wang, M. Akram and X. Xu, J. Hazard. Mater., 2020, 399, 123039 CrossRef CAS PubMed.
- Y. Yang, P. Joseph J, J. Ma and M. William A, Environ. Sci. Technol., 2014, 48(4), 2344–2351 CrossRef CAS PubMed.
- Y. Wang, D. Tian, W. Chu, M. Li and X. Lu, Sep. Purif. Technol., 2019, 212, 536–544 CrossRef CAS.
- S. Gaurav, K. Amit, N. Mu, G. Alberto, A. Ala'a H, A. Ayman, S. Vikrant, A. Tansir and J. Florian, Int. J. Biol. Macromol., 2018, 114, 295–305 CrossRef PubMed.
- S. Gaurav, K. Amit, D. Kunjana, S. Shweta, N. Mu, A. Ayman, A. Tansir and J. Florian, Carbohydr. Polym., 2018, 202, 444–453 CrossRef PubMed.
- K. Mona, M. Gholamreza and G. Stefanos, Chem. Eng. J., 2020, 411, 127957 Search PubMed.
- F. Liu, J. Cao, Z. Yang, W. Xiong and X. Zhong, J. Colloid Interface Sci., 2020, 581, 195–204 CrossRef PubMed.
- X. Li, T. Hou, L. Yan, L. Shan and Y. Zhao, J. Hazard. Mater., 2020, 398, 122884 CrossRef CAS PubMed.
- Y. Shi, J. Li, D. Wan, J. Huang and Y. Liu, Sci. Total Environ., 2020, 749, 142313 CrossRef CAS PubMed.
- J. Hu, H. Chen, H. Dong, L. Zhu and J. Yu, J. Hazard. Mater., 2020, 403, 123553 CrossRef PubMed.
- Q. Hu, J. Cao, Z. Yang, W. Xiong, Z. Xu, P. Song, M. Jia, Y. Zhang, H. Peng and A. Wu, Sep. Purif. Technol., 2020, 259, 118059 CrossRef.
- H. Huang, T. Guo, K. Wang, Y. Li and G. Zhang, Sci. Total Environ., 2021, 758, 143957 CrossRef CAS PubMed.
- R. Zhang, D. Li, J. Sun, Y. Cui and Y. Sun, Front. Environ. Sci. Eng., 2020, 14(4), 6955–6960 Search PubMed.
- M. Shen, Z. Huang, L. Qiu, Z. Chen and L. Cui, J. Cleaner Prod., 2020, 268, 122174 CrossRef CAS.
- B. Yu, J. Wang and X. Yang, Environ. Sci. Pollut. Res., 2019, 26, 32345–32359 CrossRef PubMed.
- C. Zhao, S. Zhong, C. Li, H. Zhou and S. Zhang, J. Mater. Res. Technol., 2020, 9(1), 601–609 CrossRef CAS.
| This journal is © The Royal Society of Chemistry 2021 |


