 Open Access Article
Facial controlled synthesis of Pt/MnO2 catalysts with high efficiency for VOCs combustion
Jing Hu *a,
Xiangling Gaob,
Qingfeng Fanc and
Xingmin Gaoa
aShenzhen University, Shenzhen, China. E-mail: hujing1@szhti.com.cn
bTsinghua University, Shenzhen, China
cShenzhen High-tech Investment Group Co., Ltd., Shenzhen, China
First published on 4th May 2021
Abstract
Two sets of experiments were initially implemented to explore the best impregnation method and the best morphology substrate. In the first case, Pt/MnO2-r-WI catalyst showed a better performance than that of Pt/MnO2-r-IW. The test results illustrated that Wetness Impregnation (WI) could enhance the dispersion of Pt, ratios of Mn4+/Mn3+, Oads/Olatt and Pt4+/Pt0 as compared to those of Incipient Wetness Impregnation (IW). In the other method, MnO2-s catalyst displayed a higher catalytic efficiency than that of MnO2-r because the nanosphere morphology had larger BET surface area and pore volume to attract Pt atoms and toluene molecules. Therefore, the Pt/MnO2-s-WI catalyst was obtained and showed the best activity with low-temperature redox capability and oxygen mobility. It could eliminate toluene (T90) at a low temperature of 205 °C and remain stable over 150 h. effects of calcination temperature, toluene concentration and gas hourly space velocity (GHSV) were also investigated herein. In situ diffuse reflectance infrared Fourier transform spectroscopy (DRIFTS) was also implemented to explore the reaction mechanism. It demonstrated that toluene was firstly adsorbed over Ptδ+ on the surface before being oxidized to CO2 and H2O. The whole procedure follows the Mars-van Krevelen mechanism. This work gives a comprehensive understanding of the heterogeneous catalysis mechanism.
1 Introduction
Volatile organic compounds (VOCs) are a group of materials that are widely used including automobiles, textile manufacturing, architecture coatings, petroleum plants, electronic component plants, and cleaning products.1 However, VOCs are recognized as precursors of ozone and have proved to be carcinogenic. According to the Chinese Academy of Environmental Planning, there are 31 million tons of VOCs emissions every year in China, far exceeding the traditional air pollutants; there is, therefore, an urgent need to address VOCs pollution. The market scale of VOCs monitoring and treatment is expected to be 180 billion RMB.Technically, there are various technologies for eliminating VOCs, such as thermal combustion, catalysis combustion, adsorption, absorption, plasma discharge abatement, bio-filtration, etc.1–4 Among these methods, catalytic oxidation is regarded as the most popular method due to low operating temperature, environmental friendliness and high efficiency. In terms of catalytic oxidation, selection and optimization of materials are key challenges for high-efficiency removal. Typically, there are two classes of catalysts that are widely used for VOC oxidation, namely, noble metal catalysts and transition metal oxides. Noble metal catalysts are already applied in practical industries nowadays due to their high catalytic activity, low operating temperature and recycling performance.5–7 However, their high cost and strong tendency toward aggregation limit their application. Therefore, it is preferred to support noble metals on other substrates, which could avoid the aggregation of metal particles as well as enhance the catalytic performance. Platinum, ruthenium, palladium, and gold are the most commonly used noble metal materials,8–11 while MnO2, Co2O3, CeO2 are always used as substrates.1,12–15 For example, P. Ruosi et al. studied the size effect of Pt nanoparticles on a series of Pt/CeO2 catalysts and found that Pt nanoparticles of 1.8 nm exhibited the best performance with a good balance of Pt–O–Ce bonds, Ce3+ and oxygen vacancies.16 However, Ce, one of the rare earth elements, is quite expensive for mass production. F. Wang et al. obtained a series of MnO2 samples with different morphologies, such as rods, wires, tubes and flowers. Among these, rod-MnO2 showed the best activity due to a higher oxygen concentration and better low-temperature reducibility.17 However, it did not show a clear relationship between the surface, structure and catalytic performance, which is an important factor for catalytic efficiency.18,19
This work is based on our former study that manganese oxide catalysts behave better than other transition metal oxide substrates for VOCs elimination.15,20 In this report, we further explore the effects of impregnation methods and MnO2 morphologies and obtain a Pt/MnO2-s-WI catalyst with nanosphere structure via the WI impregnation method. It shows extraordinary activity in eliminating toluene at 205 °C and good stability in sustaining high efficiency over 150 h.
2 Experimental section
2.1 Preparation of catalysts
Pt/MnO2-r-WI was acquired via an in situ deposition–precipitation reaction for impregnation. First, 0.15 g MnO2-r and sodium citrate (1.0 g) were added to 100 ml DI water, followed by 10 min ultrasonic treatment and magnetic stirring for 30 min. Na2CO3 aqueous solution (1 M) was added to the mixture dropwise to get the pH up to 10. Next, the conical flask was put into a water bath at 50 °C for 2 h. H2PtCl6 (0.1 g ml−1, 0.5 wt%) was injected into the solution, which was heated and stirred for another 5 h. After the mixture cooled to room temperature, the precipitate was filtered and washed three times with DI water and ethanol and then dried at 80 °C for 12 h. The obtained catalyst was then annealed at 400 °C for 2 h at a speed of 10 °C min−1 to give the Pt/MnO2-r-WI catalyst.
Pt/MnO2-s-WI was obtained by adding H2PtCl6 to MnO2-s solution, followed by the same post-treatment procedure as that of Pt/MnO2-r-WI.
2.2 Characterization
Samples were characterized by powder X-ray diffraction (XRD) on a SHIMADZU XRD-6000 diffractometer (40 kV, 40 mA, and increment of 1/4 0.02) using monochromatized Cu Ka radiation of wavelength 1.54059 Å in a 2θ range from 10° to 80°. The texture structure and morphology were determined by scanning electron microscopy (SEM) on a HITACHI SU8010, and High-Angle Annular Dark Field scanning transmission electron microscopy (HAADF-STEM) on an FEI Tecnai G2 F30. High-resolution transmission electron microscopy (HRTEM) was characterized at 200 kV. Brunauer–Emmett–Teller (BET) data were determined by nitrogen adsorption at 77 K with a Micromeritics ASAP 2020 analyzer. Surface elemental analysis was performed via X-ray photoelectron spectroscopy (XPS) on a PHI 5000 VersaProbe II with monochromatic Al Kα radiation. Bulk elemental analysis was conducted by inductively coupled plasma mass spectrometry (ICP-MS) on an MDTC-EQ-M29-01 instrument. CO temperature-programmed desorption (CO-TPD) was conducted using a Chembet TPR/TPD analyzer. The sample (∼50 mg) was reduced in a stream of 10.0 vol% H2/Ar (50 ml min−1) or adsorption/desorption in 5 vol% CO/Ar (50 ml min−1) at a ramp rate of 10 °C min−1.2.3 Catalytic evaluation
Catalytic activity towards toluene oxidation was carried out in a fixed bed reactor with a continuous 1500 ppm toluene flow saturated by 20% O2 and 80% N2 under atmospheric pressure. Before the tests, 90 mg samples were crushed and sieved into particles of 40–60 mesh, followed by loading in the middle of a 10 mm i.d. quartz tubular fixed bed reactor packed with quartz wool at both ends. The catalyst was pre-heated to 300 °C at the rate of 5 °C min−1 in N2 flow and maintained at 300 °C for half an hour before cooling to 100 °C. It was then kept for another hour to make sure that the inside of the sample was thoroughly cooled. Then, a feeding gas flow with 1500 ppm toluene was introduced into the tube with a GHSV of 40![[thin space (1/6-em)]](https://www.rsc.org/images/entities/char_2009.gif) 000 ml g−1 h−1. To get stable catalytic activity, it was maintained at each testing temperature for 30 min before testing. The catalytic activity was monitored by an online gas chromatograph (GC-2010, Shimadzu) with an FID detector, and the toluene removal efficiency was calculated as follows:
000 ml g−1 h−1. To get stable catalytic activity, it was maintained at each testing temperature for 30 min before testing. The catalytic activity was monitored by an online gas chromatograph (GC-2010, Shimadzu) with an FID detector, and the toluene removal efficiency was calculated as follows:where [toluene]in and [toluene]out are concentrations of the gas flow at the inlet and outlet ends, respectively. For the water vapor inhibition test, a stream of water vapor (5 vol%) was introduced into the fixed bed and the catalyst was evaluated with and without water vapor at 220 °C. In addition, stability testing was carried out for 150 h at 220 °C, together with five cycles.
3 Results and discussion
To confirm impact factors, we arranged two sets of experiments. The first one was to distinguish between WI and IW methods and to find a better one for impregnation. Therefore, we used MnO2-r as a probe substrate and got Pt/MnO2-r-IW and Pt/MnO2-r-WI catalysts. As shown in Fig. 1a, Pt/MnO2-r-WI showed a better combustion efficiency than that of Pt/MnO2-r-IW, illustrating that the WI method contributes to the catalytic performance. The second experiment was to exchange MnO2-r with MnO2-s and to find a more suitable substrate. As shown in Fig. 1b, MnO2-s had a much better performance than that of MnO2-r, suggesting that nanospheres are more suitable for substrates. According to the orthogonal test results, the Pt/MnO2-s-WI catalyst was obtained via MnO2 nanosphere substrate and WI method. As expected, Pt/MnO2-s-WI showed the best combustion activity as compared to those of Pt/MnO2-r-WI and Pt/MnO2-r-IW.The catalytic performance over toluene is demonstrated in Table 1. As shown, the catalytic activity is of the following order: Pt/MnO2-s-WI (T90 = 205 °C) > Pt/MnO2-r-WI (T90 = 226 °C) > Pt/MnO2-r-IW (T90 = 249 °C) > MnO2-s (T90 = 262 °C) > MnO2-r (T90 = 278 °C). The catalytic activity of Pt/MnO2-r-WI is higher than that of Pt/MnO2-r-IW, which indicates that WI with higher dispersion is more effective for improving the reactivity than IW. Moreover, the catalytic activity of Pt/MnO2-s-WI is higher than that of Pt/MnO2-r-WI, as MnO2-s has a larger BET surface area and more Pt loading to enhance the performance. Therefore, different loading methods and support morphologies influence the low-temperature redox and oxygen mobility by affecting the loading and dispersion of Pt.
| Catalysts | T10/°C | T50/°C | T90/°C | Surface area (m2 g−1) | Pt loading (wt%) | Pt average size (nm) | Pore volume (cm3 g−1) |
|---|---|---|---|---|---|---|---|
| MnO2-r | 230 | 240 | 275 | 34 | — | — | 0.17 |
| MnO2-s | 206 | 230 | 262 | 151 | — | — | 0.22 |
| Pt/MnO2-r-IW | 199 | 214 | 250 | 5 | 0.37 | 1.3 | 0.09 |
| Pt/MnO2-r-WI | 179 | 208 | 224 | 9 | 0.09 | — | 0.11 |
| Pt/MnO2-s-WI | 168 | 183 | 205 | 89 | 0.13 | — | 0.18 |
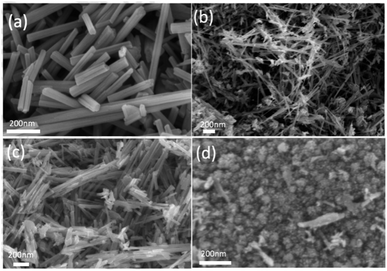
The following work explores a comprehensive understanding of the structure and performance. Initially, Pt/MnO2-r-WI, Pt/MnO2-r-IW and Pt/MnO2-s-WI were chosen as examples; however, they could not represent the changes after WI or IW impregnation, so MnO2-r was then added to the examples. Therefore, there were four cases in the following series of tests. Material morphologies are demonstrated in Fig. 2. As shown, the MnO2-r catalyst has a rather smooth surface, with a BET of 34 m2 g−1. The nanorod lengths were between 100 nm and 1 μm, with diameters of around 50 nm. Pt/MnO2-r-IW was obtained by dipping platinum solution into MnO2-r. Compared to MnO2-r, Pt/MnO2-r-IW had much thinner rods and more contaminations attached to the surface. Pt/MnO2-r-WI was obtained by soaking MnO2-r in platinum solution with excessive volume. Pt/MnO2-r-WI had fewer contaminants and its BET area increased to 9 m2 g−1, higher than that of Pt/MnO2-r-IW (5 m2 g−1). Pt/MnO2-s-WI exhibited a hierarchy structure where primary nanoparticles of 10 nm gathered to form secondary particles of 50 nm. High-resolution structures are shown in Fig. 3d, e, f, confirming a crystalline structure with primary particles at about 10 nm. The BET surface area of Pt/MnO2-s-WI was 89 m2 g−1, which was much lower than that of MnO2-s (161 m2 g−1). The pore volumes of catalysts are listed in Table 1. MnO2-s has the largest pore volume of 0.22 cm3 g−1, followed by Pt/MnO2-s-WI (0.18 cm3 g−1). The pore volume of Pt/MnO2-r-WI and Pt/MnO2-s-IW also decreased after the impregnation procedure because ionic particles and contaminants blocked the pores. Besides, the pore volume of Pt/MnO2-r-WI (0.11 cm3 g−1) was larger than that of Pt/MnO2-s-IW (0.09 cm3 g−1), corresponding to the BET results. The results showed that WI is beneficial for Pt dispersion. There were no distinct micropores over the MnO2 series catalyst. However, there was a small number of mesopores over MnO2-s, which could explain the high surface area of MnO2-s and Pt/MnO2-s-WI.21
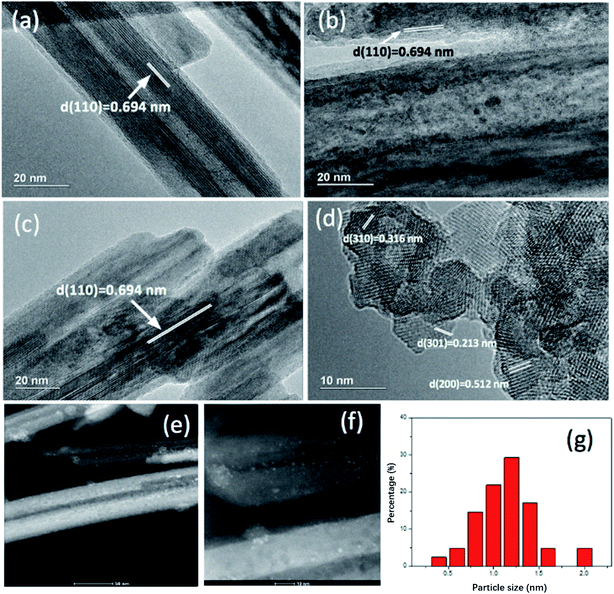 | ||
| Fig. 3 TEM of (a) MnO2-r; (b) Pt/MnO2-r-W1; (c) Pt/MnO2-r-IW; (d) Pt/MnO2-s-WI. (e and f) HAADF-STEM of Pt/MnO2-r-IW; (g) particle size distribution of Pt/MnQO2-r-IW.-645795493903000. | ||
Fig. 3 demonstrates the TEM images of several catalysts. MnO2-r, Pt/MnO2-r-IW and Pt/MnO2-r-WI all exhibit a 0.694 nm interplanar spacing, corresponding to (110) of the MnO2 phase. Interplanar distances of 0.316 nm, 0.213 nm and 0.512 nm on Pt/MnO2-s-WI belong to the (310), (301) and (200) plane of MnO2. Furthermore, there are lots of particles on Pt/MnO2-r-IW, conforming a homogeneous dispersion of Pt particles, whose sizes range from 0.4 nm to 2.0 nm, with a median of 1.3 nm. There were no Pt particles on Pt/MnO2-r-WI and Pt/MnO2-s-WI catalysts, although XPS and ICP-MS results proved the presence of Pt element. Therefore, it is reasonable to propose that Pt atoms are highly dispersed on the supports.22,23
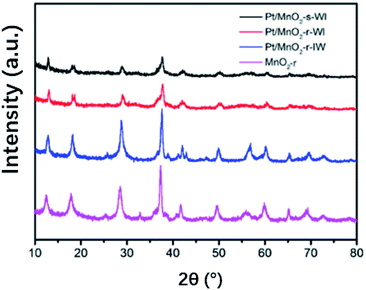
Fig. 4 shows the XRD results of MnO2-r and three Pt/MnO2 catalysts. All curves were indexed to MnO2 (JCPDS 44-0141) with the strongest feature peak d (211) of 2θ at around 37.7°. As shown, the peaks of MnO2 and Pt/MnO2-r-IW are much sharper and more intense than those of the two WI samples. This is because the solvent affects the internal stress of the material, reducing the grain size of the catalyst supports.24 According to Scherrer's formula, the average thicknesses perpendicular to the crystal plane d (211) of each catalyst are 21.5 nm (MnO2-r), 54.4 nm (Pt/MnO2-r-IW), 20.8 nm (Pt/MnO2-r-WI) and 16.2 nm (Pt/MnO2-s-WI). These correspond to the SEM and TEM images where the nanorods are larger than the primary nanospheres. Notably, no Pt peak was observed here, illustrating the tiny size or amorphous structure of Pt. On the one hand, Pt in two WI catalysts is invisible in TEM images. On the other hand, Chen et al. concluded that the noble metal XRD feature peak disappeared when its loading amount was less than 0.75%.25 In this report, the Pt loading amounts of three catalysts are 0.37% (Pt/MnO2-r-IW), 0.09% (Pt/MnO2-r-WI), 0.13% (Pt/MnO2-s-WI), respectively. Therefore, it is reasonable to confirm that Pt atoms were highly dispersed on the substrates.
XPS was used to analyze the elemental composition and valence of the catalysts. Pt 4f could be divided into two sub-peaks, Pt 4f 7/2 and Pt 4f 5/2, corresponding to Pt0 with binding energy at 73.4 eV and Ptδ+ at 74.9 eV.26 Binding energies of Pt/MnO2-s-WI and Pt/MnO2-r-WI are the same, which are lower than that of the Pt/MnO2-r-IW catalyst (73.9 eV and 75.1 eV). This suggests that Pt–O in two WI catalysts is weaker than that of the IW catalyst. Therefore, the impregnation method affects the Pt–O interaction and gives a much weaker and more active Pt–O than that of IW.26 Furthermore, Pt 4f 7/2 and Pt 4f 5/2 are overlayed in curves of Pt/MnO2-r-IW, Pt/MnO2-r-WI, owing to more Pt0 content. Ptδ+/Pt0 ratios of Pt/MnO2-r-IW and Pt/MnO2-r-WI are 1.79 and 1.82, much lower than that of Pt/MnO2-s-WI (2.57). Typically, more Ptδ+ content means more Pt–O bonds and a better dispersion of Pt atoms.27 Detailed statistics are shown in Table 2. As shown, the WI method and sphere morphology are beneficial for Pt dispersion, resulting in more Pt–O bonds (Fig. 5).
| Catalysts | Pt 4f5/2 | Mn 2p3/2 | O 1s | ||||||
|---|---|---|---|---|---|---|---|---|---|
| Pt0 | Ptδ+ | Ptδ+/Pt0 | Mn3+ | Mn4+ | Mn4+/Mn3+ | Olatt | Oads | Oads/Olatt | |
| MnO2-r | — | — | — | 641.1 | 642.4 | 0.34 | 529.9 | 531.5 | 0.33 |
| Pt/MnO2-r-IW | 73.9 | 75.1 | 1.79 | 641.9 | 642.8 | 1.37 | 530.0 | 531.9 | 0.68 |
| Pt/MnO2-r-WI | 73.4 | 74.9 | 1.82 | 641.8 | 642.7 | 1.47 | 529.9 | 531.7 | 0.63 |
| Pt/MnO2-s-WI | 74.4 | 74.9 | 2.57 | 641.2 | 642.4 | 1.82 | 529.7 | 531.5 | 0.79 |
Mn 2p 3/2 can be split into Mn3+, Mn4+ and accompanying peaks were observed at 641 eV, 643 eV and 644 eV. As can be seen from Table 2, the binding energy of Pt/MnO2-r-IW, Pt/MnO2-r-WI and Pt/MnO2-s-WI decreased as Pt dispersion increased. It is because Pt has a stronger electronegativity to attract the electron cloud in the Mn–O–Pt bond, which weakens the interaction of the Mn–O bond and decreases the binding energy. In other words, Pt activates the Mn–O bond, which increases the mobility of oxygen. This also corresponds to the fact that the Mn4+/Mn3+ order is consistent with the order of Ptδ+/Pt0. Furthermore, Pt/MnO2-r-IW has the lowest Mn4+/Mn3+ ratio, which may due to the largest particle size of Pt increasing the oxygen defect and increasing the Mn3+ component. As shown in Table 1, the catalytic activity order is consistent with the order of Ptδ+/Pt0, meaning that Ptδ+ contributes to the catalyst. Li et al. also found that ionic Ptδ+ was easier to adsorb toluene than metallic Pt0, thus improving the catalytic effect.28
There are two kinds of oxygen species on metal oxides: oxygen lattice and oxygen vacancy. Oxygen lattice (Olatt) stands for O2− inside the lattice with a lower valence number. The other oxygen species, such as O2−, O22−, O−, –OH, are classified as adsorbed oxygen (Oads) with higher binding energy. Olatt and Oads binding energies of Pt/MnO2-r-IW are 530.0 eV and 531.5 eV, more than that of MnO2-r (529.9 eV and 531.9 eV). This is because Pt decreases the interaction of the O–Mn bond, corresponding to the conclusion in the Pt section. Besides, the Oads/Olatt ratios of MnO2-r, Pt/MnO2-r-IW, Pt/MnO2-r-WI and Pt/MnO2-s-WI are 0.33, 0.68, 0.63 and 0.79, respectively. This is relevant to the Pt dispersion (Pt/MnO2-r-IW vs. Pt/MnO2-s-WI) and Pt loading amount (Pt/MnO2-s-WI vs. Pt/MnO2-r-WI). Pt/MnO2-s-WI has the largest ratio of Oads/Olatt and the greatest oxygen mobility.
The activation energy (Ea) is calculated via the Arrhenius plot in Fig. 6a, where the toluene conversion is less than 20%. As shown, MnO2-r has the highest Ea of 168.8 kJ mol−1. The lowest is of Pt/MnO2-s-WI (92.6 kJ mol−1), corresponding to its best oxidation performance. Pt/MnO2-r-WI and Pt/MnO2-r-IW have moderate Ea of 111.6 kJ mol−1 and 131.2 kJ mol−1, respectively. This is of the same order as the catalytic activity in Fig. 6a. Furthermore, the light-off curves of Pt/MnO2-s-WI in different toluene concentrations and GHSVs are shown in Fig. 6b, c. The catalytic activity decreases as follows: Pt/MnO2-s-WI −750 ppm (208 °C) > Pt/MnO2-s-WI −1500 ppm (224 °C) > Pt/MnO2-s-WI −3000 ppm (235 °C) and Pt/MnO2-s-WI −20![[thin space (1/6-em)]](https://www.rsc.org/images/entities/char_2009.gif) 000 ml g−1 h−1 (210 °C) > Pt/MnO2-s-WI −40
000 ml g−1 h−1 (210 °C) > Pt/MnO2-s-WI −40![[thin space (1/6-em)]](https://www.rsc.org/images/entities/char_2009.gif) 000 ml g−1 h−1 (223 °C) > Pt/MnO2-s-WI −80
000 ml g−1 h−1 (223 °C) > Pt/MnO2-s-WI −80![[thin space (1/6-em)]](https://www.rsc.org/images/entities/char_2009.gif) 000 ml g−1 h−1 (235 °C).
000 ml g−1 h−1 (235 °C).
 | ||
| Fig. 6 (a) Arrhenius plot; (b) catalytic activity of Pt/MnO2-s-W1 under different concentrations; (c) catalytic activity of Pt/MnO2-s-WI under different GHSV. | ||
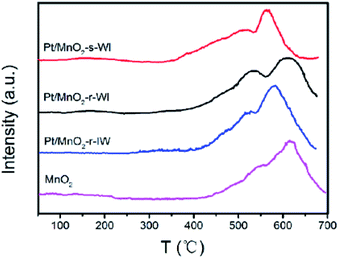
CO-TPD was implemented to detect the environment of the adsorption sites. There are small waves over a low temperature range below 200 °C, corresponding to the physical adsorption of CO, while peaks at 350–700 °C represent the strong chemical adsorption of CO. The MnO2-r sample has an intense peak at 617 °C with a satellite peak at 554 °C, corresponding to (OC)1–Mn and (OC)x–Mn binding states. CO tends to be one-to-one adsorbed on the surface of transition metal oxides, so the desorption peak at 617 °C is stronger. By comparing the statistics in Table 3, we find that the CO desorption temperature increased as the Pt loading amount decreased (Pt/MnO2-r-IW, Pt/MnO2-r-WI and MnO2-r). This phenomenon is consistent with the Baumer viewpoint that the desorption peak temperature of CO gradually decreases with the increase of the noble metal loading amount when the metal amount is relatively low.29 If we set the CO consumption of MnO2-r as 1.00, then the CO consumptions of the catalysts are as follows: Pt/MnO2-s-WI (2.52) > Pt/MnO2-r-WI (1.78) > Pt/MnO2-r-IW (1.71) > MnO2-r (1.00). The Pt/MnO2-r-WI activity is better than that of Pt/MnO2-r-IW, although Pt/MnO2-r-IW has a relatively lower desorption temperature. This could be explained by the larger CO consumption of Pt/MnO2-r-WI. It means that CO consumption outweighs the desorption temperature, which means that the number of active sites is more important for the catalytic activity. The desorption temperature of Pt/MnO2-s-WI is the lowest, which also has the most CO consumption. Although Pt/MnO2-s-WI does not have the highest Pt amount, it has the largest ratio of Ptδ+/Pt0, Mn4+/Mn3+ and Oads/Olatt, according to the XPS results. This suggests that the number of active sites is determined by Pt dispersion, via the sphere substrate and the WI method (Fig. 7).
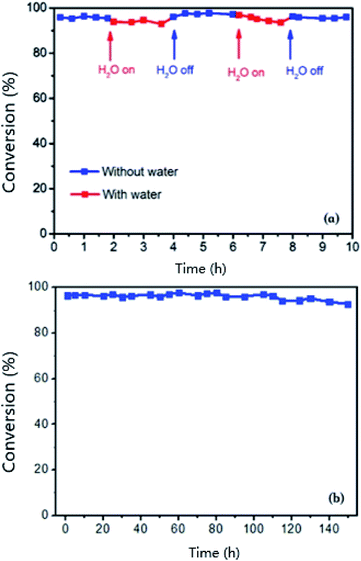
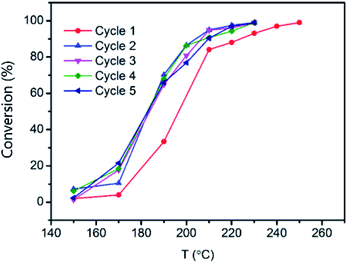
Catalytic stability was also studied in a humid environment. Vapor stability is demonstrated in Fig. 8a. It shows that water has an inhibitory effect on the toluene conversion to decrease the removal efficiency to 92% from 96%. After the removal of water vapor, the catalytic performance recovered and was maintained well after two rounds over ten hours. Based on Fig. 8b, the catalyst showed excellent stability during 150 h at 220 °C. Moreover, the cycling performance was also carried out to study the stability of Pt/MnO2-s-WI. This demonstrated outstanding cycling stability over cycle 1–5 without a significant decrease (Fig. 9).
The calcination effect on catalytic activity was studied and the results are displayed in Fig. 10. Pt/MnO2-s-WI was sintered at different temperatures for 2 hours. The elimination efficiency order is Pt/MnO2-s-WI-400 > Pt/MnO2-s-WI-350 > Pt/MnO2-s-WI- 450, which might be explained by XRD analysis in Fig. 8b. Pt/MnO2-s-WI- 350 has a wide and small peak at 2θ of 37.7° (MnO2, JCPDS 44-0141), indicating that the pre-activation temperature is not enough to form a well-crystallized material. T90 of Pt/MnO2-s-WI-450 is higher than that of Pt/MnO2-s-WI-400, indicating that a higher temperature may over-sinter the crystal to decrease the performance.30,31
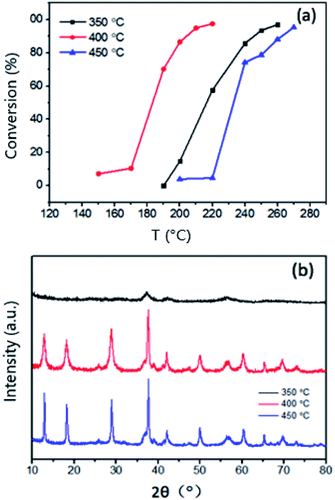 | ||
| Fig. 10 (a) Catalytic performance and (b) XRD plot of Pt/Mn0O2-s-WI calcined at different temperatures. | ||
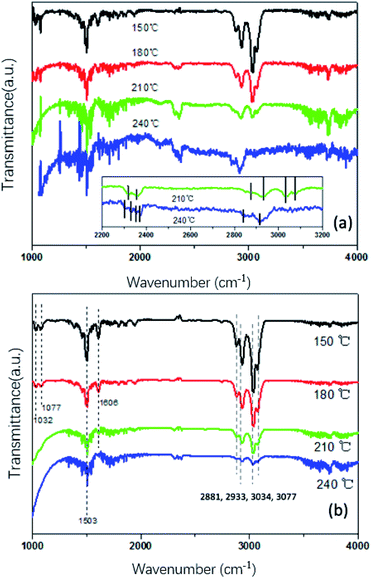
In order to further understand the surface adsorbed species and observe the active factors on the reactivity of catalysts for toluene oxidation, in situ DRIFTS spectra of Pt/MnO2-s-WI and MnO2-r were obtained under the same reaction conditions. As shown in Fig. 11, peaks at around 1032–1077 cm−1 belong to the bending vibrations in the benzene ring and benzyl groupβ(C–H(Ar)).32,33 Bands between 1400–2000 cm−1 correspond to the (ν(C![[double bond, length as m-dash]](https://www.rsc.org/images/entities/char_e001.gif) C)) stretching vibration in benzene.34 Furthermore, bands at 2881 cm−1, 2933 cm−1, 3034 cm−1 and 3077 cm−1 stand for the stretching vibration of hydrogen (υs(C–H)). Among them, 2881 cm−1 and 2933 cm−1 represent ν(C–H(Ar)) in benzene,35 3034 cm−1 and 3077 cm−1 stand for ν(C–H(CH3)) in the benzyl group.36 Moreover, peaks at around 3600 cm−1 are characteristic peaks standing for the asymmetric stretching vibration of H2O(υas(O–H)) and 2319 cm−1, 2346 cm−1 represent the stretching vibration (ν(C
C)) stretching vibration in benzene.34 Furthermore, bands at 2881 cm−1, 2933 cm−1, 3034 cm−1 and 3077 cm−1 stand for the stretching vibration of hydrogen (υs(C–H)). Among them, 2881 cm−1 and 2933 cm−1 represent ν(C–H(Ar)) in benzene,35 3034 cm−1 and 3077 cm−1 stand for ν(C–H(CH3)) in the benzyl group.36 Moreover, peaks at around 3600 cm−1 are characteristic peaks standing for the asymmetric stretching vibration of H2O(υas(O–H)) and 2319 cm−1, 2346 cm−1 represent the stretching vibration (ν(C![[double bond, length as m-dash]](https://www.rsc.org/images/entities/char_e001.gif) O)) of CO2.
O)) of CO2.
At the temperature of 150 °C, characteristic peaks of toluene were observed. Peaks at 1032 cm−1, 1077 cm−1 and 1606 cm−1 are more intense in Pt/MnO2-s-WI as compared to MnO2-r, indicating that Pt/MnO2-s-WI has a larger adsorptive capacity towards toluene.37 As the temperature increased, the characteristic peaks of Pt/MnO2-s-WI and MnO2-r became weaker, which means toluene on the surface was oxidized. When the temperature reached 210 °C, the reactions became faster and peaks were much weaker. At the same time, 2319 cm−1, 2346 cm−1 and 3600 cm−1 peaks emerged, resulting from CO2 and H2O products. The 210 °C peaks in Fig. 11a are stronger than those in Fig. 11b. There are two proposals herein: one is that CO2 and H2O leave Pt/MnO2-s-WI so fast that it is difficult to detect them. The other is that toluene is not completely converted into CO2 and H2O. As the temperature increases, there is no peak of other by-products coming out over the curve of Pt/MnO2-s-WI. This means that toluene was completely eliminated and there were no by-products like carbonate groups. Therefore, it is an adequate explanation that CO2 and H2O desorbed so fast that their peaks are weaker over Pt/MnO2-s-WI.
As the temperature increased, the peaks of toluene became weaker and weaker. However, peaks at around 1300–2000 cm−1(ν(C![[double bond, length as m-dash]](https://www.rsc.org/images/entities/char_e001.gif) C)) remained steady in Fig. 11a. In contrast, peaks at around 1300–2000 cm−1 in Fig. 11b became weaker along with peaks at 2800–3100 cm−1 (ν(C–H)). This is because toluene is oxidized from the benzyl group, followed by benzene. At 240 °C, toluene peaks completely disappeared. However, there were several peaks at 2303 cm−1, 2330 cm−1, 2356 cm−1 and 2375 cm−1 in Fig. 11a, indicating the presence of carboxylate byproducts.36 There was no carboxylate peak over Pt/MnO2-s-WI, corresponding to the conclusion above that toluene was quickly oxidized to CO2 and H2O so that there was no coke sticking on the surface. Therefore, Pt/MnO2-s-WI could sustain high activity in the stability test in Fig. 8.
C)) remained steady in Fig. 11a. In contrast, peaks at around 1300–2000 cm−1 in Fig. 11b became weaker along with peaks at 2800–3100 cm−1 (ν(C–H)). This is because toluene is oxidized from the benzyl group, followed by benzene. At 240 °C, toluene peaks completely disappeared. However, there were several peaks at 2303 cm−1, 2330 cm−1, 2356 cm−1 and 2375 cm−1 in Fig. 11a, indicating the presence of carboxylate byproducts.36 There was no carboxylate peak over Pt/MnO2-s-WI, corresponding to the conclusion above that toluene was quickly oxidized to CO2 and H2O so that there was no coke sticking on the surface. Therefore, Pt/MnO2-s-WI could sustain high activity in the stability test in Fig. 8.
In conclusion, Pt/MnO2-s-WI sample showed an excellent catalytic performance due to the following reasons: (1) Pt/MnO2-s-WI catalyst has a greater surface area, pore volume and active sites so that it has a stronger adsorption capacity for toluene. (2) Pt/MnO2-s-WI has better low-temperature redox and oxygen mobility. (3) Pt/MnO2-s-WI can rapidly desorb CO2 and H2O and expose active sites to accelerate the reaction rate. Furthermore, it shows a good catalytic stability with no by-product emerging in the catalytic process.
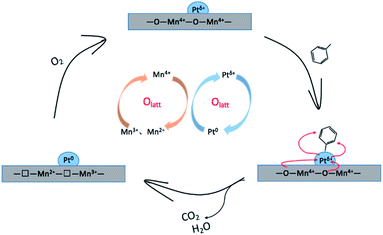
The whole reaction procedure over Pt/MnO2-s-WI catalyst is displayed in Fig. 12. Firstly, toluene is adsorbed by Ptδ+ ions on the surface of the catalyst. Then, toluene is oxidized under the oxygen supply of the MnO2 substrate. Ptδ+ is reduced to Pt0, and MnO2 is reduced to Mn3O4. The reduced catalyst is re-oxidized by O2 from the gas flow to participate in the next cycle of reaction. The process conforms to the Mars-van Krevelen model mechanism.
4 Conclusions
Overall, we have synthesized a series of Pt/MnO2 catalysts via WI or IWmethod. Pt/MnO2-s-WI had the best toluene oxidation performance due to the largest surface area, pore volume and the highest ratios of Mn4+/Mn3+, Oads/Olatt, and Pt4+/Pt0, which contributed to the low-temperature redox capability and catalytic activity. Pt/MnO2-s-WI eliminated toluene at 205 °C and was stable over 150 h. It also showed a good performance in anti-vapor and cycling tests. In situ DRIFTS testing suggested that Pt/MnO2-s-WI could enhance the adsorption of toluene and the desorption of CO2 and H2O, reducing coke formation and maintaining the activity. The whole procedure follows the Mars-van Krevelen mechanism. This work gives a comprehensive understanding of the influence factors and the heterogeneous catalysis mechanism.Author contributions
J. Hu: conceptualization, investigation, methodology, software, formal analysis, data curation, writing. X. Gao and Q. Fan: investigation, supervision, funding acquisition.Conflicts of interest
There are no conflicts to declare.Acknowledgements
The authors would like to thank professor WB Li for his guidance and advice, Testing Technology Center of Materials and Devices of Tsinghua University and Peking University for testings.Notes and references
- H. Huang, Y. Xu and Q. Feng, Low temperature catalytic oxidation of volatile organic compounds: a review, Catal. Sci. Technol., 2015, 5, 2649–2669 RSC
.
- C. He, J. Cheng and X. Zhang, Recent Advances in the Catalytic Oxidation of Volatile Organic Compounds: A Review Based on Pollutant Sorts and Sources, Chem. Rev., 2019, 119(7), 4471–4568 CrossRef CAS PubMed
.
- Y. Broza, R. Vishinkin and O. Barash, Synergy between nanomaterials and volatile organic compounds for non-invasive medical evaluation, Chem. Soc. Rev., 2018, 47, 4781–4859 RSC
.
- W. Li and G. Hao, Recent Progress in the Removal of Volatile Organic Compounds by Catalytic Combustion, Acta Phys.-Chim. Sin., 2010, 26(4), 885–894 CAS
.
- W. Sun, Z. Yang, Y. Xu, Y. Shi, Y. Shen and G. Liu, Fabrication of Pd3@Beta for catalytic combustion of VOCs by efficient Pd3 cluster and seed-directed hydrothermal syntheses, RSC Adv., 2020, 10, 12772–12779 RSC
.
- K. Vikrant, S. Weon and K. Kim, Platinized titanium dioxide (Pt/TiO2) as a multi-functional catalyst for thermocatalysis, photocatalysis, and photothermal catalysis for removing air pollutants, Applied Materials Today, 2021, 23, 100993 CrossRef
.
- T. A. Wierzbicki, I. C. Lee and A. K. Gupta, Recent advances in catalytic oxidation and reformation of jet fuels, Appl. Energy, 2016, 165, 904–918 CrossRef CAS
.
- Q. Zhang, H. Luan, T. Li, Y. Wu and Y. Ni, Study on Pt-structured anodic alumina catalysts for catalytic combustion of toluene: Effects of competitive adsorbents and competitive impregnation methods, Appl. Surf. Sci., 2016, 360, 1066–1074 CrossRef CAS
.
- H. Jae, Y. Deok and W. Jin, Roles of noble metals (M = Ag, Au, Pd, Pt and Rh) on CeO2 in enhancing activity toward soot oxidation: Active oxygen species and DFT calculations, J. Hazard. Mater., 2021, 403, 124085 CrossRef PubMed
.
- H. Wang, W. Yang and P. Tian, A highly active and anti-coking Pd-Pt/SiO2 catalyst for catalytic combustion of toluene at low temperature, Appl. Catal., A, 2017, 529, 60–67 CrossRef CAS
.
- S. Zhao, K. Li and S. Jiang, Pd–Co based spinel oxides derived from pd nanoparticles immobilized on layered double hydroxides for toluene combustion, Appl. Catal., B, 2016, 181, 236–248 CrossRef CAS
.
- X. Sun, J. Lin, Y. Wang, L. Li, X. Pan, Y. Su and X. Wang, Catalytically active Ir0 species supported on Al2O3 for complete oxidation of formaldehyde at ambient temperature, Appl. Catal., B, 2020, 268, 118741 CrossRef CAS
.
- C. Wang, W. Wang, J. Wang, P. Zhang, S. Miao, B. Jin and L. Li, Effective removal of aromatic pollutants via adsorption and photocatalysis of porous organic frameworks, RSC Adv., 2020, 10, 32016–32019 RSC
.
- Z. Bo, X. Guo, X. Wei, H. Yang, J. Yan and K. Cen, Mutualistic decomposition pathway of formaldehyde on O-predosed δ-MnO2, Appl. Surf. Sci., 2019, 498, 143784 CrossRef CAS
.
- W. Li and Z. Liu, Rod-like CuMnOx transformed from mixed oxide particles by alkaline hydrothermal treatment as a novel catalyst for catalytic combustion of toluene, Phys. Chem. Chem. Phys., 2016, 18, 22794–22798 RSC
.
- R. Peng, S. Li and X. Sun, Size effect of Pt nanoparticles on the catalytic oxidation of toluene over Pt/CeO2 catalysts, Appl. Catal., B, 2018, 220, 462–470 CrossRef CAS
.
- F. Wang and H. Dai, et al., Manganese oxides with rod-, wire-, tube-, and flower-like morphologies: Highly effective catalysts for the removal of toluene, Environ. Sci. Technol., 2012, 46, 4034–4041 CrossRef CAS PubMed
.
- D. Robinson and Y. Go, et al., Photochemical water oxidation by crystalline polymorphs of manganese oxides: Structure requirements for catalysis, J. Am. Chem. Soc., 2013, 135, 3494–3501 CrossRef CAS PubMed
.
- K. Stoerzinger and M. Risch, et al., Recent insights into manganese oxides in catalyzing oxygen reduction kinetics, ACS Catal., 2015, 5, 6021–6031 CrossRef CAS
.
- J. Hu and W. Li, Highly efficient copper-doped manganese oxide nanorod catalysts derived from CuMnO hierarchical nanowire for catalytic combustion of VOCs, Catal. Today, 2018, 314, 147–153 CrossRef CAS
.
- A. Poyraz and W. Song, et al., Crystalline mesoporous K2-xMn8O16 and MnO2 by mild transformations of amorphous mesoporous manganese oxides and their enhanced redox properties, ACS Appl. Mater. Interfaces, 2014, 6, 10986–10991 CrossRef CAS PubMed
.
- A. Silva, H. Fajardo and R. Balzer, Versatile and efficient catalysts for energy and environmental processes: Mesoporous silica containing Au, Pd and Au-Pd, J. Power Sources, 2015, 285, 460–468 CrossRef
.
- X. Liu, J. Zeng and J. Wang, Catalytic oxidation of methyl bromide using ruthenium-based catalysts, Catal. Sci. Technol., 2016, 6(12), 4337–4344 RSC
.
- Q. Zhang, Q. Li and M. Li, Internal stress and its effect on mechanical strength of metallic glass nanowires, Acta Mater., 2015, 91, 174–182 CrossRef CAS
.
- J. Chen, D. Yan and Z. Xu, A novel redox precipitation to synthesize Au-doped alpha-MnO2 with high dispersion toward low-temperature oxidation of formaldehyde, Environ. Sci. Technol., 2018, 52(8), 4728–4737 CrossRef CAS PubMed
.
- P. Topka, R. Delaigle and L. Kaluža, Performance of platinum and gold catalysts supported on ceria-zirconia mixed oxide in the oxidation of chlorobenzene, Catal. Today, 2015, 253, 172–177 CrossRef CAS
.
- Q. Meng, J. Liu and X. Weng, In situ valence modification of Pd/NiO nano-catalysts in supercritical water towards toluene oxidation, Catal. Sci. Technol., 2018, 8, 1858–1866 RSC
.
- Y. Li, Y. Fan and J. Jian, Pt-based structured catalysts on metallic supports synthesized by electroless plating deposition for toluene complete oxidation, Catal. Today, 2017, 281, 542–548 CrossRef CAS
.
- M. Baumer, J. Libuda and K. Neyman, Adsorption and reaction of methanol on supported palladium catalysts: microscopic-level studies from ultrahigh vacuum to ambient pressure conditions, Phys. Chem. Chem. Phys., 2007, 9(27), 3541–3558 RSC
.
- D. Debecker, B. Farin and E. Gaigneaux, Total oxidation of propane with a nano-RuO2/TiO2 catalyst, Appl. Catal., A, 2014, 481, 11–18 CrossRef CAS
.
- M. Haneda, M. Bonne and D. Duprez, Effect of Y-stabilized ZrO2 as support on catalytic performance of Pt for n-butane oxidation, Catal. Today, 2013, 201, 25–31 CrossRef CAS
.
- T. Liu, Y. Yao and L. Wei, Preparation and evaluation of copper–manganese oxide as a high-efficiency catalyst for CO oxidation and NO reduction by CO, J. Phys. Chem. C, 2017, 121(23), 12757–12770 CrossRef CAS
.
- J. Li, E. Yu and S. Cai, Noble metal free, CeO2/LaMnO3 hybrid achieving efficient photo-thermal catalytic decomposition of volatile organic compounds under IR light, Appl. Catal., B, 2019, 240, 141–152 CrossRef CAS
.
- Z. Rui, M. Tang and W. Ji, Insight into the enhanced performance of TiO2 nanotube supported Pt catalyst for toluene oxidation, Catal. Today, 2017, 297, 159–166 CrossRef CAS
.
- M. Jabłońska, A. Król and E. Kukulska-Zając, Zeolites Y modified with palladium as effective catalysts for low-temperature methanol incineration, Appl. Catal., B, 2015, 166–167, 353–365 CrossRef
.
- X. Yang, X. Yu and M. Lin, Interface effect of mixed phase Pt/ZrO2 catalysts for HCHO oxidation at ambient temperature, J. Mater. Chem. A, 2017, 5(26), 13799–13806 RSC
.
- J. Zou, Z. Si and Y. Cao, Localized surface plasmon resonance assisted photothermal catalysis of CO and toluene oxidation over Pd-CeO2 catalyst under visible light irradiation, J. Phys. Chem. C, 2016, 120(51), 29116–29125 CrossRef CAS
.
| This journal is © The Royal Society of Chemistry 2021 |


