 Open Access Article
Creative Commons Attribution 3.0 Unported Licence
Zr- and Ce-doped Li6Y(BO3)3 electrolyte for all-solid-state lithium-ion battery†
Toyoki Okumura *a,
Yoshitaka Shibab,
Noriko Sakamotob,
Takeshi Kobayashib,
Saori Hashimotob,
Kentaro Doguchib,
Harunobu Ogakib,
Tomonari Takeuchi
 a and
Hironori Kobayashia
aResearch Institute of Electrochemical Energy, National Institute of Advanced Industrial Science and Technology (AIST), Midorigaoka 1-8-31, Ikeda, Osaka 563-8577, Japan. E-mail: toyoki-okumura@aist.go.jp
bDevelopment Division, Canon Optron Inc., Kanakubo1744-1, Yuki, Ibaraki 307-0015, Japan
First published on 5th May 2021
Abstract
The ionic conductivity of Li6Y(BO3)3 (LYBO) was enhanced by the substitution of tetravalent ions (Zr4+ and Ce4+) for Y3+ sites through the formation of vacancies at the Li sites, an increase in compact densification, and an increase in the Li+-ion conduction pathways in the LYBO phase. As a result, the ionic conductivity of Li5.875Y0.875Zr0.1Ce0.025(BO3)3 (ZC-LYBO) reached 1.7 × 10⁻⁵ S cm−1 at 27 °C, which was about 5 orders of magnitude higher than that of undoped Li6Y(BO3)3. ZC-LYBO possessed a large electrochemical window and was thermally stable after cosintering with a LiNi1/3Mn1/3Co1/3O2 (NMC) positive electrode. These characteristics facilitated good reversible capacities in all-solid-state batteries for both NMC positive electrodes and graphite negative electrodes via a simple cosintering process.
Introduction
The steady evolution of new crystal systems with high ionic conductivities has recently heightened expectations for the realisation of all-solid-state batteries (ASSBs).1 Indeed, the successful demonstration of a high-rate-capacity ASSB has been reported with 10−2 S cm−1-class Li10GeP2S12 (LGPS)-type sulfide-based electrolytes.2 In the case of oxides, the reported conductivities of ≈10−3 S cm−1 in current oxide-based crystal systems (perovskites,3 NASICON types,4 and garnets5) have encouraged the realisation of oxide-based ASSBs because they are approaching the conductivities of non-aqueous liquid electrolytes (≈10−2 S cm−1). Oxide-based ASSBs are expected to be applied as on-board power sources for next-generation wireless Internet-of-Things devices because of their long-life performance and thermal stability. However, the discovery of better ion-conductive oxides is not always related to the enhancement of the performance of oxide-based ASSBs. This corresponds to another issue, that is, the difficulty of impurity-free interface formation between the active materials and oxide electrolyte during cosintering.6–10 Therefore, oxide-based ionic conductors that are both highly conductive and thermally stable with respect to the electrode materials are required for the development of electrolytes for sintered oxide-based ASSBs.The Li3BO3-related families have been considered as suitable electrolytes for fabricating good contacts at the electrode/electrolyte interface by cosintering. For example, Li3BO3 was used as an interfacial additive between LiCoO2 electrode particles and a garnet-type sintered electrolyte plate, and reversible charge–discharge capacities were demonstrated for the ASSB after cosintering at 700 °C, despite the low conductivity of Li3BO3 (σ < 10−7 S cm−1 at 150 °C).11,12 In a later report, a solid solution of Li2CO3 and Li3BO3, Li2.2C0.8B0.2O3, was described as a superior candidate for assembling the ASSB because of its better conductivity of ≈10−6 S cm−1 at 25 °C.13,14 Two other Li3BO3-related electrolytes—Li3BO3–Li2SO4 amorphous materials15 and LISICON-Li3BO3 amorphous materials16—were also attractive candidates, but the ASSBs were assembled according to their deformability due to their amorphous character rather than their thermal stability.
Among Li3BO3-related families, Lopez-Bermudez et al. proposed a solid solution of YBO3 and Li3BO3, that is, Li6Y(BO3)3 (LYBO), as a new crystal-type electrolyte candidate.17 The observed ionic conductivity was low at 1.9 × 10⁻⁸ S cm−1 at 50 °C because Li+-ion diffusion was permitted only by thermodynamic point-defect formation in the Li6Y(BO3)3. However, based on DFT calculations of the defect-formation energies and Li+-ion diffusion barriers, they suggested the structural superiority of Li+-ion diffusion in the LYBO-type structure, and mentioned the possibility of conductivity enhancement by aliovalent substitution.17
In the present study, we prepared tetravalent ion (Zr4+ and Ce4+)-doped LYBO-type materials and confirmed an ionic conductivity enhancement to ≈10−5 S cm−1 at 27 °C. Furthermore, the performance of oxide-based ASSBs was successfully demonstrated with the Zr- and Ce-doped Li5.875Y0.875Zr0.1Ce0.025(BO3)3 (ZC-LYBO) electrolyte because of its thermal stability to layered rock-salt positive electrodes, such as the LiNi1/3Mn1/3Co1/3O2 (NMC) positive electrode, and its large electrochemical window.
Experimental
Tetravalent ion-containing LYBO samples with various molar ratios, Li6−x−yY1−x−yZrxCey(BO3)3, were prepared using Li3BO3 (99.9% purity, Toshima Manufacturing Co., Japan), H3BO3 (99.5% purity, Kanto Chemical Co., Japan), Y2O3 (99.9% purity, Shin-Etsu Chemical Co., Japan), ZrO2 (99.9% purity, Nippon Denko Co., Japan), and CeO2 (99.9% purity, Shin-Etsu) as starting materials. An appropriate amount of each compound was weighed to obtain the desired molar ratio, and the mixture was ground using a mechanical milling technique (Pulverisette7, Fritsch). The mixture was pelletized and heated at 650 °C for 12 h. The reacted product was ground and sintered by spark-plasma sintering (SPS) at 600–700 °C for 10 min under a pressure of 30 MPa, to produce the tetravalent ion-containing LYBO compacts.The structural changes and purities of the samples were evaluated using synchrotron X-ray diffraction (SXRD) analysis (0.5 Å) performed at BL19B2, SPring-8, Sayo, Japan (2019B1881). Rietveld crystal structure refinement of the obtained SXRD patterns was performed using the RIETAN-FP software program,18 where a modified split pseudo-Voigt function19 was selected for fitting to best represent the profile parameters of the samples. To estimate the Li+-ion diffusion pathways in the structure, the refined structural parameters were used as the input file for bond valence site energy (BVSE) calculations, which were performed using SoftBV software.20,21 The structural images and maps were drawn using the VESTA software program.22
For ion conductivity measurements, both sides of the tetravalent ion-containing LYBO compacts were polished and coated with gold (via sputtering) as blocking electrodes. The AC impedance profile was collected with a frequency response analyser (Solartron, 1296) over a frequency range of 0.1 Hz to 1 MHz at 27 °C.
To measure the charge–discharge performance of the ASSB, a composite electrode powder consisting of 50 wt% active material and 50 wt% ZC-LYBO electrolyte was first prepared by mixing in an agate mortar. The active material was either LiNi1/3Mn1/3Co1/3O2 (NMC, Toda Kogyo Corp.) or graphite (JFE Chemical Corp.). The composite electrode powder (10 mg) and a Au plate as a current collector were placed on a ZC-LYBO-electrolyte separator of 30 mg in a 10 mm-diameter carbon die, which was heated at 550 °C with an electric current under a pressure of 30 MPa in the SPS process. Lithium foil was used as the counter electrode. A polyethylene oxide (PEO)-based polymer electrolyte film (Osaka Soda, LiTFSA/EO = 0.06) was placed between the lithium foil and the electrolyte side of the composite electrode/electrolyte pellet to reduce the interfacial resistance via adhesion.13
To confirm the reactivity of the composite electrode after cosintering, laboratory XRD patterns were collected on a diffractometer using Cu Kα radiation (Miniflex600, Rigaku). All XRD analyses were performed in the Bragg–Brentano geometry mode. The microstructure of the composite electrode was observed using field-emission scanning electron microscopy (FE-SEM; JEOL, JSM-5500LV).
To evaluate the electrochemical stability of the ZC-LYBO electrolyte, a metal substrate (Au or Cu) was placed on a ZC-LYBO electrolyte (100 mg) in a 10 mm-diameter carbon die, which was heated at 550 °C with an electric current under a pressure of 30 MPa in the SPS process. Lithium foil and a PEO-based polymer electrolyte film were used as the counter electrode and interfacial connector, respectively.
Results and discussion
Structural changes and purities of tetravalent ion-doped LYBO
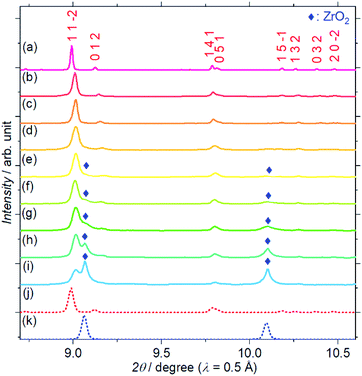
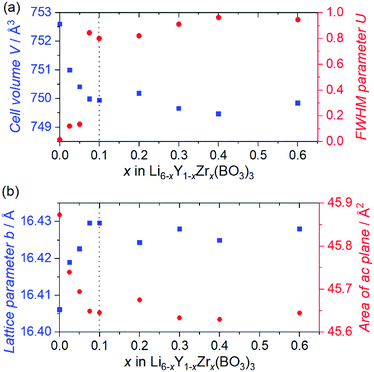
Fig. 1 shows the SXRD patterns of the Zr4+ ion-containing LYBO samples, Li6−xY1−xZrx(BO3)3 (0 ≤ x ≤ 0.6). The I(1 1 −2) diffraction peak is clearly shifted to a higher angle with an increasing amount of Zr4+ until x ≈ 0.1 in Li6−xY1−xZrx(BO3)3 because of the difference in ionic radii: 1.019 Å for Y3+ and 0.84 Å for Zr4+ in dodecahedral coordination.23 In addition, the I(1 1 −2) diffraction peak is broadened with an increasing amount of Zr4+ ions, which corresponds to the lattice distortion of the LYBO-type structure in addition to the aforementioned mismatch of ionic radii, which will be discussed later. Furthermore, the ZrO2 impurity phase begins to appear from x ≈ 0.1.Rietveld refinements of the SXRD patterns were performed to clarify the structural changes caused by the Zr4+ ions. The refined patterns for typical samples and the estimated parameters for all the samples are summarised in Fig. S2(a–c), and Table S1,† respectively. Fig. 2(a) shows the changes in the cell volume and full-width-at-half-maximum (FWHM) parameter U for the LYBO-type phases estimated from the refinements. Herein, U is one of the simulated components for representing the FWHMs of the total diffraction patterns based on the Caglioti formula24 under Rietveld refinement.
FWHM2 = U![[thin space (1/6-em)]](https://www.rsc.org/images/entities/char_2009.gif) tan2 tan2![[thin space (1/6-em)]](https://www.rsc.org/images/entities/char_2009.gif) θBragg + V θBragg + V![[thin space (1/6-em)]](https://www.rsc.org/images/entities/char_2009.gif) tan tan![[thin space (1/6-em)]](https://www.rsc.org/images/entities/char_2009.gif) θBragg + W θBragg + W |
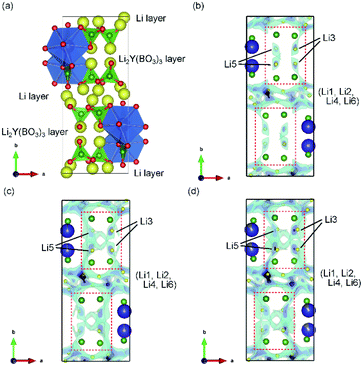
Thus, U represents the FWHM corresponding to the structural distortion in a sample. It should be noted that the structural distortion is difficult to discuss quantitatively in this study because a modified split pseudo-Voigt function19 was used to refine the profiles. Despite the difficulties in this case, the definite change in U due to the Zr4+ ion is strongly related to the structural distortion until x ≈ 0.1 in Li6−xY1−xZrx(BO3)3, which is due to the substitution of smaller Zr4+ ions at the Y3+ sites. The shrinkage of the cell volume until x ≈ 0.1 is also proof of Zr4+-ion doping. When x > 0.1, these changes are suppressed because of the limits of Zr4+-ion doping into the LYBO-type structure; thereafter, the ZrO2 impurity (and Li–B–O impurities, mainly Li6B4O9) is observed. Moreover, the lattice parameter b and area of the ac plane are shown separately in Fig. 2(b). The LYBO-type structure has a layered structure that is constructed by the stacking of the Li2Y(BO3)3 layer and the Li layer along the b-axis, as shown in Fig. 3(a). The shrinkage of the YO8 dodecahedra upon doping with smaller Zr4+ ions until x ≈ 0.1 directly reduces the area of the ac plane. On the other hand, the lattice parameter b is expanded until x ≈ 0.1 because of the decrease in Coulomb repulsion force at the Li layer due to the lack of Li+ ions under the doping of Zr4+ ions into Li6−xY1−xZrx(BO3)3. This tendency is similar to the change in the lattice parameter c during the electrochemical de-lithiation of layered rock-salt Li1−xCoO2.25 Therefore, Li+ ions are likely to be removed from the Li layer rather than from the Li2Y(/Zr)(BO3)3 layer by doping Zr4+ ions into Li6−xY1−xZrx(BO3)3, which is supported by previous DFT calculation results in which the Li defect energies at the Li layer are lower than those at the Li2Y(BO3)3 layer in Li6Y(BO3)3.17
Li-ion conductive pathways
The Li+-ion diffusion pathways in the LYBO-type structure were examined from bond-valence site energy (BVSE) maps; the ab and ac planes are shown in Fig. 3(b–d) and S3(b–d),† respectively. The BVSE maps present the theoretical mobile Li+-ion pathways as clouds with low bond valence site energies. Although the mobile Li+ ions form a 2D diffusion pathway network at the Li layer on the ac plane [Fig. S3(b)†], it is difficult for Li+ ions to diffuse along the b axis via Li3 or Li5 sites in undoped Li6Y(BO3)3, as shown by the red dashed boxes in Fig. 3(b). This was previously suggested from DFT calculations.17 As shown in Fig. 3(c, d), the expansion of the diffusion pathways along the b-axis could be induced by doping Zr4+ ions into Li6−xY1−xZrx(BO3)3, which indicates that the structural distortion in the Li2Y(/Zr)(BO3)3 layer contributed to expanding the diffusion pathways. The 2D diffusion pathways in the Li layer also become thin, as can be confirmed from Fig. S3(c, d).† These results indicate that Li+ ions are more easily diffused by the structural distortion associated with doping Zr4+ ions into Li6−xY1−xZrx(BO3)3. The activation energies for the 2D and 3D pathways estimated from BVSE decrease from 0.57 and 0.69 eV to 0.49 and 0.59 eV, respectively, even by doping with only x = 0.025 Zr4+ ions into Li6−xY1−xZrx(BO3)3.Ionic conductivities
Fig. 4 shows the ionic conductivity dependence when Zr4+ ions are incorporated into Li6−xY1−xZrx(BO3)3 (0 ≤ x ≤ 0.1). The observed conductivity at 27 °C is drastically enhanced from 5.6 × 10⁻¹¹ to 5.8 × 10⁻⁶ S cm−1 by doping with x = 0.025 Zr4+ ions into Li6−xY1−xZrx(BO3)3. Li+-ion diffusion in Li-ion fully occupied Li6Y(BO3)3 occurs only through the formation of a few thermodynamic point defects. In contrast, the substitution of tetravalent Zr4+ ions in the Y3+ sites results in the intentional formation of vacancies at Li sites in the structure, which contributes to the conductivity enhancement. Additionally, the observed conductivities are sensitive to the relative densities of the Li6−xY1−xZrx(BO3)3 compacts, which are summarised in Table S2.† For example, the observed conductivity in a low-density Li3.5Ge0.75S0.25O4 compact (79%) was over a hundred times lower than a high density compact (∼90%).26 Therefore, the increase in relative density upon doping with Zr4+ ions, from 77% (x = 0) to ∼90% (x > 0), also contributes to the ionic conductivity enhancement. Moreover, the expansion of 3D diffusion pathways by Zr4+ doping, as estimated by the Rietveld analyses, would also affect the enhancement. To confirm this effect, the structure and conductivity of Ce-doped Li5.975Y0.975Ce0.025(BO3)3 were also examined. The ionic radius for the Ce4+ ion dopant in dodecahedral coordination is 0.97 Å, which is more comparable to that for the Y3+ ion (1.019 Å) than the Zr4+ ion dopant (0.84 Å).23 Therefore, the lattice distortion by doping the tetravalent ion is supressed; the lattice distortion in Ce-doped Li5.975Y0.975Ce0.025(BO3)3 (U = 0.02354 deg2) is closer to that in undoped Li6Y(BO3)3 (U = 0.01488 deg2) than that in Zr-doped Li5.975Y0.975Zr0.025(BO3)3 (U = 0.119 deg2), as can be confirmed in Table S1.† Considering the conductivities shown in Table S3,† that of the LYBO-type structure is drastically enhanced by 0.025 Ce4+ doping (Li5.975Y0.975Ce0.025(BO3)3; σ = 6.9 × 10⁻⁷ S cm−1 at 27 °C), which is due to the formation of vacancies at Li sites in the structure and the increase in compact densification, as discussed above. However, the conductivity of the Ce4+-ion doped sample is over ten times lower than that of the Zr4+-ion doped one. This difference indicates that the structural distortion associated with the doping of the larger Zr4+ ions certainly affects the enhancement of the conductivity. The differences in the Li+-ion diffusion pathways estimated from the BVSE maps also support the aforementioned results: for the less-structurally-distorted Ce4+-ion doped sample (Fig. S4(a, b)†), the diffusion pathway along the b-axis in the BVSE map is nearly unchanged. Therefore, Zr4+-ion doping exerts three types of effects that enhance the conductivity of the LYBO-type structure: (1) the formation of vacancies at Li sites, (2) an increase in compact densification, and (3) an increase in the Li+-ion conduction pathways in the LYBO phase associated with structural distortion. The highest conductivity in Zr4+-ion-doped Li6−xY1−xZrx(BO3)3 at 27 °C is 1.4 × 10⁻⁵ S cm−1 at x = 0.10. However, Zr4+-ion doping achieves a limit at x ≈ 0.1 in Li6−xY1−xZrx(BO3)3, which would be due to the large mismatch of ionic radii. Therefore, the conductivity decreases for x > 0.1 (Table S3†), with increases in the amounts of ZrO2 and Li–B–O impurities.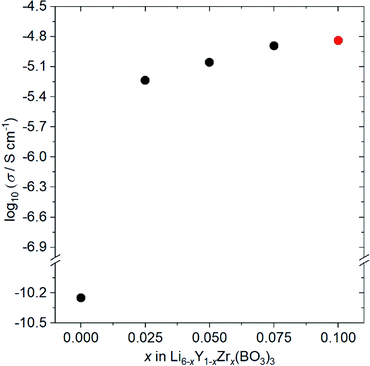 | ||
| Fig. 4 Ionic conductivity dependence on the composition of Li6−xY1−xZrx(BO3)3 (0 ≤ x ≤ 0.10) at 27 °C. Li5.9Y0.9Zr0.1(BO3)3 (x = 0.10) contains small amount of ZrO2 impurity (red circle). | ||
The conductivity of Zr,Ce-doped Li5.875Y0.875Zr0.1Ce0.025Zr0.1(BO3)3 (ZC-LYBO) was also measured, and the obtained value of 1.7 × 10⁻⁵ S cm−1 at 27 °C is the highest conductivity of LYBO-type oxides to date. The structural information estimated from Rietveld analysis, Li+-ion diffusion pathways estimated from BVSE maps, and relative densities of the compacts are summarised in Table S1, Fig. S3(d), and Table S2.† Compared with Zr-doped Li5.9Y0.9Zr0.1(BO3)3, a slight enhancement in conductivity is confirmed, but the reason is difficult to determine in the present study. The conductivity measurement results indicate the possibility of further enhancement by other aliovalent substitutions. Moreover, the control of structural distortion is one of the keys for enhancing the conductivity of the LYBO-type structure. It should be noted that the activation energies estimated from Arrhenius plots (Fig. S5†) were 0.43 eV for both Zr-doped Li5.9Y0.9Zr0.1(BO3)3 and Zr,Ce-doped Li5.875Y0.875Ce0.025Zr0.1(BO3)3 (ZC-LYBO). Based on its high conductivity, ZC-LYBO was used as the electrolyte in subsequent ASSB studies.
Thermal stability after cosintering with layered rock-salt oxide active material
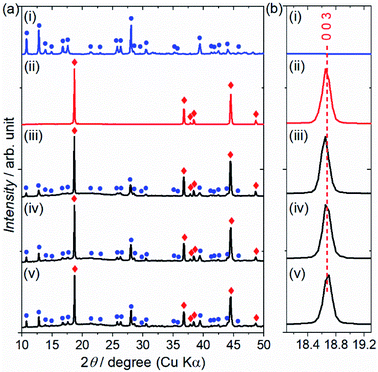
The reactivity of the layered rock-salt LiNi1/3Mn1/3Co1/3O2 (NMC) electrode and ZC-LYBO electrolyte after cosintering was evaluated by laboratory XRD patterns (Fig. 5(a)). None of the XRD peaks are associated with impurities, and no significant peak shifts after co-sintering are observed for either the NMC electrode or ZC-LYBO electrolyte, as shown for a typical peak in Fig. 5(b). Thus, interdiffusion between the NMC and ZC-LYBO was minimal, with no penetration of the bulk materials during cosintering. This result indicates that ZC-LYBO is thermally stable with a layered rock-salt NMC electrode.The cross-sectional microstructure of the NMC + ZC-LYBO composite electrode after the 550 °C SPS process was also investigated. As shown in Fig. 6(a), the NMC electrode particles (light grey) are embedded in the ZC-LYBO electrolyte (dark grey). Moreover, no micropores are present near the NMC electrodes because the ZC-LYBO electrolyte was densified after SPS. No evidence of diffusion is found in the EDX mappings for Co [NMC electrode, Fig. 6(b)], Y, and Zr [ZC-LYBO electrolyte, Fig. 6(c and d)]. This indicates that the ZC-LYBO electrolyte and NMC electrode can be co-sintered without the formation of any interfacial impurities, which is one of the rare characteristics of the electrolyte and is not possible with other popular oxide-electrolyte candidates (e.g. perovskite-type conductors, NASICONs, and garnet-type conductors).
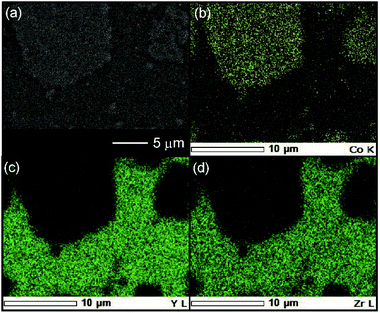 | ||
| Fig. 6 (a) Cross-sectional SEM image at the NMC–ZC-LYBO interface after SPS at 550 °C, with the corresponding EDX elemental maps for (b) Co, (c) Y, and (d) Zr. | ||
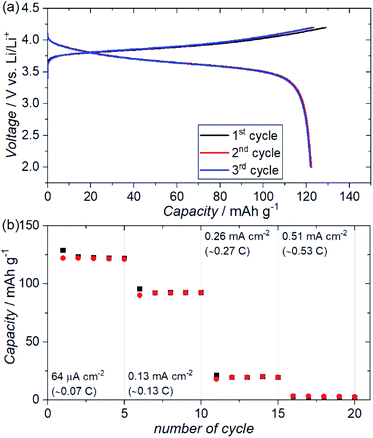
Fig. 7(a) shows the charge–discharge profiles for an ASSB (NMC + ZC-LYBO composite electrode|ZC-LYBO separator|dry polymer|Li metal) assembled via SPS. A reversible capacity of ∼120 mA h g−1 is observed at 60 °C owing to the impurity-free sintered interface between the NMC and ZC-LYBO. The charge–discharge capacity retentions at various current densities are shown in Fig. 7(b). Although the capacity decreases at higher current densities, relatively stable capacity retention under cycling for each current density is observed for the ASSB. In fact, the rate performance of the ASSB using the ZC-LYBO electrolyte is lower than that using LISICON-type Li3.5Ge0.5V0.5O4 (LGVO), which has also been reported as a thermally stable electrolyte with an NMC electrode.27 This is due to the lower conductivity of ZC-LYBO compared to Li3.5Ge0.5V0.5O4 (i.e. 9.6 × 10⁻⁵ S cm−1 at 25 °C).27 However, a broader acceptance of aliovalent substitutions in the less-reported LYBO-type electrolytes could lead to the development of a more highly ion-conductive LYBO family, analogous to the advances achieved with other electrolyte candidates.1
Electrochemical window
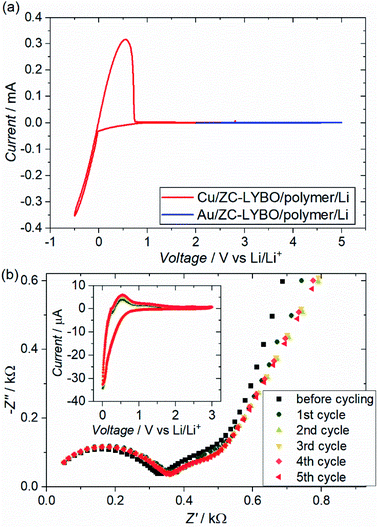
Fig. 8(a) shows the cyclic voltammograms (CVs) of test cells (metal substrate|ZC-LYBO electrolyte|dry polymer|Li metal) assembled by SPS. We evaluated the electrochemical stability of the ZC-LYBO electrolyte in the low-voltage range from 3.0 to −0.5 V vs. Li/Li+ and in the high-voltage range from 2.0 to 5.0 V vs. Li/Li+ with a Cu substrate (red) and an Au substrate (blue), respectively. The ZC-LYBO electrolyte is stable at high voltages. Au is kinetically stable within a wide electrochemical window but produces LixAuy alloys at voltages below 0.2 V vs. Li/Li+ when in contact with Li metal.28,29 Therefore, Cu was used as the substrate to evaluate the low-voltage stability.30 Cathodic and anodic currents corresponding to Li metal deposition (Li+ + e− → Li) and dissolution (Li → Li+ + e−), respectively, are observed at 0![[thin space (1/6-em)]](https://www.rsc.org/images/entities/char_2009.gif) V vs. Li/Li+. Although the ZC-LYBO electrolyte is nearly electrochemically stable in the range from 0.0 to 5.0 V vs. Li/Li+, a slight cathodic peak can be observed below ≈1.0 V vs. Li/Li+. Thus, the CVs under 5 cycles in the range from 3.0 to 0.0 V vs. Li/Li+ were also recorded (Fig. 8(b), insert). A slight cathodic peak continuously appears in each CV cycle and is irreversible, which would result in decomposition on the surface of the ZC-LYBO electrolyte at low voltage. Fig. 8(b) shows the conductivity change for the LYBO electrolyte after each CV cycle. Despite the continuous appearance of a cathodic peak, the Nyquist plots, including the resistance in the ZC-LYBO electrolyte, change less. Therefore, ZC-LYBO can also be used as an electrolyte with a low-voltage negative electrode.
V vs. Li/Li+. Although the ZC-LYBO electrolyte is nearly electrochemically stable in the range from 0.0 to 5.0 V vs. Li/Li+, a slight cathodic peak can be observed below ≈1.0 V vs. Li/Li+. Thus, the CVs under 5 cycles in the range from 3.0 to 0.0 V vs. Li/Li+ were also recorded (Fig. 8(b), insert). A slight cathodic peak continuously appears in each CV cycle and is irreversible, which would result in decomposition on the surface of the ZC-LYBO electrolyte at low voltage. Fig. 8(b) shows the conductivity change for the LYBO electrolyte after each CV cycle. Despite the continuous appearance of a cathodic peak, the Nyquist plots, including the resistance in the ZC-LYBO electrolyte, change less. Therefore, ZC-LYBO can also be used as an electrolyte with a low-voltage negative electrode.
The charge–discharge profiles for a battery (Cu|graphite negative electrode + ZC-LYBO composite electrode|ZC-LYBO separator|dry polymer|Li metal) assembled by the SPS process are shown in Fig. 9. A typical reversible Li-ion (de)intercalation reaction for a graphite negative electrode is observed, and a first discharge capacity of ∼200 mA h g−1 was obtained along with a large irreversible capacity for each cycle. The irreversible capacity is related to the slight anodic reaction below 1.0 V Li/Li+ (Fig. 8).
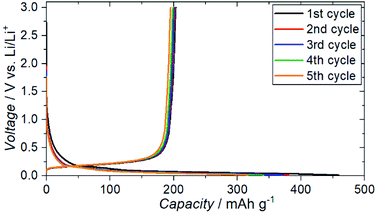 | ||
| Fig. 9 Electrochemical charge–discharge profiles of Cu|graphite + ZC-LYBO composite electrode|ZC-LYBO separator|dry polymer|Li metal. | ||
Among the various oxide-type electrolytes, ZC-LYBO is rare; it is possible to assemble ASSBs by sintering with both layered lock-salt positive electrodes such as NMC and low-voltage negative electrodes such as graphite. LISICON-type Li3.5Ge0.5V0.5O4 (LGVO) can also be cosintered with layered rock-salt positive electrodes but decompose at low voltage because of the presence of Ge4+ and V5+ ions.27 In fact, other Li3BO3-related families such as Li2.2C0.8B0.2O3 (ref. 13 and 14) and LISICON-Li3BO3 (ref. 16) are stable at low voltage, although conductivities are limited to ≈10−6 S cm−1 at 25 °C. Therefore, the LYBO-type crystal system may be an attractive candidate for assembling ASSBs by sintering after further enhancing the conductivity via aliovalent substitution. Even the ZC-LYBO in the present study can be used as an ion-conductive ceramic binder for sintering ASSBs instead of low-ion-conductive Li3BO3,12 which has been used to connect LiCoO2 electrodes and high-ion-conductive garnet-type electrolytes.11
Conclusions
We substituted tetravalent ions (Zr4+ and Ce4+) for the Y3+ sites in the Li6Y(BO3)3 (LYBO)-type structure to enhance conductivity. The ionic conductivities of Zr-doped Li5.9Y0.9Zr0.1(BO3)3 and Zr,Ce-doped Li5.875Y0.875Ce0.025Zr0.1(BO3)3 (ZC-LYBO) were respectively 1.4 × 10⁻⁵ and 1.7 × 10⁻⁵ S cm−1 at 27 °C, which are some of highest conductivities reported for Li3BO3-related electrolyte candidates. The effects of Zr4+-ion doping on the conductivity of the LYBO-type structure were revealed from the structural information estimated from Rietveld analysis, relative density of compacts, and Li+-ion diffusion pathways estimated from BVSE maps, and included: (1) the formation of vacancies at Li sites, (2) the increase of compact densification, and (3) an increase in the Li+-ion conduction pathways in the LYBO phase associated with structural distortion.Furthermore, sintered ASSBs using ZC-LYBO as an electrolyte successfully performed with both a LiNi1/3Mn1/3Co1/3O2 (NMC) positive electrode and a graphite negative electrode. This was due to the thermal stability of the layered rock-salt oxide and the electrochemical stability of the ZC-LYBO at low voltages. The conductivity of the LYBO-type electrolyte could be further enhanced by other aliovalent substitutions for the practical use of sintered ASSBs. The control of the structural distortion associated with the dopant size, which was revealed in this study, could play an important role in this enhancement.
Conflicts of interest
There are no conflicts to declare.Acknowledgements
T. O. would like to thank Miyuki Nakajima for technical support with the operating batteries.References
- F. Zheng, M. Kotobuki, S. Song, M. O. Lai and L. Lu, J. Power Sources, 2018, 389, 198–213 CrossRef CAS.
- N. Kamaya, K. Homma, Y. Yamakawa, M. Hirayama, R. Kanno, M. Yoneyama, T. Kamiyama, Y. Kato, S. Hama, K. Kawamoto and A. Mitsui, Nat. Mater., 2011, 10, 682–686 CrossRef CAS PubMed.
- Y. Inaguma, C. Liquan, M. Itoh, T. Nakamura, T. Uchida, H. Ikuta and M. Wakihara, Solid State Commun., 1993, 86, 689–693 CrossRef CAS.
- G. Adachi, N. Imanaka and H. Aono, Adv. Mater., 1996, 8, 127–135 CrossRef CAS.
- V. Thangadurai, H. Kaack and W. J. F. Weppner, J. Am. Ceram. Soc., 2003, 86, 437–440 CrossRef CAS.
- G. Vardar, W. J. Bowman, Q. Lu, J. Wang, R. J. Chater, A. Aguadero, R. Seibert, J. Terry, A. Hunt, I. Waluyo, D. D. Fong, A. Jarry, E. J. Crumlin, S. L. Hellstrom, Y. Chiang and B. Yildiz, Chem. Mater., 2018, 30, 6259–6276 CrossRef CAS.
- K. Park, B. C. Yu, J. W. Jung, Y. T. Li, W. D. Zhou, H. C. Gao, S. Son and J. B. Goodenough, Chem. Mater., 2016, 28, 8051–8059 CrossRef CAS.
- L. Miara, A. Windmuller, C. L. Tsai, W. D. Richards, Q. L. Ma, S. Uhlenbruck, O. Guillon and G. Ceder, ACS Appl. Mater. Interfaces, 2016, 8, 26842–26850 CrossRef CAS PubMed.
- M. Gellert, E. Dashjav, D. Gruner, Q. L. Ma and F. Tietz, Ionics, 2018, 24, 1001–1006 CrossRef CAS.
- M. F. Groh, M. J. Sullivan, M. W. Gaultois, O. Pecher, K. J. Griffith and C. P. Grey, Chem. Mater., 2018, 30, 5886–5895 CrossRef CAS.
- S. Ohta, S. Komagata, J. Seki, T. Saeki, S. Morishita and T. Asaoka, J. Power Sources, 2013, 238, 53–56 CrossRef CAS.
- R. D. Shannon, B. E. Taylor, A. D. English and T. Berzins, Electrochem. Acta, 1977, 22, 783 CrossRef CAS.
- T. Okumura, T. Takeuchi and H. Kobayashi, Solid State Ionics, 2016, 288, 248–252 CrossRef CAS.
- T. Okumura, T. Takeuchi and H. Kobayashi, J. Ceram. Soc. Jpn., 2017, 125, 276–280 CrossRef CAS.
- M. Tatsumisago, R. Takano, K. Tadanaga and A. Hayashi, J. Power Sources, 2014, 270, 603–607 CrossRef CAS.
- T. Okumura, S. Taminato, Y. Miyazaki, M. Kitamura, T. Saito, T. Takeuchi and H. Kobayashi, ACS Appl. Energy Mater., 2020, 3, 3220–3229 CrossRef CAS.
- B. Lopez-Bermudez, W. G. Zeier, S. Zhou, A. J. Lehner, J. Hu, D. O. Scanlon, B. J. Morgan and B. C. Melot, J. Mater. Chem. A, 2016, 4, 6972–6979 RSC.
- F. Izumi and K. Momma, Solid State Phenom, 2007, 130, 15–20 CAS.
- F. Izumi and T. Ikeda, Mater. Sci. Forum, 2000, 321–324, 198 CAS.
- H. Chen, L. L. Wong and S. Adams, Acta Crystallogr., Sect. B: Struct. Sci., Cryst. Eng. Mater., 2019, 75, 18–33 CrossRef CAS PubMed.
- H. Chen and S. Adams, IUCrJ, 2017, 4, 614–625 CrossRef CAS PubMed.
- K. Momma and F. Izumi, J. Appl. Crystallogr., 2011, 44, 1272–1276 CrossRef CAS.
- R. D. Shannon, Acta Crystallogr., Sect. A: Cryst. Phys., Diffr., Theor. Gen. Crystallogr., 1976, 32, 751–767 CrossRef.
- G. Caglioti, A. Paoletti and F. P. Ricci, Nucl. Instrum., 1958, 3, 223–228 CrossRef CAS.
- T. Okumura, Y. Yamaguchi, M. Shikano and H. Kobayashi, J. Mater. Chem., 2012, 22, 17340 RSC.
- T. Okumura, S. Taminato, T. Takeuchi and H. Kobayashi, ACS Appl. Energy Mater., 2018, 1, 6303–6311 CrossRef.
- T. Okumura, T. Takeuchi and H. Kobayashi, ACS Appl. Energy Mater., 2021, 4, 30–34 CrossRef CAS.
- A. D. Pelton, Bull. Alloy Phase Diagrams, 1986, 7, 228–231 CrossRef CAS.
- P. Bach, M. Stratmann, I. Valencia-Jaime, A. H. Romero and F. U. Renner, Electrochim. Acta, 2015, 164, 81–89 CrossRef CAS.
- A. D. Pelton, Bull. Alloy Phase Diagrams, 1986, 7, 142–144 CrossRef CAS.
Footnote |
| † Electronic supplementary information (ESI) available: Synchrotron X-ray diffraction patterns, structural information, and additional BVSE maps, and relative densities, ionic conductivities, and Arrhenius plots of compacts (PDF). See DOI: 10.1039/d1ra02191e |
| This journal is © The Royal Society of Chemistry 2021 |

