 Open Access Article
Creative Commons Attribution 3.0 Unported Licence
Dynamic ionic radius of alkali metal ions in aqueous solution: a pulsed-field gradient NMR study†
Kikuko Hayamizu *a,
Yusuke Chiba
 b and
Tomoyuki Haishic
aInstitute of Applied Physics, Tsukuba University, Tennodai, Tsukuba 305-8573, Japan. E-mail: hayamizu.k3@gmail.com
bGraduate School of Pure and Applied Sciences and Tsukuba Research Center for Energy, Materials Science (TREMS), University of Tsukuba, Tennodai, Tsukuba 305-8573, Japan
cMRTechnology, TCI-B5, Sengen, Tsukuba 305-0047, Japan
First published on 7th June 2021
Abstract
The dynamic behavior of alkali metal ions, Li+, Na+, K+, Rb+ and Cs+ in aqueous solutions is one of the most important topics in solution chemistry. Since these alkali metals contain nuclear magnetic resonance (NMR) active nuclei, it is possible to directly measure the diffusion constants of the alkali metal ions using the pulsed field gradient (PFG) NMR method. In this paper, the 7Li, 23Na, 87Rb, 133Cs and 1H resonances are observed for diffusion constants in aqueous solution and the solvent H2O. Until now, the values of the diffusion constant have been lacking when discussing hydration effects around alkali metal ions. It is known that the static ionic radius (Rion) increases with increasing the atomic number, and the experimental diffusion constants also increase with increasing the atomic number, which is opposite to the Stokes–Einstein (SE) relation. It suggests that alkali metal ions diffuse through a space of 10−6 m accompanying the hydrated spheres with a time interval of 10−3 s. For each alkali metal ion, the dynamic ionic radius is evaluated.
Introduction
The behavior of alkaline salts in aqueous solutions is an important topic in solution chemistry. Hydrated ions in aqueous solutions have been the subject of numerous studies and fundamental studies have been reviewed.1,2 Various techniques have been continuously used for studies on the hydration of the alkali metal ions, for example, in recent papers, neutron diffraction,3 large-angle X-ray scattering and double-reference infrared (IR) spectroscopy,4 oxygen K-edge X-ray absorption spectroscopy,5 and theoretical approaches.6–8 Most studies are concerned with the short-range effects of the hydration of alkali metal ions. Because these alkali metals include nuclear magnetic resonance (NMR) active nuclei, the diffusion constants could be measured directly using the pulsed-field gradient (PFG) NMR method. In this paper, the 7Li, 23Na, 87Rb, 133Cs and 1H resonances were observed for the diffusion constants of the alkali metal ions and the solvent H2O. The diffusion measurements were performed in a time scale of 10−3 s and were very long compared with the X-ray, IR, and neutron diffraction spectroscopy, and belong to macroscopic properties such as viscosity and ionic conductivity. The PFG-NMR method measures positional migration over a space of 10−6 m. Although measurements of viscosity and ionic conductivity have been widely conducted, experimental values of diffusion constants are limited.The relationship between the diffusion constant D and the viscosity (η) is known as the Stokes–Einstein (SE) equation:
 | (1) |
The PFG-NMR method can afford directly the diffusion constants of NMR active nuclei. As D is related to the ionic conductivity via the Nernst–Einstein relation, the experimental D values of Li solution electrolytes for Li-ion batteries (LIB) have been piled up for Li+(7Li) and anions (19F, 11B, and others) in organic solvents.10
Ionic liquids are another class of solution electrolyte and we have reported temperature-dependent physical constants such as density, ionic conductivity, η, and D for various ionic liquids and Li salt-doped ionic liquids. D is macroscopic in nature, and each electrolyte component has a different value, which can be measured independently for an individual nucleus. Experimental values of D relate well with the experimental η by the SE relation. The plots of D versus kT/πη are always linear and the gradients afford the experimental values of 1/crs. Discussion on the constant c and the Stokes radius rs is necessary for practical systems. Reasonable rs values may be calculated by molecular orbital methods, and the c values were evaluated experimentally in ionic liquid systems. We have reported the experimental c values in the SE relation for the cations, anions and solvated Li+ in ionic liquids composed of cations, 1-ethyl-3-methylimidazolium (EMIm) and N-methyl-N-propyl-pyrrolidinium (P13).11,12 The anions were bis(trifluoromethanesulfonyl)amide (TFSA) and bis(fluorosulfonyl)amide (FSA) and the systems were prepared without and with doping of a Li salt. Using the temperature-dependent values of D and η, the plots of D versus k/πη were always linear. From the gradient of 1/crs, experimental value of crs was evaluated for each component. The c value was estimated assuming that the rs value is the van del Waals radius of the molecular orbital calculation. The approximate c values were 2.4 to 3.1 for cations (EMIm and P13), 2.7 to 3.7 for anions (TFSA and FSA), and 3.5 to 4.5 for the Li+ solvated by anions. In the ionic liquid systems, the c values of the cation are smaller than those of the anion. It indicates that the experimental measurable values D and η are well explained by the SE relation, and the crs value is a constant in each system. It is important to note that c is not a universal constant.
In recent years, alkali metals and alkaline earth metals such as Na+, K+, Mg2+, and Ca2+ have been targeted for next-generation energy storage systems from the viewpoint of resource conservation. To date, organic solvents have been widely used in LIBs. The possibility of using aqueous solutions is being explored for the prevention of volatility, in addition of the usages of polymer and solid electrolytes. Similarly, fuel cell technology is important in its contribution to power sources. In 1988, diffusion coefficients of Li+, Na+, and Cs+ were observed using steady-state field gradient spin-echo NMR method in aqueous solutions.13 Recently, 1H+, 7Li+, 23Na+ and 133Cs+ diffusion constants were measured in cation-exchange membranes by the PFG-NMR method.14 Furthermore, Na+ and K+ ions are important in biological systems. In humans, Na+ is present outside the cells and K+ inside the cells. In particular, Na+ circulates mainly in the form of blood, and its concentration is maintained by the kidneys. Na+ is the main factor in the formation of osmotic pressure to retain water.
We observed the diffusion constants of 7Li+, 23Na+, 87Rb+ and 133Cs+ in aqueous solutions. Using the reported values of D and η of pure H2O, the c value was estimated to be 4.8. From the experimental diffusion constants of alkali metal ions and solvent H2O, the dynamic radius of each alkali metal ion is proposed. The large hydration ability of Li and Na ions is discussed.
Experimental
The PFG NMR measurements were performed at 303 K by using a Tecmag Apollo and an NT-NMR console (Houston, TX) equipped with a JEOL PFG-probe with a well-shaped rectangular PFG of the maximum strength is 24 Tm−1 (Tokyo). The basic properties of each nuclei are summarized in Table 1, where the T1 and T2 values of the alkali metal ions were obtained in the diluted aqueous solutions at 303 K in this study. The T1 and T2 values are important to determine the diffusion measuring conditions. The PFG NMR pulse sequences are shown for the Hahn echo pulse sequence (1H, 7Li, 23Na, and 133Ce) and the stimulated echo pulse sequence (87Rb) in Fig. S1 in ESI.† The T1 and T2 values at 303 K are sufficiently long for 1H, 7Li, 23Na, and 133Cs to use the Hahn-echo PFG NMR pulse sequence and the measurements were performed with the PFG strength 1.26 Tm−1. The precise measurement details are described in the ESI.† Because the T1 and T2 values of 87Rb+ were extremely short, the stimulated echo PFG pulse sequence was used with the g value of 10.0 Tm−1 (Fig. S2, ESI†). 39K belongs to a low-γ nuclei and a JEOL ECZ-400 spectrometer can measure the 39K spectra at 18.6 MHz. The T1 and T2 values for 39K were short (Table 1). Unfortunately, the maximum PFG strength equipped was 0.3 Tm−1. Several attempts were made to obtain the 39K diffusion constant for the saturated aqueous solution (3 M), but a reliable D value for K+ could not be obtained because of poor decay of the echo attenuation. The repetition time of every experiment including relaxation time measurement was set at least five times longer than T1| Nucleus | T1 | T2 | Frequency (MHz) | I | Qb (10−31 m2) |
|---|---|---|---|---|---|
| a Observed by a JEOL ECZ-400 spectrometer at the field strength of 9.404 T.b Nuclear quadrupole moment from Bruker NMR properties of selected isotopes. | |||||
| 7Li | 25 s | 5 s | 78.45 | 3/2 | −40.1 |
| 23Na | 46 ms | 23 ms | 53.39 | 3/2 | 104 |
| 39K | 64 ms | 32 ms | 18.68a | 3/2 | 58.5 |
| 87Rb | 1.8 ms | 1.2 ms | 27.85 | 3/2 | 133.5 |
| 133Cs | 9 s | 1.2 s | 26.47 | 7/2 | −3.43 |
| 1H (H2O) | 3.5 s | — | 201.85 | 1/2 | — |
The aqueous sample was placed in a 5 mm NMR microtube (BMS-005J, Shigemi, Tokyo) to a height of 5 mm. The aqueous LiCl and NaCl samples were prepared by diluting concentrated samples.
Results and discussion
Concentration dependences of diffusion constants for Li+, Na+ and solvent H2O
The salt concentration dependences of the diffusion constants for 7Li (DLi), 23Na (DNa), and 1H solvent H2O (DH2O–Li and DH2O–Na) are shown in Fig. 1. In homogenous solutions, a unique diffusion constant (D) can be determined independently of measurement conditions such as the diffusion time (Δ). In diluted regions (≤2 M), each diffusion constant was a single component without dependence of Δ (10−3 s order). The obtained D values are physical constants because of independence of the measuring parameters of PFG-NMR. In general, for heterogeneous materials such as zeolites and solid electrolytes, the apparent diffusion constant may depend on Δ and g, in which case the diffusion constant as a physical constant cannot be obtained. In very concentrated regions (≥4 M), a small amount of a slower component coexists in DH2O, DLi and DNa, and strictly speaking, they are not homogeneous systems; this requires further study. | ||
| Fig. 1 Concentration-dependent diffusion constants for 7Li (DLi), 23Na (DNa), and 1H (solvent H2O, DH2O–Li and DH2O–Na) at 303 K in aqueous solutions. | ||
The DLi values were smaller than the DNa values over the whole concentration range. A larger concentration dependence was observed for DLi than for DNa. Solvent H2O diffusion constants decreased slightly with an increase in concentration and the concentration dependence of DH2O–Li was larger than that of DH2O–Na, correlating with the relations of the DLi and DNa. The ratios of DH2O–Li/DLi and DH2O–Na/DNa were plotted against the salt concentration in Fig. S4 in the ESI† and they were almost constant for the concentration and DH2O–Li/DLi > DH2O–Na/DNa. The temperature-dependent diffusion constants of pure H2O have been reported15 and the value of 2.6 × 10⁻⁹ m2 s−1 at 303 K is consistent with the present value for H2O without including salt.
We have reported the salt concentration dependences of the diffusion constants of Li+ ions for LiBF4 and LiN(SO2CF3)2 in two organic solvents, propylene carbonate (PC) and γ-butyrolactone (GBL). Near the infinitesimal concentration region, clear concentration dependences of the diffusion constants of Li ions and anions were observed.16 In the aqueous solutions, the concentration dependence of DLi is small compared with those in organic solvents.
In liquid crystal systems, the SE equation (eqn (1)) holds well between experimental D and η as indicated.11,12 In many cases, the constant c has been treated as 6, but it varies widely for each species in ionic liquids. In this study, we tried to find the c value for H2O. In the ESI,† using published data of the temperature-dependent DH2O and η of H2O, the plot of the SE relation (D versus 1/πη) is linear with the gradient 1/crs. The experimental value of crs is 673 pm. When the ionic radius Rion of H3O+ (141 pm) is assumed to be rs, the c value is 4.8 for H2O. Following the classical relation, c value is either 4 nor 6, then the rs values are 168 or 112 pm for 4 or 6, respectively. The estimate of c = 4.8 of H2O is tentative, but we will use this value in our discussion. The viscosity of the solution at each salt concentration was estimated by eqn (2).
 | (2) |
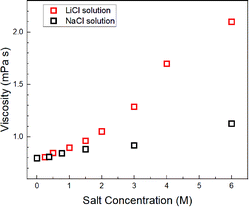
Assuming c = 4.8 and rH3O = 141 pm, the concentration-dependent viscosity was estimated from the DH2O for the aqueous LiCl and NaCl solutions (Fig. 2).
The increase in viscosity with the concentration increase in aqueous LiCl solutions was larger than that in the aqueous NaCl solutions, which were calculated by DH2O–Na and DH2O–Li (Fig. 1).
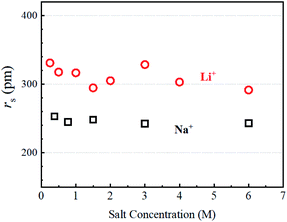
The dynamic Stokes radius for the alkali metal ions (Li and Na) is estimated at each concentration of aqueous solution with c = 4.8:
 | (3) |
The estimated values are plotted versus the salt concentration for the LiCl and NaCl solutions in Fig. 3.
It is not surprising that Fig. 3 is similar to Fig. S4,† but Fig. 3 has a clearer meaning of the Y-axis. The estimated rs(Li+) values scattered slightly without an explicit trend versus the salt concentration. The rs(Na+) values were almost independent of salt concentration. In this stage, the ion association effects must be considered. It is known that ion association increases with increase in the salt concentration measured in the ionic conductivity. We reported the ion association effects in organic Li+ solutions, where the solvation around Li+ is insensitive to the ion association.17 Because of the strong solvation ability of the organic solvent with high dielectric constant such as PC and GBL, the solvated Li+ ions associate with anions for ion pairing. Organic anions are weakly solvated in organic solution electrolytes. The ion association in organic solvents takes place between solvated Li+ and solvated anions.16 In aqueous solutions, the ion association effects on the hydration can be assumed to be negligible in diluted regions. The rs(Li) and rs(Na) values suggest that the dynamic diffusion constants include the H2O solvation effects. The hydration around Li+ is larger than that around Na+ and the hydration effect is insensitive to salt concentration at 303 K.
It is noted that in aqueous solutions, 7Li T1 values varied from 25 to 8 s with the increase in salt concentration and they were very longer than the 7Li T1 values in organic solvents (under 3 s) and in ionic liquids (∼0.3 s).11,12 The relaxation mechanism of 7Li T1 is mainly quadrupole interaction, and in the extreme narrowing condition, 1/T1(7Li) is proportional to quadrupole coupling constant (e2qQ/h)2, where q is the electric field gradient around 7Li nuclei and deeply related to the shape of circumstance of 7Li nuclei. The better cubic shape around the Li+ ion reduces q, and T1(7Li) value becomes longer because of the smaller quadrupole effect. The longer 7Li T1 values in the diluted aqueous solutions suggest a good cubic symmetry of 7Li. The 23Na T1 values were shorter owing to the larger nuclear quadrupole moment (Table 1) and varied from 64 to 46 ms with the increase in salt concentration. 1H T1 (H2O) varied from 3.6 to 2.1 s (Li solution) and from 3.6 to 3.1 s (Na solution.) with the increase in salt concentration. The larger degree of the decrease in 7Li T1 and H2O T1 suggests stronger interactions in Li–H2O compared with that in Na–H2O in aqueous solutions. The decrease of 7Li T1 with the increase of the salt concentration suggests decreasing the cubic symmetry of the solvation structure around Li+ and Na+.
Diffusion constants of alkali metal ions and solvent H2O
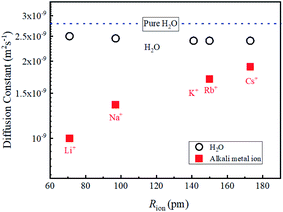
In diluted regions, the values of DLi, DNa and DH2O are shown to be insensitive to the salt concentration and the data about 1 M are used to compare the data of other alkali metal ions of Rb+ and Cs+. The salts used in this study were Rb2CO3 and Cs2CO3. The concentration of aqueous solutions was about 1 M. It was confirmed that with dilution, the DRb DCs and DH2O values did not vary within experimental error. Attempts to obtain the 39K diffusion constants were made using a JEOL ECZ-400 spectrometer under small PFG strength (0.3 Tm−1). Unfortunately, a reliable value of the DK was not observed. The data of 39K T1 and T2 obtained under the field strength of 9.404 T (1H frequency 400.39 MHz) are relatively short (Table 1).The diffusion constants of alkali metal ions and solvent H2O about 1 M including a diluted KCl solution at 303 K are plotted versus the reported ionic radius (Rion)2 in Fig. 4.
The DLi is the slowest and increases for Na+, Rb+, and Cs+ (Fig. 4), and the ionic radius of Li (Rion(Li)) is smallest of the alkali metal ions. Faster D is observed for alkaline metal ion with larger Rion. This trend is opposite to that of D which is proportional to 1/Rion
The diffusion constants of solvent H2O are slightly slower than the D value of pure H2O. This suggests that the viscosity of the alkali ion aqueous solutions changes little in diluted regions. To obtain the Stokes radius (rs) (i.e., dynamic ionic radius), the viscosity of each solution was calculated (eqn (2)) and then the rs was evaluated (eqn (3)). Here we assume that the constant c = 4.8 is the same as that of pure H2O. To estimate dynamic ionic radius the measurements of Dmetal and DH2O of the same sample were performed. The viscosity of the solution was estimated from the solvent DH2O as  following to the SE relation (experimental value of crs of pure H2O is 673 pm). Then the dynamic ionic radius rs of an alkali metal was evaluated from the D of an alkali metal as
  , where c is assumed 4.8.
The diffusion constants of Li+, Na+, Cs+ were reported in D2O at 298 K for 1 M concentration to be 0.92, 1.2, and 1.8 × 10⁻⁹ m2 s−1, respectively.13 Our values are consistent to the reported data, and the trend that the increase of the D values as the increase of the alkali metal size is quite consistent with each other.
The rs values were obtained experimentally on timescale of 10−6 s which is much longer than the commonly used timescale for spectroscopy and MO calculations. This means that PFG-NMR experiments can provide important information for electrochemistry in the similar timescale of ionic conductivity and viscosity.
The calculated rs values are plotted versus Rion in Fig. 5 and the numerical values are given in Table 2.
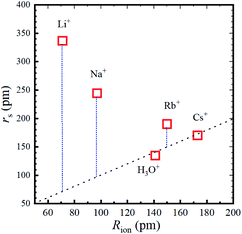 | ||
Fig. 5 Stokes radius (i.e., dynamic ionic radius) of the alkali metal ions versus the ionic radius (Rion) at 303 K. The dotted line is a guide for the 1![[thin space (1/6-em)]](https://www.rsc.org/images/entities/char_2009.gif) : :![[thin space (1/6-em)]](https://www.rsc.org/images/entities/char_2009.gif) 1 relation. 1 relation. | ||
| Nucleus | Experimental | Estimated | Rion (pm) | |||
|---|---|---|---|---|---|---|
| Dalkali 10−9 m2 s−1 | DH2O 10−9 m2 s−1 | η (mPa s) | rs (pm) | Radial hydrationb | ||
| a https://wiki.anton-paar.com/jp-jp/water/, accessed January15, 2021.b Radial hydration number = (rs − Rion)/RH2O. | ||||||
| Li+ | 1.0 | 2.5 | 0.829 | 337 | 1.9 | 71 |
| Na+ | 1.35 | 2.45 | 0.846 | 244 | 1.0 | 97 |
| K+ | 2.4 | 0.864 | — | — | 141 | |
| Rb+ | 1.7 | 2.4 | 0.864 | 190 | 0.28 | 150 |
| Cs+ | 1.9 | 2.4 | 0.864 | 170 | 0 | 173 |
| Pure H2O | 2.6 | 0.7972a | 141 | |||
For a better understanding the relations between the dynamic and static ionic radii, Fig. 6 illustrates the relations between rs and Rion.
 | ||
| Fig. 6 Relations between the dynamic ionic radius (rs) and static ionic radius (Rion) for the alkali metal ions in aqueous solutions. | ||
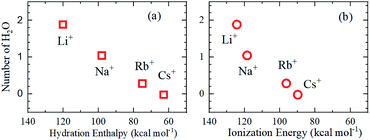
As is well known, the larger the atomic number of alkali metal, the larger the Rion. Experimental results on the dynamic ionic radius show an opposite trend; a reduction in the Stokes radius rs with increasing alkali atomic number. The dynamic radius of Li ion was the largest compared with the static ionic radius. To interpret this tendency, it is assumed that the dynamic ionic radius is induced by hydration and the hydrated alkali ions diffuse accompanied by H2O molecules. A simple calculation was performed to estimate the number of H2O molecules in the radial direction (the hydration number) as (rs − Rion)/RH2O for each alkali metal ion (Table 2). The hydration number of Li+ is about 2 in the radial direction, and larger alkali metal ions are less hydrated. Then the hydration number is plotted versus hydration enthalpy and ionization energy reported18 in Fig. 7(a) and (b), respectively.
The hydration numbers of the alkali metal ions determined by the PFG NMR method correlate well with the hydration enthalpy. The relationship between hydration enthalpy and ionization energy for numerous ions have been discussed widely,18 and in this paper, the plot of the hydration number versus ionization energy for the alkali metal ions suggests that the hydration of Li+ is very large.
Conclusions
The diffusion constants of the NMR-active nuclei of alkali metal ions have been determined by the PFG NMR method on a timescale of 10−3 s in a space of 10−6 m. The initial position of the NMR-active nucleus is marked by the first PFG and after time interval Δ (10−3 s order), the migrated position is detected by the second PFG. The dynamic ion radius (i.e., the Stokes radius) of each alkali metal ion was determined. The hydrated sphere diffuses together with the alkali metal ion. The hydration sphere is largest for Li+, followed by Na+, Rb+, and Cs+, and Cs+ has almost no hydration sphere. During the diffusion period, the PFG NMR method does not provide any information on the H2O exchange between the hydration sphere and the bulk.In this study, the theoretically derived SE relation was experimentally proved for the first time in the case of alkali metal ions in aqueous solution. The experimental value of the constant, c = 4.8 for pure H2O is reasonable in the aqueous solutions.
Conflicts of interest
There are no conflicts to declare.References
- H. Ohtaki and T. Radnai, Chem. Rev., 1993, 93, 1157–1204, DOI:10.1021/cr00019a014.
- Y. Marcus, Chem. Rev., 1988, 88, 1475–1498, DOI:10.1021/cr00090a003.
- R. Mancinelli, A. Botti, F. Bruni, M. A. Ricci and A. K. Soper, J. Phys. Chem. B, 2007, 111, 13570–13577, DOI:10.1021/jp075913v.
- M. Nagasaka, H. Yuzawa and N. Kosugi, J. Phys. Chem. B, 2017, 121, 10957–10964, DOI:10.1021/acs.jpcb.7b09789.
- J. Mähler and I. Persson, Inorg. Chem., 2012, 51, 425–438, DOI:10.1021/ic2018693.
- S. Roy and V. S. Bryantsev, J. Phys. Chem. B, 2018, 122, 12067–12076, DOI:10.1021/acs.jpcb.8b08414.
- I. M. Zeron, J. L. F. Abascal and C. Vega, J. Chem. Phys., 2019, 151, 134504, DOI:10.1063/1.5121392.
- X. Wang, D. Toroz, S. Kim, S. L. Clegg, G.-S. Park and D. D. Tommaso, Phys. Chem. Chem. Phys., 2020, 22, 16301–16313, 10.1039/d0cp01957g.
- H. J. V. Tyrell and K. R. Harris, Diffusion in Liquids: A Theoretical and Experimental Study, Butterworth-Heinemann, London, 1984 Search PubMed.
- K. Hayamizu, Electrochim. Acta, 2017, 254, 101–111, DOI:10.1016/j.electacta.2017.09.051 , and citations therein.
- K. Hayamizu, S. Tsuzuki, S. Seki, K. Fujii, M. Suenaga and Y. Umebayashi, J. Chem. Phys., 2010, 133, 194505, DOI:10.1063/1.3505307.
- K. Hayamizu, S. Tsuzuki, S. Seki and Y. Umebayashi, J. Chem. Phys., 2011, 135, 084505, DOI:10.1063/1.3625923.
- B. M. Braun and H. Weingärtner, J. Phys. Chem., 1988, 92, 1342–1346, DOI:10.1021/j100316a065.
- V. I. Volkov, A. V. Chernyak, D. V. Golubenko, V. A. Tverskoy, G. A. Lochin, E. S. Odjigaeva and A. B. Yaroslavtsev, Membranes, 2020, 10, 272, DOI:10.3390/membranes10100272.
- M. Holz, S. R. Heil and A. Sacco, Phys. Chem. Chem. Phys., 2000, 2, 4740–4742, 10.1039/b005319h.
- Y. Aihara, K. Sugimoto, W. S. Price and K. Hayamizu, J. Chem. Phys., 2000, 113, 1981–1991, DOI:10.1063/1.482004.
- K. Hayamizu, Y. Aihara, S. Arai and C. Garcia-Martinez, J. Phys. Chem. B, 1999, 103, 519–524, DOI:10.1021/jp9825664.
- J. E. House Jr, L. A. Reif Jr and J. D. House, Thermochim. Acta, 1983, 66, 365–368, DOI:10.1016/0040-6031(93)85050-J.
Footnote |
| † Electronic supplementary information (ESI) available: The Hahn and stimulated echo pulse sequences for the PFG NMR. Measuring conditions of the Hahn-PFG 1H, 7Li, 23Na, 133Ce and those of STE-PFG for 87Rb with short relaxation times. The Stokes–Einstein plot (D versus kT/πη) of pure H2O, and the rations of DLi and DNa with each solvent DH2O. See DOI: 10.1039/d1ra02301b |
| This journal is © The Royal Society of Chemistry 2021 |

