 Open Access Article
Optimization of closed-cycle oil recovery: a non-thermal process for bitumen and extra heavy oil recovery†
Pushpesh Sharmaa,
Konstantinos Kostarelos *a and
Mohamad Salmanab
aUniversity of Houston, Houston, TX, USA. E-mail: KKostarelos@uh.edu
bChevron Technology Center, Houston, TX, USA
First published on 2nd August 2021
Abstract
Energy from unconventional resources includes bitumen and extra-heavy oil that represent two-thirds of the known resources in the world. Extra-heavy oil and bitumen are currently recovered using thermal processes having a large carbon footprint and significant environmental impacts on water resources. A novel process is proposed: closed-cycle oil recovery (C-COR). C-COR is a greener alternative to provide energy from these unconventional resources with minimal water consumption. C-COR relies on recovering oil solubilized within a single-phase microemulsion, eliminating the need for viscosity reduction to both mobilize heavy oil or to transport it. Proof-of-concept work was conducted using conventional phase behavior experiments with extracted oil and surfactant formulations to develop a surfactant formulation for oil recovery using C-COR. As a part of process development and scale-up, we conducted flow experiments presented in this paper. We learned that a high degree of surfactant adsorption, which negatively impacted the C-COR process, resulted at low pH levels. These findings required modifying traditional static batch tests (phase behavior studies) using actual oil sand instead of the extracted oil. These unorthodox tests revealed that surfactant adsorption caused low oil solubilization and that alkali can be used to reduce adsorption, improving oil solubilization. In addition, unique flow experiments were designed to optimize the delivery and recovery process and are presented in this paper. The unique batch tests and flow experiments were conducted using oil sands from Canada to optimize the process. The proposed optimized approach would employ intermittent flow (soaking) that would result in the fastest recovery of about one-third of the OOIP, followed by continuous injection to recover an additional 10% OOIP, ending with thermal enhancement to recover another 25% OOIP for a total of 61%.
Introduction
Energy from unconventional resources includes bitumen and extra-heavy oil that represent two-thirds of the known resources in the world.1 The majority of these deposits are found in Canada and Venezuela. The western Canada sedimentary basin is estimated to contain 1.73 trillion bbls of bitumen.2 and the Orinoco oil belt in Eastern Venezuela is the largest deposit of extra-heavy oil in the world, with 1.9 trillion bbls of original oil in place.3The currently-used recovery methods for bitumen and extra heavy oil are open-pit mining, and thermal methods such as steam-assisted gravity drainage (SAGD) and cyclic steam stimulation (CSS). A fourth method called cold heavy oil production with sand (CHOPS) is a non-thermal recovery method for heavy oil that is suitable only for unconsolidated sands and heavy oil deposits containing solution gas.3 Open pit mining and the above-ground oil extraction process are criticized for having a large carbon footprint. In addition, the excavation process destroys vegetation while the tailing ponds have the potential to contaminate the soil, both having a concomitant negative effect on the ecosystem.4 In 2009, National Geographic sparked an uproar among environmentalists when they published an article featuring a series of photographs showing the environmental impacts of open-pit mining (Fig. 1).33
 | ||
| Fig. 1 Photographs showing the effects of open-pit mining of oil sands in Canada. Photo credit: Peter Essick.33 | ||
Thermal methods such as SAGD and CSS are highly energy and carbon intensive. In addition, they require fresh water for steam generation and the produced water must be treated before re-injection.5,6 Other methods that have been investigated include VAPEX, thermal-chemical flooding (TCF) and in situ oil upgrading, and several derivatives that incorporate additives (e.g., nanoparticles, ionic liquids, catalysts): all are thermal processes that, while they may be more energy efficient than SAGD, require injection of hydrocarbon solvents such as propane or butane and are criticized in terms of sustainability/environmental acceptability.7–10 In summary, these methods are either energy-intensive and/or have significant environmental impacts. Excepting open-pit mining, the methods that are currently used or are under development rely on mobilizing viscous oil or bitumen. A high-level comparison of these technologies is presented in Table 1.
| Bitumen recovery technology | Thermal (T)/non-thermal (NT) | TRL | Cost/bbl | Environmental impact |
|---|---|---|---|---|
| a SAGD = steam assisted gravity drainage.b CHOPS = cold heavy oil production with sand.c CSS = cyclic steam stimulation.d Vapor extraction.e Thermal-chemical flooding.f C-COR = closed-cycle oil recovery.g Notes: the table is based on information reported in the literature for each process. Cost per bbl of oil recovered is estimated based on technical recovery efficiency where the TRL of the technology is low and cost data is not yet available. | ||||
| Open-pit mining | T | 9 | Low | High |
| SAGDa | T | 9 | Intermediate | High |
| CHOPSb | NT | 9 | Low | Low |
| CSSc | T | 9 | Intermediate | High |
| VAPEXd | T | 6–7 | High | High |
| TCFe | T | 6–7 | High | High |
| In situ oil upgrading | T | 6–7 | Intermediate | High |
| C-CORf | NT | 3 | Intermediate | Low |
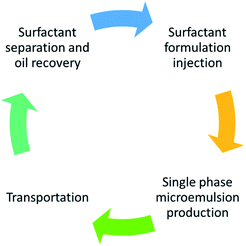
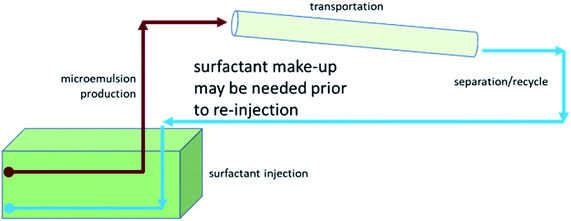
Alkali–cosolvent–polymer (ACP) flooding, a modification of alkali–surfactant–polymer (ASP) flooding, and speciality chemical flooding, have recently been proposed for heavy oil recovery.34–36 The non-thermal recovery methods that are at low technology readiness level (TRL) are derivatives of chemical enhanced oil recovery (cEOR) methods developed for conventional oil reservoirs. These non-thermal approaches have a minimal environmental impact and better energy efficiency but are also focused on mobilizing oil, which has proven difficult due to the high viscosity of bitumen and extra-heavy oil.11–26 The potential to unlock these vast energy resources lies in overcoming this challenge while recognizing the importance of the energy-water nexus. Closed-Cycle Oil Recovery (C-COR) is under development as a sustainable, non-thermal method of bitumen/extra heavy oil recovery that relies on solubilizing oil within a single phase microemulsion. The conceptual flow of the C-COR method is depicted in Fig. 2. A schematic of the scale-up for field implementation is rendered in Fig. 3. This novel approach is designed to solubilize the oil only-not mobilize it. Only single phase microemulsion is produced, which has a lower viscosity being an oil-in-water microemulsion. The produced microemulsion can be trans-ported more easily. After transportation, microemulsion can be separated to recover oil while the surfactant can be re-cycled for re-injection. This is an additional benefit since existing methods require the addition of solvent (diluent) to transport the oil, which adds to the carbon footprint for solvent separation. In brief, the proposed C-COR concept is a low energy approach with potentially lower environmental impacts than the methods proposed to date. Surfactants have been employed in environmental restoration for nearly 2 decades.38,40
A proof-of-concept study for C-COR was published by the authors27,28 utilizing coal tar as a model oil, which highlighted the potential of the method achieving 78% oil recovery. In addition, phase behavior and preliminary flow experiments conducted with actual oil sands were conducted by the authors29 to show the potential of the C-COR approach. In that work, the details were presented regarding the formulation selected as the basis for the present work. This paper presents in-depth studies aimed at optimizing the C-COR method resulting in a significant improvement in recovery and includes unique batch tests and flow experiments.
Results and discussion
Static tests
Two different static tests were performed adsorption and solubilization. Both tests were uniquely designed to optimize the surfactant formulation for use in dynamic flow tests. Actual Athabasca sand was acquired from Alberta, Canada and the bitumen content of the oil sand was quantified to be 12.8 wt% on average using a Soxhlet extraction procedure with toluene as a solvent (see ESI† for more detail).Adsorption tests were initially conducted to measure the effect of alkali on surfactant adsorption onto the solids. The surfactant formulation consisted of 0.25 wt% C20-24 IOS, and 0.25 wt% C13 13 PO alkoxy sulfate, with 0.25 wt% 2-butanol for the adsorption static tests.29 The formulation was mixed with 5 grams of clean Athabasca sand (no oil) in centrifugal tubes with a range of alkali (Na2CO3) concentrations, while keeping total liquid volume 10 ml. The tubes were tumbled for 3 days and the surfactant concentration in the supernatant was measured by HPLC afterwards (described in the ESI section†). Static adsorption tests revealed that alkali concentration was essential to reduce sand adsorption and improve the performance of the surfactant formulation. The results are shown in Fig. 4 and in agreement with the literature.37 Static tests were repeated with higher concentrations of sodium carbonate, but the surfactant formulation was not stable above 4 wt% of sodium carbonate possibly due to an effect known as “salting out”.
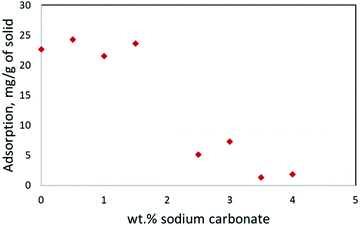 | ||
| Fig. 4 Surfactant adsorption onto solids with respect to sodium carbonate concentration; note the inflection point at 2 wt% sodium carbonate. | ||
Solubilization tests were also unique in that they were designed to study the effect of sand particles on the solubilization of bitumen into the microemulsion. The formulation used for the adsorption tests was the basis for these tests: the formulation was varied with respect to the blend ratio of the two surfactants (IOS and sulfate), and two additional co-solvents, isopropyl alcohol (IPA) and tri-ethylene glycol monobutyl ether (TEGMBE) were also studied. Sodium carbonate concentration was maintained at 4 wt%. Glass test tubes were filled with 10 g of oil sand and 10 ml of the desired surfactant formulation. Tubes were sealed, mixed gently, and allowed to equilibrate for 24 hours. The supernatant was collected, analyzed by gas chromatography/mass spectroscopy (GC/MS; see Table SI4†), and demonstrated that as the amount of total surfactant increased, bitumen solubilization increased. The solubilization parameter for oil (volume of oil solubilized/volume of surfactant) was highest with 1 wt% C20-24 IOS and 1 wt% C13 13 PO alkoxy sulfate, 1 wt% TEGMBE, and 4 wt% Na2CO3.
Bitumen solubilization was 60![[thin space (1/6-em)]](https://www.rsc.org/images/entities/char_2009.gif) 000 mg L−1 and solubilization parameter was 3. Note that the highest solubilization possible would have been on the order of 128
000 mg L−1 and solubilization parameter was 3. Note that the highest solubilization possible would have been on the order of 128![[thin space (1/6-em)]](https://www.rsc.org/images/entities/char_2009.gif) 000 mg L−1 had all the oil within the 10 g of oil sand (12.8 wt% bitumen) been solubilized into 10 ml of surfactant solution. This surfactant formulation was selected for all subsequent flow experiments.
000 mg L−1 had all the oil within the 10 g of oil sand (12.8 wt% bitumen) been solubilized into 10 ml of surfactant solution. This surfactant formulation was selected for all subsequent flow experiments.
Dynamic tests
Flow experiments were uniquely designed to produce comparative data from five packed columns to optimize the C-COR process. Actual oil sand was used, which is an unconsolidated media and precludes the use of traditional approaches developed for core flooding. As an example, immovable oil (bitumen) occupies a portion of the pore volume at the onset of the experiment so that the porosity cannot be measured. Instead, the bulk water fraction (Wf) denoting the available pore volume for flow was measured in a similar manner as porosity for consolidated cores. Bulk water fraction is analogous to water saturation in the case of consolidated cores and monitoring the Wf provides a means of quantifying the oil recovery. It is also important to consider that, since the porosity is not known at the start of the flow experiments, bitumen content is not reported in terms of saturation but in terms of mass content. Thus, oil recovery is assessed both gravimetrically and by using Wf (see ESI† for more detail).A summary of the five test conditions is provided in Table 1; more details of the test setup are provided in the ESI.† The properties of each sand pack measured prior to each dynamic test are similar and listed in Table SI6.† A flow rate of 0.013 ml min−1 (0.274 m per day), vertically upwards, was for all tests except in Test 4 where the rate was doubled. The pressure drop recorded during each experiment was below 0.28 kPa g (0.18 m-water per m), except for DT 5 that employed a viscosifier where the pressure drop was about 2.76 kPa g (1.8 m-water per m) on average (see ESI† for more detail). Produced microemulsion was analyzed by GC/MS, and the injection was stopped when bitumen concentration in microemulsion fell below 10![[thin space (1/6-em)]](https://www.rsc.org/images/entities/char_2009.gif) 000 ppm. The selection of this concentration as a stopping criterion was arbitrary; clearly, the field process will reach a point where the produced mass of oil is too low to be continued for economic consideration and the process terminated. In practice, however, that point will depend on economic factors that are not known at this early stage in technology development so a reasonable value was chosen in order to optimize the process.
000 ppm. The selection of this concentration as a stopping criterion was arbitrary; clearly, the field process will reach a point where the produced mass of oil is too low to be continued for economic consideration and the process terminated. In practice, however, that point will depend on economic factors that are not known at this early stage in technology development so a reasonable value was chosen in order to optimize the process.
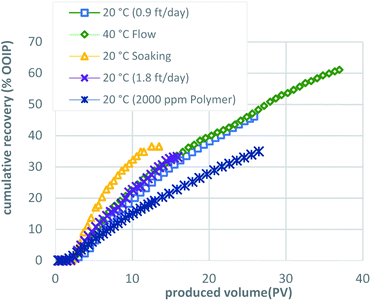
The results of dynamic tests 1 to 5 are summarized in Table 1. The surfactant formulation exhibited better oil recovery with the addition of sodium carbonate for adsorption reduction compared with tests presented in Sharma et al.:29 maximum bitumen concentrations were 3–4 times higher, while oil recovery was between 8–13 times greater. The recovery of original oil in place (OOIP) was calculated using the increase in bulk water fraction and gravimetrically. An interesting observation is made: dynamic test 2 conducted at a slightly elevated temperature of 60 °C exhibited the highest recovery, 61% OOIP, but the recovery per PV was not the best. This is an important distinction when factoring costs to decide which of the C-COR process optimizations should be employed. The remaining dynamic tests 3, 4, and 5 achieved roughly the same recovery—on the order of 35% OOIP—with the highest recovery per PV achieved by employing a soaking method. An interesting and unexpected result is noted in terms of recovery per PV of dynamic test 4: a higher flow rate performed well with respect to recovery per PV injected. The various methodologies employed in the dynamic tests indicate that, although the process is affected by dynamic parameters, the main controlling factor is accessibility to bitumen: i.e., macroscopic sweep efficiency of the injected formulation and the solubilized oil. The recovery was constrained by the adverse mobility of the surfactant formulation after solubilizing bitumen (microemulsion). It is helpful, then, to examine each test in more detail to glean useful for scale-up and optimization insight.
![[thin space (1/6-em)]](https://www.rsc.org/images/entities/char_2009.gif) 000 mg L−1 is shown in Fig. 5. The pressure drop recorded during injection was very low, about 0.28 kPa g on average (0.18 m-water per m).
000 mg L−1 is shown in Fig. 5. The pressure drop recorded during injection was very low, about 0.28 kPa g on average (0.18 m-water per m).
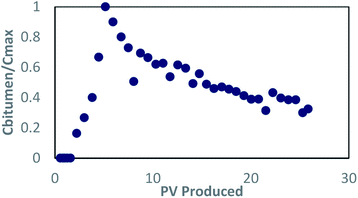 | ||
Fig. 5 Concentration profile for bitumen in dynamic test 1; concentrations are normalized by the highest concentration, approximately 30![[thin space (1/6-em)]](https://www.rsc.org/images/entities/char_2009.gif) 000 mg L−1. 000 mg L−1. | ||
The oil recovery was 43.14% OOIP (gravimetric method) before stopping, which was a 10-fold improvement over the flow tests reported by Sharma et al.29 that did not address adsorption in the surfactant formulation. The bulk water fraction of the sand pack after the test increased to 22.8%, which was used to estimate an oil recovery of 40.33% OOIP. This value corroborates the value measured gravimetrically. After emptying the sand from the column, it was observed that the sand was lighter in color compared to the original oil sand. The sand near the outlet showed signs that oil recovery occurred more at the periphery of the sandpack, which may indicate possible by-passing (“channelling”) of the injected solution along the sides of the column as the solution moves upwards.
![[thin space (1/6-em)]](https://www.rsc.org/images/entities/char_2009.gif) 700 mg L−1, marginally higher than dynamic test 1. Fig. 6 depicts the concentration profile during the test, showing that the bitumen concentration remained above the stopping criteria longer, leading to higher oil recovery. From a technical perspective, the increased solubilization resulting from thermal enhancement improved performance in terms of oil recovery. Bitumen recovery was 61.07% OOIP (gravimetric method); an increase compared with the base case (dynamic test 1) (Table 2).
700 mg L−1, marginally higher than dynamic test 1. Fig. 6 depicts the concentration profile during the test, showing that the bitumen concentration remained above the stopping criteria longer, leading to higher oil recovery. From a technical perspective, the increased solubilization resulting from thermal enhancement improved performance in terms of oil recovery. Bitumen recovery was 61.07% OOIP (gravimetric method); an increase compared with the base case (dynamic test 1) (Table 2).
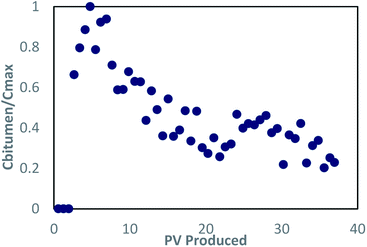 | ||
Fig. 6 Concentration profile for bitumen in dynamic test 2, concentrations are normalized by the approximate highest concentration (37![[thin space (1/6-em)]](https://www.rsc.org/images/entities/char_2009.gif) 700 mg L−1). 700 mg L−1). | ||
| Test number | Description | Flow rate (m per day) | PV injected | % OOIP recovery | Recovery per PV | |
|---|---|---|---|---|---|---|
| Using bulk water fraction | Using gravimetric | |||||
| 1 | Baseline | 0.274 | 26 | 40.33 | 43.14 | 1.77 |
| 2 | Elevated temp | 0.274 | 37 | 58.12 | 61.07 | 1.65 |
| 3 | Soaking | 0.274 | 13 | 30.63 | 36.5 | 2.81 |
| 4 | High rate | 0.549 | 15 | 30.68 | 36.11 | 2.41 |
| 5 | Polymer | 0.274 | 26.5 | 26.33 | 34.9 | 1.32 |
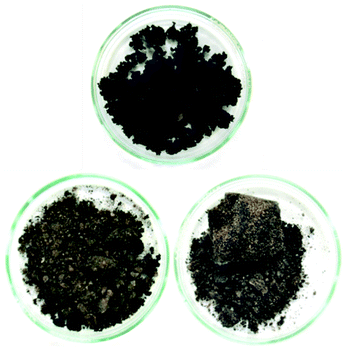
The bulk water fraction of the sand pack increased to 27.5% which translates to an oil recovery of approximately 58.12% OOIP recovery. Sand was photographed after removal from the sand pack and, while the sands from the inlet and outlet appeared lighter in color compared to the original oil sand shown in Fig. 7, evidence of flow channelling at the outlet was also observed upon closer examination.
![[thin space (1/6-em)]](https://www.rsc.org/images/entities/char_2009.gif) 500 mg L−1, which is slightly higher than the base case and comparable to the test run at an elevated temperature. Oil recovery was 36.5% OOIP (gravimetric method) and 30.63% OOIP (Wf method). Close examination of sand after the test also led to the same observation that recovery at the inlet is better than the outlet. Although the total recovery in this test was lower than the base case, since the stopping criteria for the test (i.e., the bitumen concentration fell below 10
500 mg L−1, which is slightly higher than the base case and comparable to the test run at an elevated temperature. Oil recovery was 36.5% OOIP (gravimetric method) and 30.63% OOIP (Wf method). Close examination of sand after the test also led to the same observation that recovery at the inlet is better than the outlet. Although the total recovery in this test was lower than the base case, since the stopping criteria for the test (i.e., the bitumen concentration fell below 10![[thin space (1/6-em)]](https://www.rsc.org/images/entities/char_2009.gif) 000 mg L−1) was achieved sooner, the bitumen recovery per PV of the surfactant formulation injection was higher. This indicates that the soaking process achieved more solubilization within the first few soaks.
000 mg L−1) was achieved sooner, the bitumen recovery per PV of the surfactant formulation injection was higher. This indicates that the soaking process achieved more solubilization within the first few soaks.![[thin space (1/6-em)]](https://www.rsc.org/images/entities/char_2009.gif) 000 mg L−1-slightly higher than the base case and comparable to both elevated temperature and soaking cases. The recovery calculated gravimetrically was 36.11% and 30.68% using the bulk water fraction difference method. Thus, the higher flow rate resulted in similar oil recovery to the soaking method.
000 mg L−1-slightly higher than the base case and comparable to both elevated temperature and soaking cases. The recovery calculated gravimetrically was 36.11% and 30.68% using the bulk water fraction difference method. Thus, the higher flow rate resulted in similar oil recovery to the soaking method.Visual analysis of the sand revealed patterns similar to the previous tests, where more oil recovery at the inlet than the outlet was observed. Based on test 3 and 4, it was evident that, while dynamic processes are affecting bitumen recovery, the rate and degree of solubilization was not the only controlling factor. The amount of bitumen contacted by the surfactant appears to play a significant role in oil recovery. This observation should not be understated: most studies including ours begin with static testing where dynamic studies show the importance of fluid delivery and achieving good conformance—a measure of the uniformity of the flood front of the injected drive fluid.
Note that the presence of polymer in microemulsion interfered with GC measurements of oil concentration so it was not possible to use the stopping criteria (10![[thin space (1/6-em)]](https://www.rsc.org/images/entities/char_2009.gif) 000 mg L−1) with certainty. For this reason, the test was stopped after 26.5 PV injection, which is the same throughput for the base case, even though the GC measurement was indicating a concentration value of, above the stopping criteria (approximately 20
000 mg L−1) with certainty. For this reason, the test was stopped after 26.5 PV injection, which is the same throughput for the base case, even though the GC measurement was indicating a concentration value of, above the stopping criteria (approximately 20![[thin space (1/6-em)]](https://www.rsc.org/images/entities/char_2009.gif) 000 mg L−1). Oil recovery was lower than the base case, 34.9% OOIP (gravimetric) and 26.33% OOIP (bulk water fraction) using a similar throughput as in the base case. Although a viscosifier was added to improve the conformance of the injected surfactant solution and resulting microemulsion, the sand appeared to have poor overall oil recovery compared with previous tests. The evidence suggests that the addition of polymer to the surfactant formulation may have interfered with the solubilization process and did not improve over the base case. A subsequent static test conducted with the surfactant formulation plus polymer (as used in dynamic test 5) indicated that the amount of solubilized oil measured after 2 weeks of mixing was lower, corroborating the dynamic test 5 observation that the addition of polymer adversely affected the oil solubilization.
000 mg L−1). Oil recovery was lower than the base case, 34.9% OOIP (gravimetric) and 26.33% OOIP (bulk water fraction) using a similar throughput as in the base case. Although a viscosifier was added to improve the conformance of the injected surfactant solution and resulting microemulsion, the sand appeared to have poor overall oil recovery compared with previous tests. The evidence suggests that the addition of polymer to the surfactant formulation may have interfered with the solubilization process and did not improve over the base case. A subsequent static test conducted with the surfactant formulation plus polymer (as used in dynamic test 5) indicated that the amount of solubilized oil measured after 2 weeks of mixing was lower, corroborating the dynamic test 5 observation that the addition of polymer adversely affected the oil solubilization.
Summary and conclusions
The results of this work, combined with the prior “proof-of-concept” work published by Sharma et al.,27–29 are encouraging and justify an additional investigation. We need to better understand the effects of both the actual sand and the actual bitumen for scale-up using two- and three-dimensional physical and numerical simulation models. From the results described here, we conclude that low surfactant adsorption onto the media is critical for the effectiveness of the C-COR approach. Phase behavior and batch testing conducted without taking surfactant adsorption into account will lead to extremely low recovery in 1-D flow experiments and affect the economics negatively when applied at field scale. Polymer was observed to adversely affect oil solubilization for this formulation. From the dynamic test results, it is clear that a high degree of oil recovery is possible with proper surfactant selection, even when employing very high flow rates that would be considered an extreme test of the approach. The dynamic flow test were designed to optimize the process and the results indicated that, although the process is affected by dynamic parameters, oil recovery was constrained by the adverse mobility of the surfactant formulation after solubilizing bitumen (microemulsion) and is also affected by accessibility to bitumen.Fig. 8 compares the five methodologies in terms of oil recovery and indicates that a soaking approach yields highest oil recovery at an early stage, while the same formulation injected continuously (base case) or at an elevated temperature (40 °C) yielded the highest oil recoveries overall. This is also apparent in Fig. 9, where the oil recovery per produced volume are shown for the five methodologies. Thus, the proposed optimized approach shown in Fig. 10 would initially employ a soaking method that would result in the fastest recovery of about one-third of the OOIP, followed by a continuous injection to recovery an additional 10% OOIP, ending with thermal enhancement to recovery 25% OOIP more for a total of 61%. Fig. 11 presents the oil recovery per produced volume for the proposed, optimized approach. Both Fig. 10 and 11 are hypothetical and were developed by super-position of the data from the 3 separate tests: this assumes that the conditions within the oil sand pack are identical at the same stage of the experiments. This is a reasonable assumption when considering that the three experiments were conducted using the same initial conditions, employed the same formulation and flow rates, differing only in terms of the implementation: intermittent flow followed by continuous flow followed by elevated temperature. While it is possible that the distribution of bitumen within the sand pack could be slightly different even when the overall oil saturation is the same, the proposed optimized process is logical in terms of simple economic considerations: the initial scheme would use require less (intermittent) pumping to achieve a high recovery before switching to continuous pumping with an associated higher cost, culminating with higher costs to thermally enhance the process.
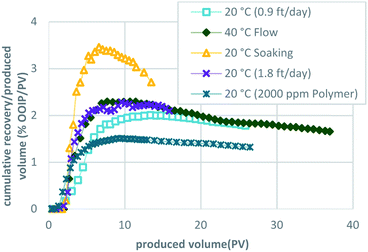 | ||
| Fig. 9 Comparison of the cumulative oil recovery per produced volume for the five methods used to implement CCCOR shows that the soaking method results in the highest. | ||
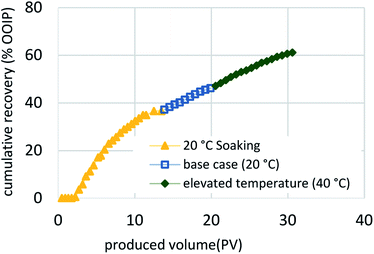 | ||
| Fig. 10 Cumulative recovery of the proposed, optimized approach begins with soaking followed by continuous flow and ending with thermal enhancement of injected fluids. | ||
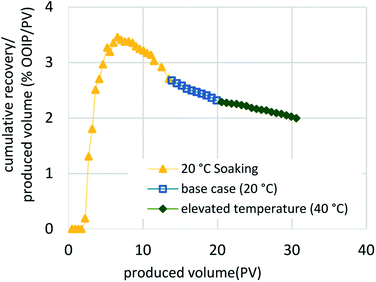 | ||
| Fig. 11 Cumulative recovery per volume produced of the proposed, optimized approach (soaking, continuous flow, and thermal enhancement). | ||
Additional work on improving the surfactant formulations is strongly suggested. As a part of surfactant selection, environmental acceptability/toxicity should be considered: since the injection of any fluid into the subsurface has a potential of flow from the targeted zone containing oil to an environmentally-sensitive zone (e.g., an aquifer). In general, surfactants have a lower toxicity level and are more environmentally acceptable over solvents proposed for other heavy oil recovery approaches.39 Optimizing the surfactant formulation may positively impact the process economically. A techno-economic and life cycle analysis for the process, comparing it with currently-employed methods such as SAGD and open-pit mining, would also be beneficial at this point. It will also help to identify whether the higher recovery of oil outweighs the additional cost of thermal enhancement. The proposed C-COR process will also require the development of a suitable separation technique before it can be seriously considered for scale-up for a field application. Surfactant recovery processes have not been well-studied at field scale. Further research to develop an efficient surfactant recovery process would not only help the C-COR approach but would also benefit the scale-up of other surfactant-based processes designed for the subsurface environment. Finally, optimization studies for the field development and well placement are also required as outlined by multiple authors to make it comparable to existing methods.30–32
Author contributions
Pushpesh Sharma: data curation; formal analysis; investigation; methodology; resources; visualization; writing – original draft. Konstantinos Kostarelos: conceptualization; funding acquisition; methodology; project administration; supervision; writing – review & editing. Mohamad Soliman: investigation; writing – review & editing.Conflicts of interest
There are no conflicts to declare.Acknowledgements
The authors would like to thank The Division of Research at The University of Houston for financial support of the work. The authors would also like to thank Sasol, Cytec, Kemira, and Shell for the surfactant and polymer samples provided for the study.References
- IEA, Resources to Reserves 2013 – Oil, Gas and Coal Technologies for the Energy Markets of the Future, OECD Publishing, Paris, 2013, DOI:10.1787/9789264090705-en.
- WEC, 2010 Survey of Energy Resources, World Energy Council, 2010, pp. 123–150, downloaded July 17 2020: https://www.worldenergy.org/publications/entry/world-energy-resources-2010-survey Search PubMed.
- M. R. Fassihi and A. R. Kovscek, Low-Energy Processes for Unconventional Oil Recovery, SPE Monograph Series, 2017, vol. 27, ISBN: 978-1-61399-475-7 Search PubMed.
- D. Banerjee, Oil Sands, Heavy Oil, & Bitumen: From Recovery to Refinery, PennWell Corporation, Tulsa, US, 2012, ISBN: 978-1-59370-260-1 Search PubMed.
- R. M. Butler, Steam-Assisted Gravity Drainage: Concept, Development, Performance and Future, J. Can. Pet. Technol., 1994, 33(2), 44–50 CrossRef CAS.
- J. G. Speight, Enhanced Recovery Methods for Heavy Oil and Tar Sands, Elsevier, 2009, ISBN: 9781933762258 Search PubMed.
- S. K. Das, Vapex: An Efficient Process for the Recovery of Heavy Oil and Bitumen, SPE J., 1998, 3(3), 232–237 CrossRef.
- W. Zhengbin, L. Huiqing and W. Xue, Adaptability Research of Thermal-Chemical Assisted Steam Injection in Heavy Oil Reservoirs, J. Energy Resour. Technol., 2018, 140(5), 032902 CrossRef.
- R. Hashemi, N. N. Nassar and P. P. Almao, Nanoparticle technology for heavy oil in situ upgrading and recovery enhancement: opportunities and challenges, Appl. Energy., 2014, 133, 374–387 CrossRef CAS.
- X. Dong, H. Liu, Z. Chen, K. Wu, N. Lu and Q. Zhang, Enhanced oil recovery techniques for heavy oil and oil sands reservoirs after steam injection, Appl. Energy, 2019, 239, 1190–1211 CrossRef CAS.
- H. Y. Jennings, C. E. Johnson and C. D. McAuliffe, A Caustic Waterflooding Process for Heavy Oils, JPT, J. Pet. Technol., 1974, 26(12), 1344–1352 CrossRef CAS.
- Q. Liu, M. Dong and S. Ma, Alkaline/Surfactant Flood Potential in Western Canadian Heavy Oil Reservoirs, SPE/DOE Symposium on Improved Oil Recovery, Society of Petroleum Engineers, 2006, DOI:10.2118/99791-MS.
- J. Bryan and A. Kantzas, Enhanced Heavy – Oil Recovery by Alkali-Surfactant Flooding, Society of Petroleum Engineers, SPE 110738, 2007, pp. 1–13, DOI:10.2118/110738-ms.
- J. Bryan and A. Kantzas, Potential for Alkali-Surfactant Flooding in Heavy Oil Reservoirs through Oil-in-Water Emulsification, J. Can. Pet. Technol., 2009, 48(2), 37–46 CrossRef CAS.
- H. Zhang, M. Dong and S. Zhao, Which One Is More Important in Chemical Flooding for Enhanced Court Heavy Oil Recovery, Lowering Interfacial Tension or Reducing Water Mobility?, Energy Fuels, 2010, 24(3), 1829–1836 CrossRef CAS.
- H. Pei, G. Zhang, J. Ge, L. Ding, M. Tang and Y. Zheng, A Comparative Study of Alkaline Flooding and Alkaline/Surfactant Flooding for Zhuangxi Heavy Oil, Proceedings of SPE Heavy Oil Conference, Canada, 2012, pp. 1–10 Search PubMed.
- M. Tang, G. Zhang, J. Ge, P. Jiang, Q. Liu, H. Pei and L. Chen, Investigation into the Mechanisms of Heavy Oil Recovery by Novel Alkaline Flooding, Colloids Surf., A, 2013, 421, 91–100 CrossRef CAS.
- R. Kumar, Enhanced Oil Recovery of Heavy Oils by Non-Thermal Chemical Methods, PhD dissertation, University of Texas, 2013.
- H. Pei, G. Zhang, J. Ge, L. Zhang and M. Ma, Effect of the Addition of Low Molecular Weight Alcohols on Heavy Oil Recovery during Alkaline Flooding, Ind. Eng. Chem. Res., 2014, 53(4), 1301–1307 CrossRef CAS.
- R. Kumar and K. K. Mohanty, ASP Flooding of Viscous Oils, Proceedings – SPE Annual Technical Conference and Exhibition, 2010, vol. 6, pp. 19–22 Search PubMed.
- S. S.-K. Sim, F. Rolf Wassmuth and J. Jiang Bai, Identification of Winsor Type III Micro-Emulsion for Chemical EOR of Heavy Oil, Proceedings of SPE Heavy Oil Conference, Canada, 2014, pp. 1–11 Search PubMed.
- R. Fortenberry, P. Suniga, S. Mothersele, M. Delshad, H. Lashgari and G. A. Pope, Selection of a Chemical EOR Strategy in a Heavy Oil Reservoir Using Laboratory Data and Reservoir Simulation, Proceedings of SPE Canada Heavy Oil Technical Conference, 2015, DOI:10.2118/174520-MS.
- G. C. Ezeh, Y. Duan, R. Rausa and D. K. Papadopoulos, Mobilization of Crude Oil in Porous Media With Oil-Soluble Surfactant Delivered by Hydrosoluble Micelles, J. Energy Resour. Technol., 2019, 141(3), 032902 CrossRef.
- R. Fortenberry, D. H. Kim, N. Nizamidin, S. Adkins, G. W. Palayangoda, P. Arachchilage, H. S. Koh, U. Weerasooriya and G. A. Pope, Use of Cosolvents To Improve Alkaline/Polymer Flooding, SPE J., 2015, 20(2), 255–266 CrossRef CAS.
- S. M. F. Ali, J. M. Figueroa, E. A. Azuaje and R. G. Farquharson, Recovery of Lloydminster and Morichal Crudes By Caustic, Acid and Emulsion Floods, J. Can. Pet. Technol., 1979, 18(1), 53–59, DOI:10.2118/79-01-02.
- R. D. Kaminsky, R. C. Wattenbarger, J. Lederhos and S. A. Leonardi, Viscous Oil Recovery Using Solids-Stabilized Emulsions, SPE Annual Technical Conference and Exhibition, Florence, Italy. SPE-135284-MS, 2010, pp. 19–22, DOI:10.2118/135284-ms.
- P. Sharma, K. Kostarelos and S. Palayangoda, Hydrocarbon Recovery From Oil Sands by Cyclic Surfactant Solubilization in Single-Phase Microemulsions, J. Energy Resour. Technol., 2019, 141(8), 085001 CrossRef CAS.
- P. Sharma and K. Kostarelos, Coal Tar Recovery from former Manufactured Gas Plant sites using Single Phase Microemulsion, Proceedings-Eleventh International Conference on Remediation of Chlorinated and Recalcitrant Compounds, Battelle, 2018 Search PubMed.
- P. Sharma, K. Kostarelos and X. Xiong, Single Phase Microemulsions Applied to Oil Sands, SPE Western Regional Meeting. SPE 190086, 2018 Search PubMed.
- Z. Rui, X. Wang, Z. Zhang, J. Lu, G. Chen, X. Zhou and S. Patil, A realistic and integrated model for evaluating oil sands development with Steam Assisted Gravity Drainage technology in Canada, Appl. Energy., 2018, 213, 76–91 CrossRef.
- T. Moussa, M. Mahmoud, E. M. A. Mokheimer, M. A. Habib and S. Elkatatny, Well-Placement Optimization in Heavy Oil Reservoirs Using a Novel Method of In Situ Steam Generation, J. Energy Resour. Technol., 2019, 141(3), 032906, DOI:10.1115/1.4041613.
- G. Giacchetta, M. Leporini and B. Marchetti, Economic and environmental analysis of a Steam Assisted Gravity Drainage (SAGD) facility for oil recovery from Canadian oil sands, Appl. Energy, 2015, 142, 1–9 CrossRef.
- R. Kunzig, The Canadian Oil Boom, Scraping Bottom, National Geographic, 2009 Search PubMed.
- H. Sharma, K. Panthi and K. K. Mohanty, Surfactant-less alkali-cosolvent-polymer floods for an acidic crude oil, Fuel, 2018, 215, 484–491 CrossRef CAS.
- M. M. Abdelhamid, S. A. Rizk, M. A. Betiha, S. M. Desouky and A. M. Alsabagh, Improving heavy oil recovery, part (I): synthesis and surface activity evaluation of some novel organometallic surfactants based on salen-M complexes, RSC Adv., 2021, 11, 1750–1761 RSC.
- J. Mao, J. Liu, H. Wang, X. Yang, Z. Zhang, B. Yang and J. Zhao, Novel terpolymers as viscosity reducing agent for Tahe super heavy oil, RSC Adv., 2017,(7), 19257–19261 RSC.
- J. H. Shamsi, R. Verduzco and G. J. Hirasaki, Reducing adsorption of anionic surfactant for enhanced oil recovery: Part I. Competitive adsorption mechanism, Colloids Surf., A, 2014,(453), 162–167 CrossRef.
- P. Sharma, K. Kostarelos, S. Lenschow, A. Christensen and P. C. de Blanc, Surfactant Flooding Makes a Comeback: Full-Scale Field Results, J. Contam. Hydrol., 2020, 230, 103602, DOI:10.1016/j.jconhyd.2020.103602.
- J. A. Clark and E. E. Santiso, Carbon Sequestration through CO2 Foam-Enhanced Oil Recovery: A Green Chemistry Perspective, Engineering, 2018, 4(3), 336–342, DOI:10.1016/j.eng.2018.05.006.
- G. J. Hirasaki, C. A. Miller and M. Puerto, Recent Advances in Surfactant EOR, SPE J., 2011, 16(4), 889–907, DOI:10.2118/115386-pa.
Footnote |
| † Electronic supplementary information (ESI) available. See DOI: 10.1039/d1ra02855c |
| This journal is © The Royal Society of Chemistry 2021 |

