DOI:
10.1039/D1RA03152J
(Paper)
RSC Adv., 2021,
11, 30849-30859
Facile preparation and characterization of a novel visible-light-responsive Rb2HgI4 nanostructure photocatalyst
Received
22nd April 2021
, Accepted 23rd August 2021
First published on 16th September 2021
Abstract
Visible photocatalytic procedures exhibit encouraging potential in water purification by increasing the photocatalytic performance. Therefore, the improvement of low-cost and efficient photocatalysts for environmental remediation is an increasing demand, and photocatalysts based on semiconductors have gained considerable attention due to their superior stability and activity. In the current study, novel Rb2HgI4 nanostructures were prepared via a simple, low-cost, and low-temperature solid-state method. The effects of different parameters such as type of surfactants, reaction temperature, and reaction time were studied on the structure, crystallinity, particle size, and shape of nanostructures. This new compound has a suitable band gap (2.6 eV) in the visible region. The photocatalytic performance of Rb2HgI4 was examined for the removal of coloring agents under visible light irradiation and it was found that this compound could degrade and eliminate acid black 1 by about 72.1%.
1. Introduction
Nowadays, the primary requirement for freshwater reservoirs has drawn worldwide attention due to fast development in industrialization, urbanization, and massive population growth. These accelerated developments have led to ecological issues, including polluted groundwater and air along with hazardous wastes. It is predicted that the growing demand for freshwater will worsen due to the continuous release of contaminants and pollutants in natural water sources. The reusing and recycling of sewage are essential to enhance the inadequate supply of freshwater.1,2 Numerous strategies, including biological treatment,3 adsorption,4 chemical treatment,5 and membrane-based separations6 have been studied to establish specific water purification. Biological approaches traditionally developed to efficiently eliminate the multiple varieties of pollutants from water finally led to the generation of secondary contaminants, including health-threatening bacteria and soluble refractory organic compounds, which are challenging to eliminate.7 Hence, the improvement of sustainable, nondestructive, and green technology for wastewater/water purification is of highest concern. Semiconductor-based photocatalysts are one of the most successful strategies for wastewater/water treatment owing to their high potential and high efficiency in eliminating toxic organic pollutants utilizing solar light.8–11 The structural, electronic, and optical properties of the material must be carefully studied to promote efficient semiconductor-based photocatalysts for the photodegradation of contaminants in wastewater/water. Commonly, various characteristics, for instance the selection of semiconductor materials, morphological architecture, and surface features, should be considered when designing efficient and stable visible-light-sensitive photocatalysts.12 To design more effective photocatalysts based on semiconductors, strategies based on fundamental principles have been a beneficial instrument in presenting a broad comprehension of photocatalysis, describing experimental data, and predicting innovative semiconductor photocatalyst materials with excellent performance.
Semiconductors, including CdS, ZnS, Fe2O3, ZnO, and TiO2, can be used as sensitizers for photoinduced redox reactions because of the electronic configuration of the metal atoms in the chemical composition, which is described with an empty conduction band (CB) and a filled valence band (VB).13,14 By radiation, VB electrons (e−) are directed to the CB producing holes (h+). These e−–h+ pairs can either interact separately with other molecules or can recombine. The holes might react with hydroxide ions or with electron donors in the solution to create strong oxidizing agents such as superoxide (O2−˙) or hydroxyl (˙OH) radicals.15–17 Alternatively, semiconductors are substances whose VB and CB are separated by band gap or energy gap. When a semiconductor receives photons with energy equivalent to or higher than its band gap, electrons in the VB can get excited and jump up into the CB, therefore producing charge carriers. The recombination of e−–h+ needs to be restricted as much as possible after the first charge separation to have an efficient photocatalytic reaction.18
Several studies have been conducted on halide ferroelectrics having the general formula A2BX4 (A = Rb, Cs, k, Tl; B = Hg, Cd, Zn, Co; X = Cl, Br, I).19–22 They are categorized into two groups with various structures. One group is ferroelectrics possessing an orthorhombic β-K2SO4 structure with the Pmcn space group, and another has a monoclinic Sr2GeS4 structure with the P21/m space group.23 Rubidium tetraiodomercurate(II) (Rb2HgI4) is one of these compounds that is categorized into two classes: superionic materials identified as solid electrolytes, and thermochromic materials, which are a branch of smart materials.24 Solid electrolytes provide the movement of ions without the need of a liquid. The cations in the compounds induce electrical conductivity with their motions.25 Superionic materials are intermediates of solid crystals with organized structure and liquid crystals without organized structure that possesses mobile ions. These compounds are employed as solid batteries, fuel cells, multiple chemical sensors, and supercapacitors. Today, ecological contamination has become a worldwide disaster; therefore, new energy reservoirs, including fuel cells and solar cells have drawn considerable attention. Photodegradation is also one of the most important technologies used in the disposal of pollutants in industrial wastewater. Researchers want to use natural resources available to obtain the energy needed for the degradation of dyes in industrial wastewater, and the most important source of natural energy is sunlight that consists of about 5–7% of UV light, 46% of visible light and 47% of infrared radiation.26,27 The photocatalytic oxidation of numerous harmful organic dyes in industrial wastewater has been carried out over different semiconductor photocatalysts under UV light irradiation. Research is now focused on achieving high photocatalytic efficiency with new photocatalysts, particularly with sunlight. Due to the suitable band gap of Rb2HgI4 (2.6 eV), we decided to study its photocatalytic activity under visible light for the first time. In this research, we have applied the solid-state method to produce Rb2HgI4 nanostructures. Our main purposes are noted below:
(1) Fabrication of Rb2HgI4 nanostructures by a facile route.
(2) Investigation of the photocatalytic activity of this compound for the first time.
Rb2HgI4 nanostructures were constructed via a simple, low-cost solid-state method at low temperatures to achieve the first aim. The morphology of the nanostructures was homogeneous, and we selected this pathway to produce the nanostructures and studied the influence of different types of surfactants on the morphology of the obtained products. So far, nano-Rb2HgI4 has not been reported, and this is the first time that Rb2HgI4 nanostructures are synthesized.
The as-synthesized Rb2HgI4 nanostructures were applied as photocatalysts for the first time to fulfill the second aim. In this study, we have used Rb2HgI4 nanostructures as a novel and efficient catalyst for the photodegradation of organic dyes.
2. Experimental
2.1. Materials
Each chemical reagent applied in the current study was supplied in excellent quality. Lithium iodide (LiI·2H2O), mercury(II) acetate (Hg(O2CCH3)2), rubidium sulfate (Rb2SO4), ethylenediaminetetraacetic acid (EDTA), sodium dodecyl sulfate (SDS), sodium salicylate (NaHSal), and polyvinyl pyrrolidone (PVP-25000) were obtained from Merck Company and used without further purification. Acid black 1 (C22H14N6Na2O9S2), methyl orange (C14H14N3NaO3S), methyl violet (C24H28N3Cl), and rhodamine B (C28H31ClN2O3) were purchased from Sigma-Aldrich.
2.2. Preparation of precursors
The RbI precursor was fabricated by a facile co-precipitation method from Rb2SO4 and LiI. First, a certain amount of Rb2SO4, LiI, and different surfactants (such as EDTA, SDS, NaHSal, and PVP) was liquefied in distilled water in separate beakers, and the solutions were combined with each other. The resultant solution was allowed to stand for crystallizing the white RbI precipitate. An HgI2 precursor was synthesized by adding a LiI solution to Hg(O2CCH3)2 solution to obtain an orange precipitate.
2.3. Fabrication of Rb2HgI4
HgI2 and RbI were mixed in a certain ratio and ground in a mortar. The resulting powder was heated at different temperatures (180–220 °C) in air for 9–12 h. Before the temperature reaches 220 °C, the average temperature rise is 5 °C per minute. After continuing the thermal treatment at 220 °C for a specified time, it was allowed to cool naturally to room temperature (Scheme 1). Table 1 indicates the different conditions for the fabrication of Rb2HgI4 to obtain the best conditions.
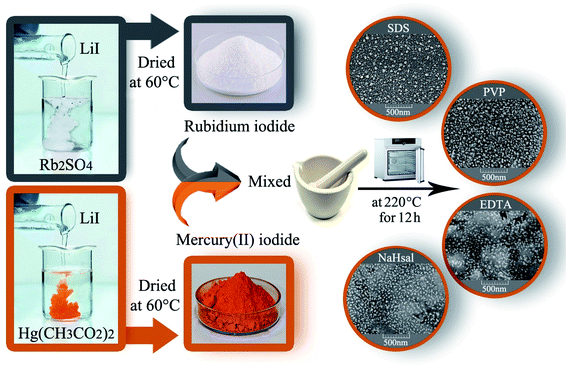 |
| | Scheme 1 Schematic of the fabrication of Rb2HgI4 nanostructures. | |
Table 1 Preparation conditions for Rb2HgI4
| Sample no. |
RbI![[thin space (1/6-em)]](https://www.rsc.org/images/entities/char_2009.gif) : :![[thin space (1/6-em)]](https://www.rsc.org/images/entities/char_2009.gif) HgI2 molar ratio HgI2 molar ratio |
Type of surfactants |
Time (h) |
Temperature (°C) |
Grain size (nm) |
| 1 |
2 |
— |
12 |
220 |
38.8 |
| 2 |
2 |
SDS |
12 |
220 |
33.5 |
| 3 |
2 |
PVP |
12 |
220 |
39.4 |
| 4 |
2 |
EDTA |
12 |
220 |
34.4 |
| 5 |
2 |
NaHsal |
12 |
220 |
36.7 |
| 6 |
2 |
SDS |
9 |
220 |
35.8 |
| 7 |
2 |
SDS |
15 |
220 |
32.6 |
| 8 |
2 |
SDS |
12 |
200 |
37.0 |
| 9 |
2 |
SDS |
12 |
180 |
37.1 |
2.4. Photocatalytic performance
The photocatalytic activity of Rb2HgI4 was examined via its potential for the degradation of different organic colorants under visible radiation. An Osram light (150 W) was employed as the radiation source, containing a wavelength range of 400–780 nm for the photocatalytic process. The experiments were conducted without catalyst and light, and almost no dye was degraded after 90 min. 100 mg Rb2HgI4 was added to 100 mL 10 ppm of dye solution in each experiment. The suspension was mixed in dark for 0.5 h before turning on the visible light. 5 mL sample was removed from the suspension every 15 min during irradiation and centrifuged at 10![[thin space (1/6-em)]](https://www.rsc.org/images/entities/char_2009.gif) 000 rpm for 4 min. The buoyant was collected, separated, and observed with a UV-Vis spectrophotometer.
000 rpm for 4 min. The buoyant was collected, separated, and observed with a UV-Vis spectrophotometer.
3. Result and discussion
3.1. Characterization
The XRD patterns are fingerprints that can help us understand what is in compounds. The XRD pattern of a compound is a simple sum of the diffraction peaks of every phase. Fig. 1a indicates the XRD pattern of sample 1 with a molar ratio of 2![[thin space (1/6-em)]](https://www.rsc.org/images/entities/char_2009.gif) :
:![[thin space (1/6-em)]](https://www.rsc.org/images/entities/char_2009.gif) 1 for RbI to HgI2 formed from rubidium iodide (JCPDS no. 01-073-0385) and mercury iodide (JCPDS no. 01-072-1615) and an amount of unknown phase. Fig. 1b–e presents the XRD patterns of samples in the presence of different surfactants at 220 °C for 12 h. A large amount of unknown phase is observed in these patterns in addition to HgI2 (tetragonal structure) and RbI (cubic structure). The remarkable feature in all XRD patterns is the presence of an unknown phase at different 2θ values that does not match with any of the combinations reported in the database. We aimed to fabricate Rb2HgI4 nanostructures; however, since the reference code of Rb2HgI4 has not been reported, we believe that the general pattern of Rb2HgI4 is related to these XRD patterns. Fig. 1f–i show the effects of reaction time and temperature on the purity of products. Reducing the time of the reaction to 9 h decreased the unknown phase (Fig. 1f). Alternatively, this phase did not have enough time to form. In contrast, increasing the time to 15 h caused an increase in the unknown phase (Fig. 1g). Decreasing the temperature to 200 °C and 180 °C reduces crystallinity and the unknown phase. According to the XRD patterns, the optimum condition was selected at 220 °C for 12 h in the presence of SDS as a capping agent. The crystallite size was determined by the Scherrer equation: D = Kλ/β
1 for RbI to HgI2 formed from rubidium iodide (JCPDS no. 01-073-0385) and mercury iodide (JCPDS no. 01-072-1615) and an amount of unknown phase. Fig. 1b–e presents the XRD patterns of samples in the presence of different surfactants at 220 °C for 12 h. A large amount of unknown phase is observed in these patterns in addition to HgI2 (tetragonal structure) and RbI (cubic structure). The remarkable feature in all XRD patterns is the presence of an unknown phase at different 2θ values that does not match with any of the combinations reported in the database. We aimed to fabricate Rb2HgI4 nanostructures; however, since the reference code of Rb2HgI4 has not been reported, we believe that the general pattern of Rb2HgI4 is related to these XRD patterns. Fig. 1f–i show the effects of reaction time and temperature on the purity of products. Reducing the time of the reaction to 9 h decreased the unknown phase (Fig. 1f). Alternatively, this phase did not have enough time to form. In contrast, increasing the time to 15 h caused an increase in the unknown phase (Fig. 1g). Decreasing the temperature to 200 °C and 180 °C reduces crystallinity and the unknown phase. According to the XRD patterns, the optimum condition was selected at 220 °C for 12 h in the presence of SDS as a capping agent. The crystallite size was determined by the Scherrer equation: D = Kλ/β![[thin space (1/6-em)]](https://www.rsc.org/images/entities/char_2009.gif) cos
cos![[thin space (1/6-em)]](https://www.rsc.org/images/entities/char_2009.gif) θ (ref. 28) was found to be between 32 and 39 nm.
θ (ref. 28) was found to be between 32 and 39 nm.
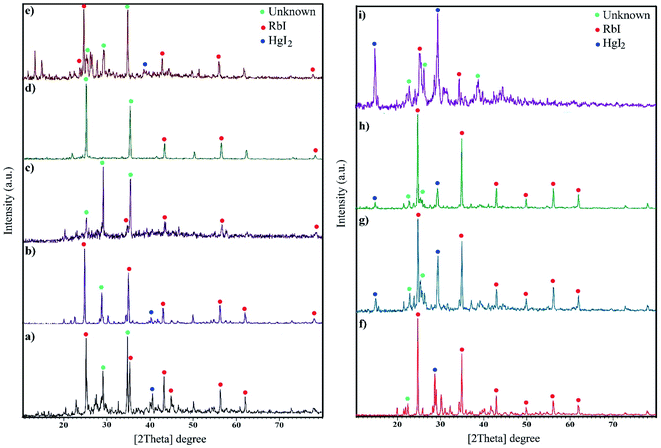 |
| | Fig. 1 XRD pattern of samples (a) 1, (b) 2 (c) 3, (d) 4, (e) 5, (f) 6, (g) 7, (h) 8, and (i) 9. | |
The FESEM images of samples were obtained for studying the morphology, uniformity, shape, and particle size (Fig. 2). The average particle size was measured by the Digimizer software. Fig. 2a indicates that without surfactant, nanoparticles with an average particle size of 24 nm are formed at 220 °C for 12 h (sample 1). Fig. 2b–e show the effects of different types of surfactants. It can be seen that homogenous nanoparticles are formed by using all the surfactant types. Reducing the time of reaction to 9 h caused irregular rod-like structures and microstructures (Fig. 2f). Nanoparticles with an average size of 9 nm were formed on the microstructures by increasing the time of reaction to 15 h (Fig. 2g). Fig. 2h and i show that decreasing the reaction temperature to 200 °C and 180 °C resulted in bulk structures. Therefore, the optimum condition was selected in the presence of SDS as an anionic capping agent at 220 °C for 12 h. Fig. 3 displays the histogram size distribution of samples 1–5 obtained using the Digimizer software, indicating that most particles are between 20 and 30 nm.
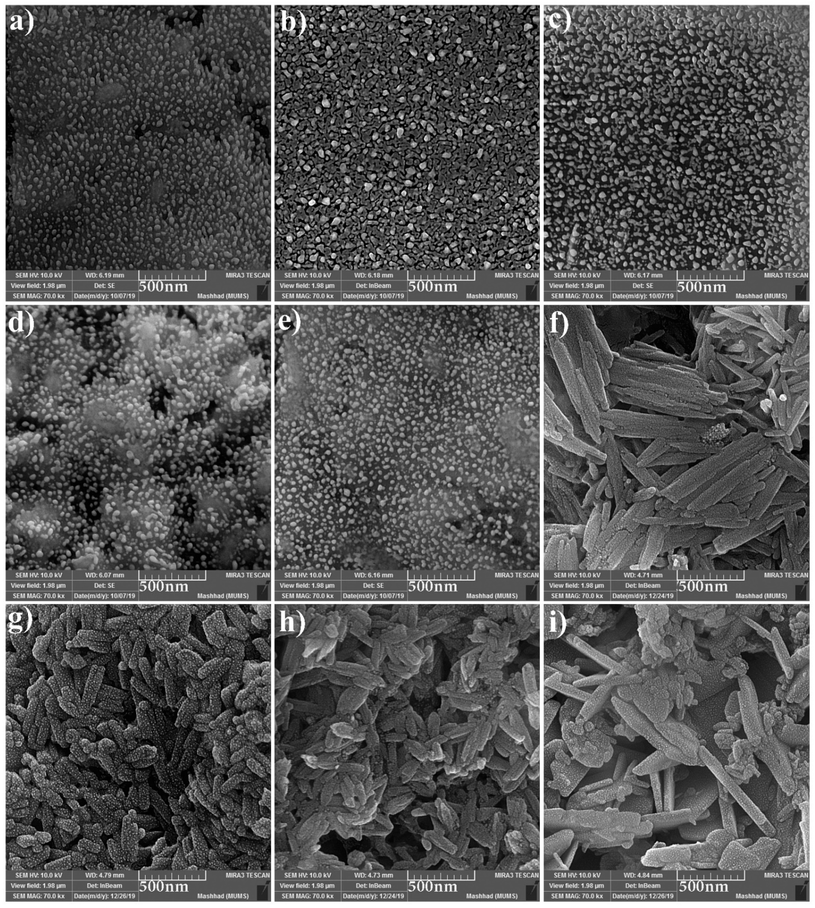 |
| | Fig. 2 FESEM images of the samples (a) 1, (b) 2 (c) 3, (d) 4, (e) 5, (f) 6, (g) 7, (h) 8, and (i) 9. | |
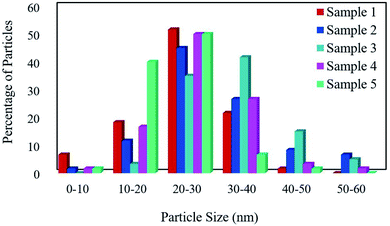 |
| | Fig. 3 The particle size distribution of the samples. | |
Energy-dispersive X-ray spectroscopy (EDX) is an analytical method utilized for chemical characterization or elemental analysis of a sample. Fig. 4 demonstrates the EDX spectra of Rb2HgI4, which indicate that all the peaks are assigned to Rb, Hg, and I elements. Consequently, the products are perfectly purified and related to the XRD outcomes. Besides, the EDX result confirmed the uniform dispersion of the elements on the samples.
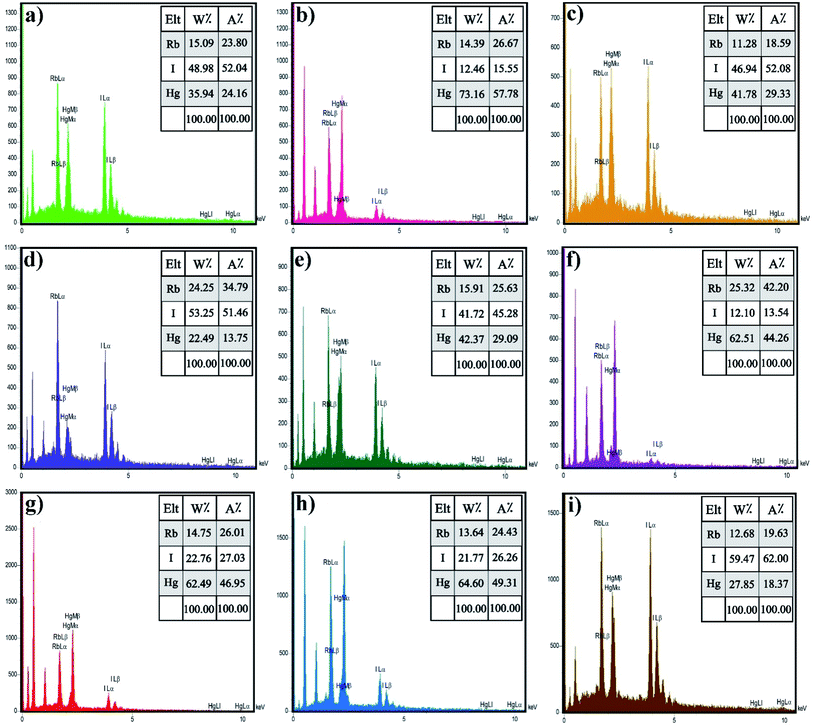 |
| | Fig. 4 EDS spectrum of the samples (a) 1, (b) 2 (c) 3, (d) 4, (e) 5, (f) 6, (g) 7, (h) 8, and (i) 9. | |
Fig. 5 shows the TEM photographs of Rb2HgI4 nanostructures (sample 2) in different scales of 80, 40, and 20 nm. Uniform nanoparticles with an average size of 28 nm are observed in this figure, which corresponds to the SEM and XRD outcomes.
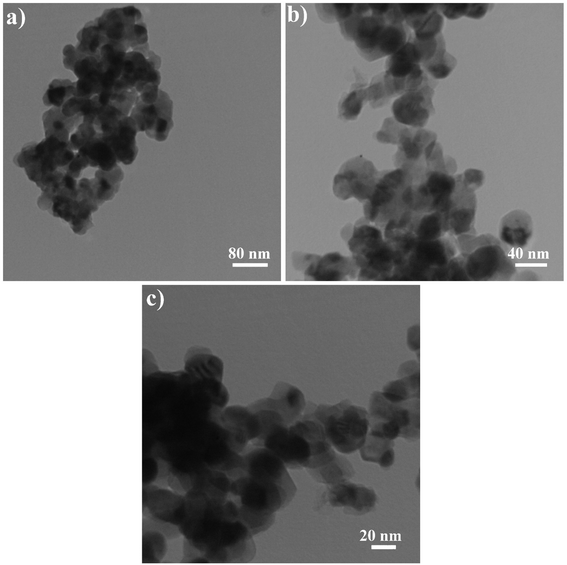 |
| | Fig. 5 TEM images of sample 2. | |
The BET surface area analysis is a standard instrument to calculate the specific surface area and pore volume of samples. The morphology of samples prepared with different surfactant types is similar, and there is no need to analyze the BET surface area of all samples. The adsorption–desorption isotherms of nitrogen for samples 2 and 7 are depicted in Fig. 6a and d, respectively. Based on the IUPAC category, sample 2 exhibits the isotherm type III with the H4-type hysteresis loop (Fig. 6a), which is ascribed to the mesoporous materials (Fig. 6b). The specific BET surface area was calculated to be 36.6 m2 g−1, and the average pore diameter was 3.16 nm. From the BJH plot, the total pore volume and pore diameters were 0.0289 cm3 g−1 and 1.21 nm, respectively (Fig. 6c). The isotherm of sample 7 is type III with an H3-type hysteresis loop, indicating microporous materials (Fig. 6d). The specific surface area was calculated to be 29.2 m2 g−1, and the average pore diameter was 3.72 nm. From the BJH plot, the average pore volume and pore diameters are 0.027 cm3 g−1 and 1.21 nm, respectively (Fig. 6f). The specific surface area of sample 2 (SBET = 36.6 m2 g−1) is greater than that of sample 7 (SBET = 29.2 m2 g−1). This information is well corroborated with the SEM and TEM results. Table 2 compared the BET data of this nanostructure with other iodide nanostructures. Rb2HgI4 nanostructures have a large specific surface area compared with CuPbI3, Tl4HgI6, and Tl4CdI6 and possess a small average pore diameter.
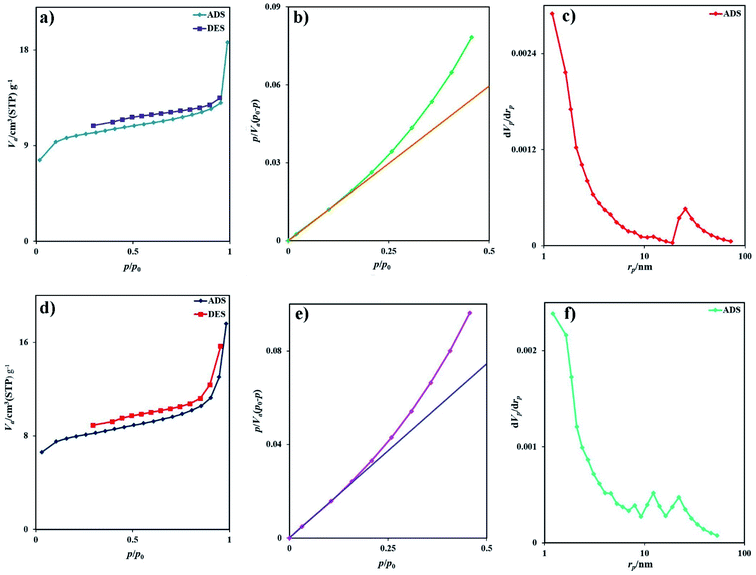 |
| | Fig. 6 (a) Low temperature N2 adsorption/desorption isotherm, (b) BET plot, (c) BJH plot of sample 2, (d) low temperature N2 adsorption/desorption isotherm, (e) BET plot, and (f) BJH plot of sample 7. | |
Table 2 The surface characteristics related to iodide compounds
| Sample |
BET surface area (m2 g−1) |
Pore volume (cm3 g−1) |
Mean pore diameter (nm) |
Ref. |
| Rb2HgI4 (sample 2) |
36.6 |
0.029 |
3.16 |
This work |
| Rb2HgI4 (sample 7) |
29.2 |
0.027 |
3.72 |
This work |
| CuPbI3 nanostructures |
15.57 |
0.055 |
14.24 |
39 |
| CuPbI3 nanostructures |
10.49 |
0.010 |
3.87 |
39 |
| TlPbI3/Tl4PbI6 nanocomposites |
51.54 |
0.031 |
2.43 |
40 |
| TlPbI3/Tl4PbI6 nanocomposites |
24.20 |
0.020 |
3.28 |
40 |
| Tl4HgI6 nanostructures |
1.79 |
0.41 |
5.90 |
38 |
| Tl4HgI6 nanostructures |
1.16 |
0.27 |
12.39 |
38 |
| Tl4Cdl6 nanostructures |
5.84 |
0.108 |
9.68 |
29 |
| Tl4Cdl6 nanostructures |
5.39 |
0.124 |
36.34 |
29 |
| CsPbl3 nanostructures |
61.79 |
0.13 |
8.33 |
33 |
| CsPbl3 nanostructures |
68.74 |
0.10 |
6.05 |
33 |
Fig. 7 represents the optical properties of sample 2 via UV-Vis diffuse reflectance spectroscopy (DRS). The Rb2HgI4 nanostructure displays typical absorptions in the range of 200–400 nm. The band gap (B.G.) can be defined employing the following equation:29
| | |
A(hν − B.G.) = (αhν)1/r,
| (1) |
where,
A is the material constant, hυ is the light energy,
r is 2 or 1/2 for indirect and direct allowed transitions, and
α is the absorption factor.
29 Considering that a band gap is observed in the (
αhν)
2 vs. hν diagram and this value does not match with the band gap of RbI
30 and HgI
2,
31 it indicates the formation of a pure (not composite) compound called Rb
2HgI
4. The optical band gap of Rb
2HgI
4 was determined at 2.6 eV.
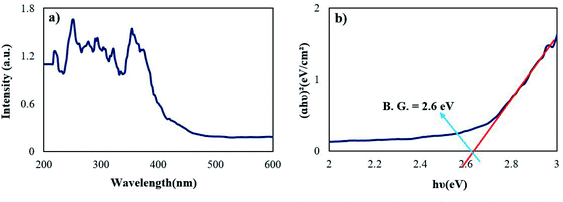 |
| | Fig. 7 (a) DRS spectrum and (b) optical density (αhν)2 vs. energy (E) plot of the samples 2. | |
3.2. Photocatalytic activity
The photocatalytic activity of Rb2HgI4 nanostructures was studied by monitoring the degradation of anionic and cationic coloring agents as organic contaminants, such as acid black 1 (AB1), methyl orange (MO), methyl violet (MV), and rhodamine B (RhB) in an aqueous solution, under visible light (Osram light (150 W lamp produces 2600 lumens of light)) (Fig. 8). The spectral irradiance for the visible lamp was 400–780 nm according to the information provided by the manufacturer. Without Rb2HgI4 or light, almost no dyes were degraded after 90 min, revealing that the self-degradation part was insignificant. The degradation percentage (%D) was defined as follows:| | |
%D = (A0 − At)/A0 ×100
| (2) |
where At and A0 are the solution absorbance of the sample after and before degradation, respectively.32 The influence of various coloring agents and catalyst dosage was measured to obtain the optimum performance. Fig. 8a reveals the photocatalytic degradation of AB1, MO, MV, and RhB in the presence of 0.03 g Rb2HgI4. The Rb2HgI4 nanostructures can destroy these coloring agents by about 56.9%, 51.0%, 40.0%, and 36.1% after 90 min, respectively. The decolorization percentage of 0.05 g Rb2HgI4 are about 65.0%, 56.2%, 45.0%, and 41.1% for AB1, MO, MV, and RhB, respectively (Fig. 8c). Increasing the Rb2HgI4 dosage to 0.07 g enhanced the photocatalytic degradation to 72.1%, 63.1%, 55.1%, and 48.1%, respectively (Fig. 8e). Increasing the catalyst dosage is conducted in the space of the catalyst surface and enhances the dye adsorption on the catalyst surface.33 Besides, Rb2HgI4 nanostructures can destroy the anionic coloring agents better than the cationic ones. Hence, the highest performance was for AB1 (72.1%), and RhB (cationic dye) had the minimum yield. Table 3 shows the comparison of the photodegradation of different iodide compounds under visible and UV light. As demonstrated in this table, Rb2HgI4 can compete with other iodide compounds as a photocatalyst. We can propose Rb2HgI4 as a novel catalyst for the water purification process. Moreover, the possible reaction rate constants of the coloring agents were determined depending on the Langmuir–Hinshelwood mechanism.28,34where C0 is the initial concentration of coloring agents; C is the concentration of coloring agents at t time; k is the pseudo-first order rate constant (min−1). The rate constant (k) was determined from the linear plot of ln(C0/C) vs. reaction time. As displayed in Fig. 8b, d, and f, better photocatalytic performance was achieved with a higher reaction rate constant.
 |
| | Fig. 8 Photocatalytic degradation of different coloring agents over sample 2 with different dosages of Rb2HgI4 (a) 0.03 g, (c) 0.05 g, and (e) 0.07 g, plots of ln(C0/C) vs. time (b) 0.03 g, (d) 0.05 g, and (f) 0.07 g under visible-light irradiation. | |
Table 3 The photocatalytic activity of different iodide compounds
| Sample |
Highest decolorization (%) |
Lowest decolorization (%) |
Catalyst dosage (g) |
Source of light |
Ref. |
| Thymol blue. Methylene blue. |
| Rb2HgI4 (sample 2) |
72.1 (AB1) |
48.1 (RhB) |
0.07 |
Vis |
This work |
| Tl4HgI6 nanostructures |
76.9 (RhB) |
48.9 (ThBa) |
0.07 |
UV |
38 |
| Tl4Cdl6 nanostructures |
85.7 (AB1) |
49.1 (MBb) |
0.05 |
UV |
29 |
| CsPbl3 nanostructures |
81.7 (MV) |
33.0 (AB1) |
0.07 |
Vis |
33 |
| Cu2CdI4/CuI nanocomposites |
66.0 (MB) |
29.1 (MO) |
0.05 |
UV |
41 |
| Ag2CdI4 nanostructures |
95.3 (RhB) |
57.1 (AB1) |
0.05 |
UV |
42 |
| TlCdI3 nanostructures |
94.6 (MB) |
27.0 (MO) |
0.05 |
UV |
43 |
| Ag2ZnI4/AgI nanocomposites |
89.3 (MO) |
— |
0.05 |
UV |
44 |
| Cu2ZnI4/ZnO nanocomposites |
54.2 (MO) |
— |
0.05 |
UV |
45 |
Fig. 9a shows the decolorization of AB1 under visible light after 120 min, and the percentage was obtained to be 75.3%. Increasing the time of the photocatalytic reaction improved the destruction by about 3%. The photocatalytic behavior of RbI and HgI2 was studied over AB1 under visible light, indicating 65.5% and 67.0% degradation, respectively (Fig. 9b). The result showed that the performance of Rb2HgI4 for the degradation of organic dye is higher than its precursors.
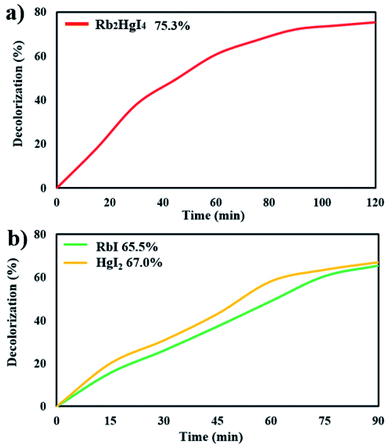 |
| | Fig. 9 Photocatalytic degradation of (a) 0.07 g Rb2HgI4 after 120 min, (b) 0.07 g RbI and HgI2 after 90 min under visible light. | |
3.2.1 Photocatalytic reaction mechanism. Scheme 2 shows the schematic of the mechanism for the photocatalytic degradation of Rb2HgI4 nanostructures over different dyes. Multiple primary reactive species, including 1O2, H˙, HO˙, O2˙−, and h+ can be generated through the photocatalytic destruction procedures in semiconductors.35 The O2˙− generation can restrict the photoinduced charge carrier recombination. HO˙ may be produced only in the e− → O2˙− → H2O2 → OH˙ procedure. In addition, the hydroxyl radicals are produced through various reduction steps of superoxide anions in the process. As maintained in previous researches,33 the main reactive oxygen species (ROS) generated within the oxidation reactions and photocatalytic process are 1O2 and OH˙ radicals, respectively. Based on the mentioned concepts, we can propose that the generation possibility of O2˙− should be much higher than the OH˙ production. Nonetheless, OH˙ is a strong, non-selective oxidizing agent that leads to the complete or incomplete mineralization of diverse organic mixtures. As mentioned in descriptions, the active species in the mechanism of organic dye degradation are O2˙−, ˙OH, and 1O2. There are literature reports indicating that the superoxide anion (O2˙−) plays the principal part, while the hydroxyl radical (˙OH) and singlet oxygen (1O2) play a minor part in the degradation of dyes.36 O2−˙ might be created via the reaction of O2 and/or 1O2 with e− species. The 1O2 might be produced via an h+ with O2−˙ species. The ˙OH might be generated with an h+ and H2O.33 Hence, O2−˙ could play the role of most basic active species in this study. We can perceive the photocatalytic mechanism for eliminating the organic pollutants as follows:33,37,38
| ˙O2− or ˙OH + coloring agents → degradation sample |
| h+ + coloring agents → coloring agents+˙ → degradation sample |
| O2−˙ or ˙OH + coloring agents+˙ → degradation sample |
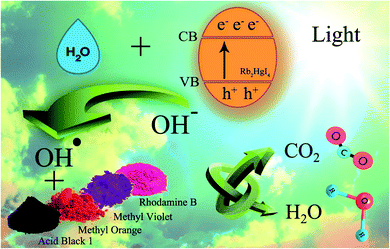 |
| | Scheme 2 Schematic of the mechanism for the photocatalytic degradation of Rb2HgI4 nanostructures over different dyes. | |
4. Conclusions
Recently, photocatalysts based on semiconductors have gained significant attention as primary substances in the environmental remediation and water treatment. Nevertheless, most of them cannot show photocatalytic performance in the visible range because of their wide band gap. Furthermore, a high recombination rate is another crucial parameter that decreases the sunlight energy transformation performance. Here, we introduced a novel photocatalyst with a suitable band gap in the visible area. Rb2HgI4 nanostructures have been fabricated by the solid-state method at low temperatures (220 °C). The impact of various parameters, including surfactant types, time, and temperature of the reaction on the structure, purity, morphology, shape, and particle size was studied. The band gap of Rb2HgI4 was determined to be 2.6 eV, which makes this compound suitable for photocatalytic activity. The photocatalytic results revealed that Rb2HgI4 degraded acid black 1 by about 72.1%.
Conflicts of interest
The authors declare that there are no conflicts of interest regarding the publication of this manuscript.
Acknowledgements
The authors acknowledge the University of Kashan by Grant No (159271/EA2) and Iran National Science Foundation (INSF, 97017837) for supporting this investigation.
References
- B. Pernet-Coudrier, W. Qi, H. Liu, B. Müller and M. Berg, Environ. Sci. Technol., 2012, 46, 5294–5301 CrossRef CAS PubMed.
- F. Opoku, K. K. Govender, C. G. C. E. van Sittert and P. P. Govender, Adv. Sustainable Syst., 2017, 1, 1700006 CrossRef.
- C. Huang, W.-Z. Liu, Z.-L. Li, S.-M. Zhang, F. Chen, H.-R. Yu, S.-L. Shao, J. Nan and A.-J. Wang, Water Res., 2018, 130, 1–12 CrossRef CAS PubMed.
- M. Rafatullah, O. Sulaiman, R. Hashim and A. Ahmad, J. Hazard. Mater., 2010, 177, 70–80 CrossRef CAS PubMed.
- M. Catalá, N. Domínguez-Morueco, A. Migens, R. Molina, F. Martínez, Y. Valcárcel, N. Mastroianni, M. L. de Alda, D. Barceló and Y. Segura, Sci. Total Environ., 2015, 520, 198–205 CrossRef PubMed.
- M. M. Pendergast and E. M. Hoek, Energy Environ. Sci., 2011, 4, 1946–1971 RSC.
- O. Ganzenko, D. Huguenot, E. D. Van Hullebusch, G. Esposito and M. A. Oturan, Environ. Sci. Pollut. Res., 2014, 21, 8493–8524 CrossRef CAS PubMed.
- G. Wang, H. Yuan, A. Kuang, W. Hu, G. Zhang and H. Chen, Int. J. Hydrogen Energy, 2014, 39, 3780–3789 CrossRef CAS.
- H. Dong, G. Chen, J. Sun, Y. Feng, C. Li and C. Lv, Chem. Commun., 2014, 50, 6596–6599 RSC.
- H. Dong, G. Chen, J. Sun, C. Li, Y. Yu and D. Chen, Appl. Catal., B, 2013, 134, 46–54 CrossRef.
- Y. Zhou, G. Chen, Y. Yu, Y. Feng, Y. Zheng, F. He and Z. Han, Phys. Chem. Chem. Phys., 2015, 17, 1870–1876 RSC.
- X. Qu, P. J. Alvarez and Q. Li, Water Res., 2013, 47, 3931–3946 CrossRef CAS PubMed.
- M. R. Hoffmann, S. T. Martin, W. Choi and D. W. Bahnemann, Chem. Rev., 1995, 95, 69–96 CrossRef CAS.
- N. Hussain, S. Alwan, H. Alshamsi and I. Sahib, Int. J. Chem. Eng., 2020, 2020, 9068358 Search PubMed.
- W. Z. Tang and H. An, Chemosphere, 1995, 31, 4171–4183 CrossRef CAS.
- U. G. Akpan and B. H. Hameed, J. Hazard. Mater., 2009, 170, 520–529 CrossRef CAS PubMed.
- H. Altaee and H. A. Alshamsi, J. Phys.: Conf. Ser., 2020, 1664, 012074 CrossRef CAS.
- T. Van Gerven, G. Mul, J. Moulijn and A. Stankiewicz, Chem. Eng. Process., 2007, 46, 781–789 CrossRef CAS.
- S. Sawada, Y. Shiroishi, A. Yamamoto, M. Takashige and M. Matsuo, J. Phys. Soc. Jpn., 1977, 43, 2099–2100 CrossRef CAS.
- S. Sawada, Y. Shiroishi, A. Yamamoto, M. Takashige and M. Matsuo, J. Phys. Soc. Jpn., 1977, 43, 2101–2102 CrossRef CAS.
- S. Sawada, Y. Shiroishi and A. Yamamoto, Ferroelectrics, 1978, 21, 413–414 CrossRef CAS.
- F. Shimizu, T. Yamaguchi and M. Takashige, J. Phys. Soc. Jpn., 2000, 69, 4055–4059 CrossRef CAS.
- F. Shimizu, T. Yamaguchi and M. Takashige, Ferroelectrics, 2006, 337, 77–84 CrossRef CAS.
- M. Ghanbari, F. Soofivand and M. Salavati-Niasari, J. Mol. Liq., 2016, 223, 21–28 CrossRef CAS.
- S. Hull, Rep. Prog. Phys., 2004, 67, 1233 CrossRef CAS.
- M. A. Al-Bedairy and H. A. H. Alshamsi, Eurasian J. Anal. Chem., 2018, 13, em72 Search PubMed.
- H. A. H. Alshamsi and S. H. Alwan, Res. J. Pharm., Biol. Chem. Sci., 2015, 6, 985–996 CAS.
- M. Ghanbari and M. Salavati-Niasari, Ecotoxicol. Environ. Saf., 2021, 208, 111712 CrossRef CAS PubMed.
- M. Ghanbari and M. Salavati-Niasari, Inorg. Chem., 2018, 57, 11443–11455 CrossRef CAS PubMed.
- C. S. Inouye and W. Pong, Phys. Rev. B, 1977, 15, 2265–2272 CrossRef CAS.
- M. K. Klintenberg, M. J. Weber and D. E. Derenzo, J. Lumin., 2003, 102–103, 287–290 CrossRef CAS.
- Y. Orooji, M. Ghanbari, O. Amiri and M. Salavati-Niasari, J. Hazard. Mater., 2020, 389, 122079 CrossRef CAS PubMed.
- M. Karami, M. Ghanbari, O. Amiri and M. Salavati-Niasari, Sep. Purif. Technol., 2020, 253, 117526 CrossRef CAS.
- H. A. Alshamsi, M. A. Al Bedairy and S. H. Alwan, IOP Conf. Ser.: Earth Environ. Sci., 2021, 722, 012005 CrossRef.
- Y.-R. Jiang, H.-P. Lin, W.-H. Chung, Y.-M. Dai, W.-Y. Lin and C.-C. Chen, J. Hazard. Mater., 2015, 283, 787–805 CrossRef CAS PubMed.
- T.-W. Tzeng, S.-L. Wang, C.-C. Chen, C.-C. Tan, Y.-T. Liu, T.-Y. Chen, Y.-M. Tzou, C. C. Chen and J. T. Hung, RSC Adv., 2016, 6, 69301–69310 RSC.
- M. Mahdiani, F. Soofivand, F. Ansari and M. Salavati-Niasari, J. Cleaner Prod., 2018, 176, 1185–1197 CrossRef CAS.
- M. Karami, M. Ghanbari, H. A. Alshamsi, S. Rashki and M. Salavati-Niasari, Inorg. Chem. Front., 2021, 8, 2442–2460 RSC.
- M. Karami, M. Ghanbari, H. A. Alshamsi, M. Ghiyasiyan-Arani and M. Salavati-Niasari, Int. J. Hydrogen Energy, 2021, 46, 19074–19084 CrossRef CAS.
- M. Karami, M. Ghanbari, O. Amiri, M. Ghiyasiyan-Arani and M. Salavati-Niasari, Int. J. Hydrogen Energy, 2021, 46, 6648–6658 CrossRef CAS.
- M. Ghanbari, M. Sabet and M. Salavati-Niasari, J. Mater. Sci.: Mater. Electron., 2016, 27, 11092–11101 CrossRef CAS.
- M. Ghanbari, S. Gholamrezaei, M. Salavati-Niasari and A. Abbasi, J. Mater. Sci.: Mater. Electron., 2017, 28, 6272–6277 CrossRef CAS.
- M. Ghanbari, F. Ansari and M. Salavati-Niasari, Inorg. Chim. Acta, 2017, 455, 88–97 CrossRef CAS.
- F. Razi, S. Zinatloo-Ajabshir and M. Salavati-Niasari, J. Mol. Liq., 2017, 225, 645–651 CrossRef CAS.
- F. Razi, F. Soofivand and M. Salavati-Niasari, J. Mol. Liq., 2016, 222, 435–440 CrossRef CAS.
|
| This journal is © The Royal Society of Chemistry 2021 |
Click here to see how this site uses Cookies. View our privacy policy here.  Open Access Article
 *a
*a
![[thin space (1/6-em)]](https://www.rsc.org/images/entities/char_2009.gif) :
:![[thin space (1/6-em)]](https://www.rsc.org/images/entities/char_2009.gif) HgI2 molar ratio
HgI2 molar ratio![[thin space (1/6-em)]](https://www.rsc.org/images/entities/char_2009.gif) 000 rpm for 4 min. The buoyant was collected, separated, and observed with a UV-Vis spectrophotometer.
000 rpm for 4 min. The buoyant was collected, separated, and observed with a UV-Vis spectrophotometer.
![[thin space (1/6-em)]](https://www.rsc.org/images/entities/char_2009.gif) :
:![[thin space (1/6-em)]](https://www.rsc.org/images/entities/char_2009.gif) 1 for RbI to HgI2 formed from rubidium iodide (JCPDS no. 01-073-0385) and mercury iodide (JCPDS no. 01-072-1615) and an amount of unknown phase. Fig. 1b–e presents the XRD patterns of samples in the presence of different surfactants at 220 °C for 12 h. A large amount of unknown phase is observed in these patterns in addition to HgI2 (tetragonal structure) and RbI (cubic structure). The remarkable feature in all XRD patterns is the presence of an unknown phase at different 2θ values that does not match with any of the combinations reported in the database. We aimed to fabricate Rb2HgI4 nanostructures; however, since the reference code of Rb2HgI4 has not been reported, we believe that the general pattern of Rb2HgI4 is related to these XRD patterns. Fig. 1f–i show the effects of reaction time and temperature on the purity of products. Reducing the time of the reaction to 9 h decreased the unknown phase (Fig. 1f). Alternatively, this phase did not have enough time to form. In contrast, increasing the time to 15 h caused an increase in the unknown phase (Fig. 1g). Decreasing the temperature to 200 °C and 180 °C reduces crystallinity and the unknown phase. According to the XRD patterns, the optimum condition was selected at 220 °C for 12 h in the presence of SDS as a capping agent. The crystallite size was determined by the Scherrer equation: D = Kλ/β
1 for RbI to HgI2 formed from rubidium iodide (JCPDS no. 01-073-0385) and mercury iodide (JCPDS no. 01-072-1615) and an amount of unknown phase. Fig. 1b–e presents the XRD patterns of samples in the presence of different surfactants at 220 °C for 12 h. A large amount of unknown phase is observed in these patterns in addition to HgI2 (tetragonal structure) and RbI (cubic structure). The remarkable feature in all XRD patterns is the presence of an unknown phase at different 2θ values that does not match with any of the combinations reported in the database. We aimed to fabricate Rb2HgI4 nanostructures; however, since the reference code of Rb2HgI4 has not been reported, we believe that the general pattern of Rb2HgI4 is related to these XRD patterns. Fig. 1f–i show the effects of reaction time and temperature on the purity of products. Reducing the time of the reaction to 9 h decreased the unknown phase (Fig. 1f). Alternatively, this phase did not have enough time to form. In contrast, increasing the time to 15 h caused an increase in the unknown phase (Fig. 1g). Decreasing the temperature to 200 °C and 180 °C reduces crystallinity and the unknown phase. According to the XRD patterns, the optimum condition was selected at 220 °C for 12 h in the presence of SDS as a capping agent. The crystallite size was determined by the Scherrer equation: D = Kλ/β![[thin space (1/6-em)]](https://www.rsc.org/images/entities/char_2009.gif) cos
cos![[thin space (1/6-em)]](https://www.rsc.org/images/entities/char_2009.gif) θ (ref. 28) was found to be between 32 and 39 nm.
θ (ref. 28) was found to be between 32 and 39 nm.


