 Open Access Article
Performance and mechanisms for V(V) bio-reduction by straw: key influencing factors
Liting Hao,
Yuanyuan He,
Chen Shi and
Xiaodi Hao *
*
Sino-Dutch R&D Centre for Future Wastewater Treatment Technologies, Key Laboratory of Urban Stormwater System and Water Environment, Beijing University of Civil Engineering and Architecture, Beijing 100044, China. E-mail: xdhao@hotmail.com
First published on 10th August 2021
Abstract
A high concentration of vanadium [V(V)] in groundwater is extremely harmful for humans. Weak movability and low toxicity after microbial V(V) reduction have attracted remarkable attention, especially for using solid carbon sources. However, the influencing factors remain unclear. In this study, the initial V(V) concentration, inocula amount and straw dosage were examined to ascertain the mechanisms behind them. Increasing the initial V(V) concentration led to the decrease of the V(V) removal efficiency, which was also positively correlated with the straw dosage within a certain range. The initial sludge amount was not a main factor affecting microbial V(V) removal in this study. With the initial amount of 10 mg L−1 V(V), 25 mL initial inocula and 5 g straw, 88.2% of V(V) was removed. According to the dissolved organic matter (DOM) analysis results, microbial activity prevailed in groups with higher V(V) removal efficiency, indicating that the V(V) bio-reduction was attributed to the microbial activity, which was considered a major factor. Functional species as unclassified_f_Enterobacteriaceae presumably contributed to the V(V) bioreduction, with upregulated ABC transporter genes and enzymes.
1 Introduction
The quality of groundwater resources varies with the concentrations of pollutants, especially for trace elements.1 Over 50 types of identified trace elements in nature can pertain to the classification of heavy metals, and vanadium(V) is the most representative one.2 V is especially significant for geochemistry since it can serve as an ideal tracer of oxygen fugacity,3,4 and may have been critical to biological electron transfer in the early history of the earth.5 However, it should be noted that V is considered as one of the most dangerous heavy metals in water, together with lead, mercury, arsenic and cadmium, for its long-term migration.6 Although V is essential in trace amounts (0.05 μM), over 10 μM can cause a range of pathologies and irreversible damage.7 For instance, approximately 14.2 μg V per L contained in human urine has shown a reduction in neurobehavioral abilities.8 Indeed, up to 58.6 mg V per L in groundwater has been found near the fly ash pits in Chisman Creek.9 In China, the concentration of V in shallow groundwater near the slag field of Panzhihua is as high as 13.98 mg L−1.10 Meanwhile, due to the leaching from contaminated soil/V tailings, the V concentration of groundwater near Chaobei River of Hebei Province has reached 11 mg L−1.11Regarding its immigration and transformation, there are many factors impacting the V(V) changes in groundwater; even climate changes due to sea level rising would have a major impact on the coastal groundwater quality via flooding and accelerated seawater intrusion. Compared to natural reasons, anthropic factors are clearly significant.12 Heavy V contamination has become one of the spotlights of research studies around the world. In China, the drinking water standards (GB3838-2002) have ruled V at 0.05 mg L−1, while California has regulated its V standard at 15 μg L−1.13 For the above reasons, it is of importance to urgently remediate the V-contaminated groundwater.
Usually, V exists in four forms: V(V), V(IV), V(III) and V(II).7 The toxicity of oxidized V compounds (mainly V(V)) is much higher than that of other species.14 Typically, chemical reduction, physical adsorption, and biological reduction are widely applied for V(V) removal.15–17 Bioremediation technology is capable of converting the moderate and highly toxic V(V) to the less toxic V(IV), in which the recoverability could be further enhanced by centrifugation or filtration.18 The V(V) bioremediation process could be mediated by microbes in the presence of added electron donors,19 such as solid carbon sources that can act as carriers with the high-quality slow-release ability. In our previous study, the application of agricultural biomass (sawdust) could efficiently enhance the microbial V(V) removal efficiency up to 90.3%.13 However, a comprehensive investigation on factors affecting V(V) bio-reduction during application processes has not been conducted yet.
With this study, straw (agricultural biomass) was selected as an electron donor and carbon source. Some key factors controlling the V(V) bio-reduction were investigated to demonstrate the practical engineering applicability, including the initial V(V) concentration, inocula amount, and straw dosage. Also, the evolution and stabilization process of dissolved organic matters were discussed. The microbial community structure and functional species with related genes and enzymes were also analyzed to develop the interpretation of the V(V) reduction mechanisms.
2 Materials and methods
2.1 Microbes' cultivation and materials
Sludge containing little or no metal ions was cultivated in a 6 L fermentation tank, as described previously.20 Afterwards, it was cultured in a 1 L anaerobic bottle under mesophilic conditions (35 °C, 160 rpm), and the supernatant was replaced every other three days by a liquid medium with 1.6 g L−1 CH3COONa and 0.17942 g L−1 NaVO3. After the cultivation for 3 months, the sludge was centrifuged at 3000 rpm for 30 min, and the precipitated sludge was prepared as inocula. Straw was pre-treated simply prior to use. It was sieved into particles with a diameter between 1 and 3 mm, and then washed by deionized water three times. Finally, the collected samples were dried in a constant-temperature oven at 40 °C for 72 h prior to use.2.2 Experimental procedure
Sixteen fermentation flasks with a 500 mL volume were employed as reactors and duplicates. Each reactor was filled with 500 mL of real groundwater from a well (Beijing, China). V(V) was introduced in the form of NaVO3 at a given concentration of 75 mg L−1. The specific factors of microbial V(V) removal performance were separately examined, including the initial V(V) concentrations (10, 75 and 150 mg L−1), straw dosages (1, 5 and 10 g), and inocula (10, 25 and 50 mL). A single factor was studied with the other parameters fixed, including the 75 mg L−1 initial V(V), 5 g straw dosages (1–3 mm) and sludge amount of 25 mL. Two reactors without straw but inoculated with precipitated sludge (25 mL) and 75 mg L−1 V(V) were classified as the control groups, which were operated under the same conditions as the other reactors.2.3 Chemical and microbial analyses
Supernatant samples were collected periodically from the reactors, and then filtered by 0.45 μm membranes. The total V(V) in the solutions was measured by ICP-OES (ICAP7200, Thermo Fisher Scientific, USA), and V(V) was analyzed with spectrophotometry at 601 nm. The wheat straw before use and after V(V) adsorption and bio-reduction were analysed by Fourier transform infrared spectroscopy (FTIR) (Nicolet Is5, Thermo Fisher Scientific, USA) and scanning electron microscope (SEM, Gemini 300, ZEISS, Germany). To reveal the changes of dissolved organic matter (DOM) in the microbial V(V) reduction processes, a fluorescence spectrophotometer (Lumina, Thermo Fisher Scientific, USA) was adopted to record the three-dimensional fluorescence excitation emission matrix (EEM). Afterwards, the three-dimensional fluorescence spectral data were pre-processed to eliminate the effects of Raman scattering and Rayleigh scattering.21 The fluorescence region integral method (FRI) was employed for the analysis. Parallel factor analysis (PARAFAC), which is capable of decomposing dissolved EEM organic matters and converting them into independent components available for qualitative and quantitative characterization of organic compounds,21 was also utilized in this study.The microbial community was investigated in the original inoculated sludge (C), the control group (J) without straw added, as well as the experimental groups with the initial V(V) concentration of 75 mg L−1 (A) and 10 mg L−1 (H). Furthermore, DNA was extracted, pooled, amplified by PCR with primers 515FmodF (5′-GTGYCAGCMGCCGCGGTAA-3′) and 806RmodR (5′-GGACTACNVGGGTWTCTAAT-3′). Samples were sent to Shanghai Majorbio Bio-pharm Technology Co., Ltd. with the obtained sequences submitted to the NCBI Sequence Read Archive (no. PRJNA715723).
3 Results and discussion
3.1 Optimization of operation factors
Our previous study also proved that sawdust could support the V(V) bio-removal within 10 d (90.3%).13 For the initial 10 mg V per L (Fig. 1a) in this study, the V(V) concentration in the effluent was close to the requirement (1.0 mg V per L) of the discharge standard of pollutants for the vanadium industry in China (GB 26452-2011). The V(V) removal efficiency in the reactors with the initial V(V) concentrations of 10, 75, and 150 mg L−1 were around 88.2%, 71.7% and 68.7%, with the corresponding removal rate of 0.06, 0.37, and 0.72 mg (L−1 h−1), respectively. As revealed from the results, both V(V) removal efficiency and rate were negatively correlated with the initial V(V) concentration, which was also demonstrated in a study on the V(V) removal by S and Fe autotrophic organisms.17 Moreover, the removal efficiency of microbial V(V) reduction with hydrogen being an electron donor in groundwater also decreased with increasing V(V).22
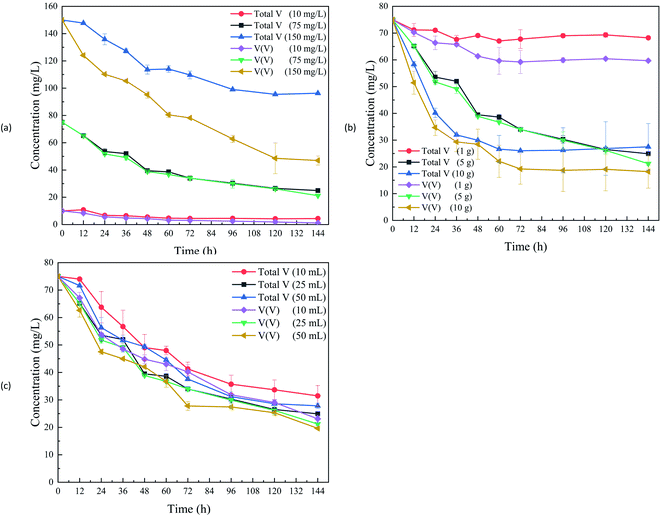 | ||
| Fig. 1 Total V and V(V) concentrations with various initial V(V) concentrations (a); initial straw dosage (b); initial inocula amount (c). | ||
With the initial V(V) concentration increased, the V(V) removal amount was also increased. However, the removal efficiency decreased, which should be attributed to the inhibition of the anaerobic microorganisms' activity at the extravagant initial concentrations of V(V). The colony/cell counts of bacterial species would decrease with a gradual increase of V(V) concentration.23 In addition, it could be found that microbes in the reactors could adapt to V(V) with its wide range of concentrations. Moreover, the total V removal efficiency in the reactors with the initial concentrations of 10, 75 and 150 mg L−1 V(V) were at 56.0%, 66.8% and 35.8%, respectively. The total V decreased amount indicated the precipitation of the V(V) reduction product. The removal efficiency of the total V was lower than that of V(V) due to the fact that the total V includes V(V) and other low-valent V (reduction product), such as V(IV).
3.2 Wheat straw utilization and processes
Fig. 2a–c showed the SEM images of wheat straw before utilization, and after V(V) adsorption and bio-reduction. The surface of wheat straw before use was clean and smooth, whereas the wheat straw after adsorption showed signs of rupture and disorder utilization. Meanwhile, wheat straw after bio-reduction were seriously damaged, with the phenomena of fibres shedding and breaking. Obviously, a small amount of biofilm-like substances attached to wheat straw after bio-reduction.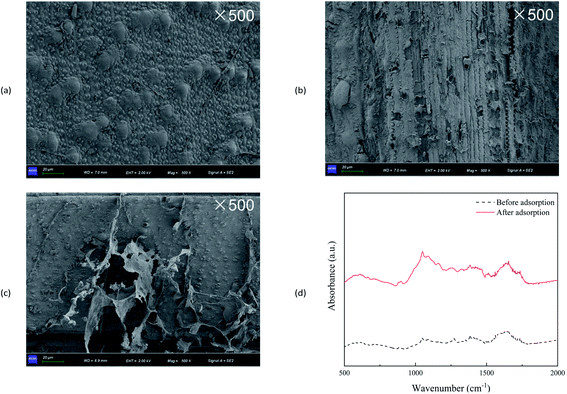 | ||
| Fig. 2 SEM images of wheat straw before use (a), wheat straw after V(V) adsorption (b) and bio-reduction (c); FTIR spectrum of wheat straw before and after adsorption (d). | ||
FTIR analysis was applied to identify the possible adsorption mechanisms of V(V) (Fig. 2d). The absorption bands near 1736 and 1630 cm−1 corresponded to C![[double bond, length as m-dash]](https://www.rsc.org/images/entities/char_e001.gif) O for acetyl groups in hemicellulose and for aldehyde group in lignin, respectively.27 The peak at 1510 cm−1 was characterized as the C
O for acetyl groups in hemicellulose and for aldehyde group in lignin, respectively.27 The peak at 1510 cm−1 was characterized as the C![[double bond, length as m-dash]](https://www.rsc.org/images/entities/char_e001.gif) C stretching of the aromatic ring of lignin.28 The bands at 1000–1200 cm−1 indicated C–O–C stretching, C–O covalent bonds, and O–H bonds prevalent in cellulose, hemicellulose, and lignin.29 The relative intensities significantly changed after V(V) sorption, which indicated that the functional groups might be predominant functional groups for the removal of V(V).
C stretching of the aromatic ring of lignin.28 The bands at 1000–1200 cm−1 indicated C–O–C stretching, C–O covalent bonds, and O–H bonds prevalent in cellulose, hemicellulose, and lignin.29 The relative intensities significantly changed after V(V) sorption, which indicated that the functional groups might be predominant functional groups for the removal of V(V).
3.3 Changes in dissolved organic matter
Based on the fluorescence spectrum and PARAFAC modeling,30 the four fluorescence components in the water sample were analyzed (Fig. 3): C1 (Ex/Em = 340/440 nm) was identified as humic acid-like substances,31 and C2 (Ex/Em = 270/340 nm) was tryptophan.32 C3 and C4 (Ex/Em = 360 (270)/420 and Ex/Em = 375 (270)/485 nm) were also related to humic-like organics.33,34 According to the results observed at 0, 60 and 144 h (Fig. 4 and 5), humic acid-like substances (region V) decreased, whereas the proportion of soluble microbial products (region IV) increased in all of the V(V) removal systems. Tryptophan (region I) and tyrosine (region II) were correlated with protein-like substances, which showed a slight increase in proportion.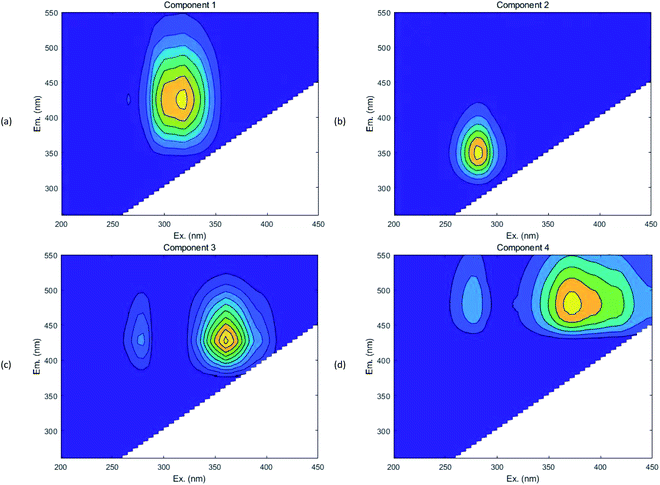 | ||
| Fig. 3 Fluorescent components identified by EEM-PARAFAC (component 1 (a); component 2 (b); component 3 (c); component 4 (d)). | ||
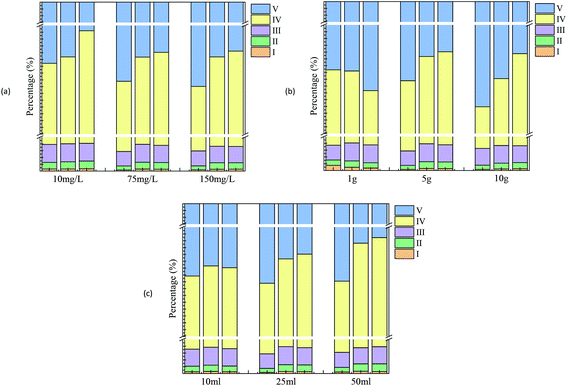 | ||
| Fig. 4 Characterization of dissolved organic matter by fluorescence regional integration with various initial V(V) concentrations (a); initial straw dosages (b); initial inocula amounts (c). | ||
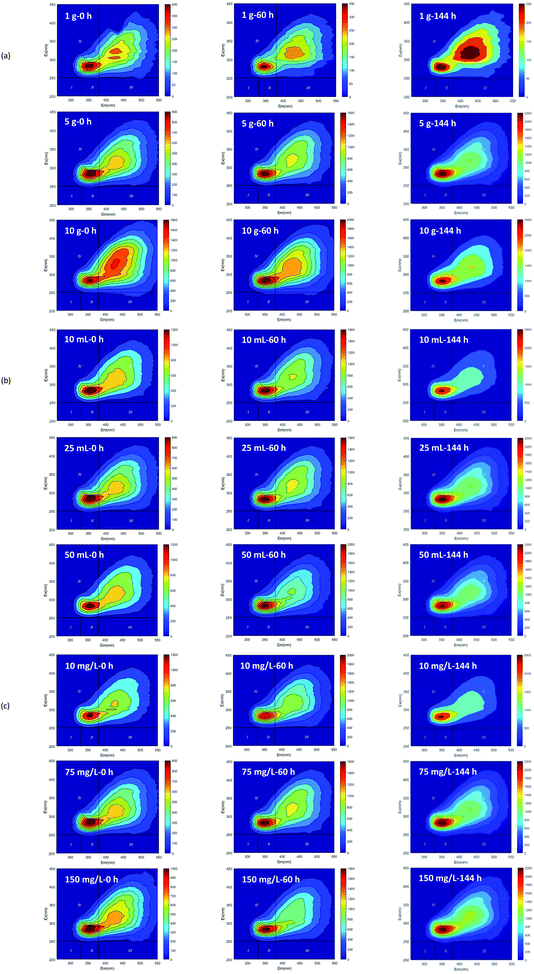 | ||
| Fig. 5 The fluorescence spectra of dissolved organic matters in V(V) reduction processes (initial straw dosage (a); initial inocula amount (b); initial V(V) concentration (c)). | ||
The experiment detected considerable humic acid-like substances, which might be converted by the hydrolyzates of wheat straw. In other studies, the carbon source released by banana peel was also considered as humic acid-like substances.35 Furthermore, lignocellulose was not completely hydrolyzed. It may be converted to some intermediate products that are still difficult to biodegrade, such as phenolics and polyphenols, which can then be polymerized to form humic substances.36,37 Notably, at the end of the experiment, the fluorescence intensity of the humus-like area with a high initial V(V) concentration (150 mg L−1) was higher than that of the humus-like area with low initial V(V) concentration (10 mg L−1), which was consistent with the change rule of DOM reported in the cadmium contaminated soil with added wheat straw.29
Since soluble microbial byproduct-like substances (region IV) also showed a relationship with cellular material and its secretions, the microbial activity could be represented by it.38 As a high concentration was capable of inhibiting bacterial activity,39 relatively less microbial metabolites were identified at a high concentration of V(V). The amount of initial inoculated sludge was correlated with the microbial biomass. Thus, with the increase in the amount of inoculated sludge at the end of the cycle, the proportion of microbial metabolites in the experimental group would be elevated. The proportion of microbial metabolites in the experimental group varied with different wheat straw dosages. For instance, the proportion of region IV in the reactor with 10 g added wheat straw was relatively higher than that with 1 g added, demonstrating that a higher rate of substrate utilization occurred with larger carbon source dosage. In this way, a strong microbial activity was achieved, which could be verified laterally by a high removal efficiency V(V).
3.4 Evolution of microbial communities
Microbial communities were analyzed for samples C (the original inoculated sludge), J (the control group without straw addition), A (the experimental groups with initial 75 mg L−1 V(V)) and H (the experimental groups with initial 10 mg L−1 V(V)). The coverages of all samples were higher than 99.79%, suggesting that these results could represent an almost overall microbial diversity and reflect the real situation of microbial communities. Compared with C and J, the samples added with straw (A and H) showed the declined abundance and biodiversity (Table 1). Straw, as effective solid carbon sources, seemed not so “friendly” for microbes to some extent as liquid ones. Compared to A, H had a more diverse microbial community reflected by the higher Shannon and lower Simpson indices, giving credit to lower inhibition of microbial activity by the low V(V) concentration.| Sample\estimators | Sobs | Shannon | Simpson | Ace | Chao | Coverage |
|---|---|---|---|---|---|---|
| C | 522 | 3.382121 | 0.103184 | 561.6939 | 557 | 0.998369 |
| J | 538 | 3.415746 | 0.111113 | 597.2981 | 598.6818 | 0.997903 |
| A | 214 | 1.741855 | 0.421638 | 417.8433 | 301.2564 | 0.998066 |
| H | 213 | 2.859821 | 0.096185 | 404.9982 | 297.4063 | 0.998275 |
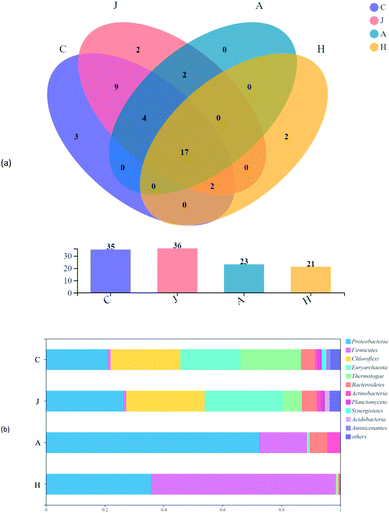
Evolutions of communities were observed in all samples on the phylum level (Fig. 6). There were a total of 17 phyla detected in all samples, accounting for 48.6%, 47.2%, 73.9%, and 81.0% of the total phyla in the C, J, A and H samples, respectively (Fig. 6a). V(V) may be one of the reasons for the shared phyla above, while the proportion of phyla showed greatly varied trends (Fig. 6b). Proteobacteria, Firmicutes, Chloroflexi, Thermotogota and Bacteroidota dominated the communities of samples, which were basically identical to the main phyla of microbes detected in the V(V)-contaminated soil.40 Proteobacteria was dominant in the A sample with the abundance of 72.6%. Although Proteobacteria was increased in the H samples, Firmicutes took the majority of abundance (62.8%) in the H sample, with only 1.1% in the inocula (C). The phyla abundance of Chloroflexi, Euryarchaeota and Thermotogae were shifted significantly in the A and H samples. Results revealed that the additional V(V) and straw had a vital impact on the development of microbial communities.
3.5 Identification of functional microbes
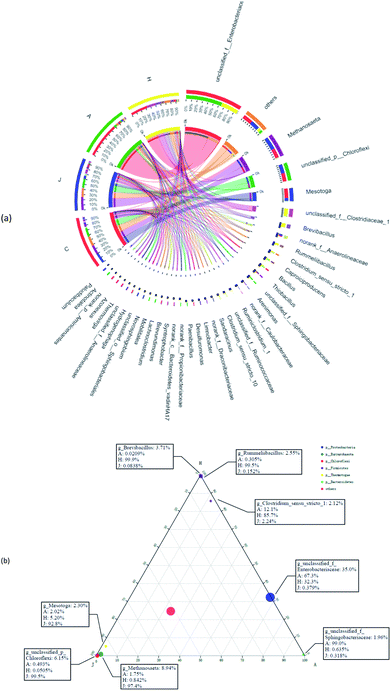
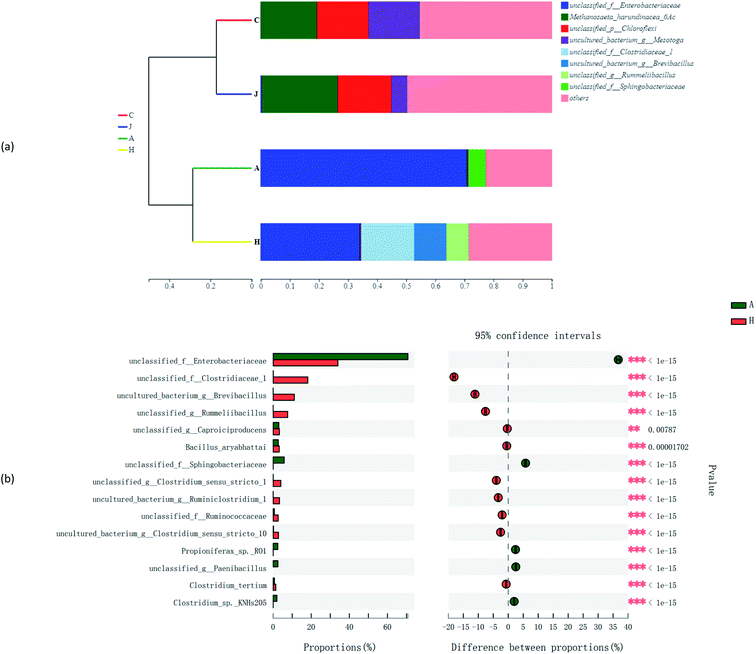
Fig. 7a suggests the various microbial communities in each group on the genus level. Functional bacteria might be involved in the cellulose degradation and microbial V(V) reduction in samples A and H. Unclassified_f_Enterobacteriaceae largely accounted for the communities of A and H at 70.7% and 34.0%, respectively. Enterobacteriaceae was reported to produce extracellular cellulolytic enzymes41 and degrade cellulose,42 which could also participate in the reduction of Cr(VI) and V(V).43 Enhanced Caproiciproducens (3.0% in A and 3.4% in H) and Bacillus (2.9% in A and 3.4% in H) were found in the study. Caproiciproducens could promote the degradation of cellulosic materials and significantly increased the total bioenergy yield.44 Bacillus thuringiensis was also enriched in a high-arsenic environment, and had potential to reduce arsenic.45 Moreover, low-content V(V) could promote the reproduction of Bacillus and Anaerolineaceae,46 and biologically reduce V(V) to V(IV).47 In addition, unclassified_f_Sphingobacteriaceae (5.8%) was significantly enriched in the community of the A sample with 75 mg L−1 V(V), which has shown resistance to multiple heavy metals.48 H samples showed more diversity; thus, more possible functional microbes were enhanced, such as unclassified_f_Clostridiaceae (18.2%), Brevibacillus (11.1%), Rummeliibacillus (7.6%), Clostridium_sensu_stricto_1 (5.4%), Ruminiclostridium_1 (3.6%), and unclassified_f_Ruminococcaceae (2.7%). Rummeliibacillus and Brevibacillus were reported as possible arsenic reducers.42 Clostridium_Sensu_Stricto_1 was also one of the dominant bacteria for Cr(VI) removal in the reactor,49 with Clostridium chromiireducens capable of anaerobic Cr(VI)-reduction.50 Ruminiclostridium and Ruminococcaceae were common as cellulose-degrading bacteria.51,52 Moreover, some microbes in the communities might support decreased V(V) reduction to some extent compared with C (inoculated sludge) and J (without straw). For example, Anaerolineaceae was reported to be able to lead the transformation of organic matter,35 which was also previously enriched in V(V)-containing biological systems.13 Furthermore, Thiobacillus could not only reduce nitrate,53 but also grow in the presence of V(V), and reduce V(V) into V(IV).54In Fig. 7b, the three corners represent three samples, circles represent microbes at the genus level, and the size of the circles represent the average relative abundance of genera. According to the ternary plot results, A and H harbored a high abundance of unclassified_f_Enterobacteriaceae. Genera of Brevibacillus and Rummeliibacillus were mostly associated with the H communities, whereas Sphingobacteriaceae was associated with microbial communities of sample A, which were associated with findings from the results in Fig. 7a.
In conclusion, these cellulose-degrading fermentation microbes mentioned above and V(V)-tolerant microorganisms could coexist in the biological V(V) removal system, with microbial V(V) reduction by the interaction. The results also suggested that diverse conditions could significantly affect the composition of the microbial community, with different V(V) reduction efficiencies accordingly. Thus, this study contributed to providing an alternative method for subsequent microbial remediation of V(V) in groundwater.
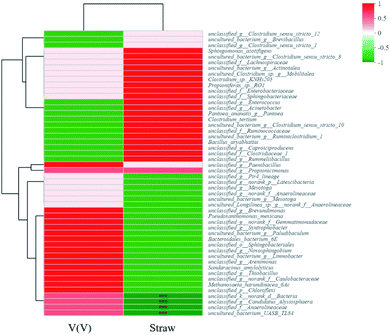
Other factors also structured the microbial community diversities, as shown in Fig. 8a and b. The species abundance of unclassified_f_Enterobacteriaceae and unclassified_f_Sphingobacteriaceae accounted for large proportions of communities of A. While for H, besides unclassified_f_Enterobacteriaceae, unclassified_f_Clostridiaceae_1, uncultured_bacterium_g_Brevibacillus and unclassified_g_Rummeliibacillus were also species with high abundances. The Spearman correlation heatmap (Fig. 9) showed that the correlation between the microbial species and factors were different. For example, unclassified_f_Enterobacteriaceae showed a significant positive correlation with the addition of straw, and it was reported to be able to degrade cellulose,42 as one of the important functional species in this study.
3.6 Microbial functional gene and enzyme characterization
Analyses with functional genes were summarized based on the PICRUSt 2 to indicate the microbial revolution (Fig. 10a). Genes involved in ABC transporters and two-component system in H were enriched compared to other samples in the study. ABC transporters could relieve toxicities of heavy metals by supporting cross membranes transportation.55,56 ABC transporters were also reported to be related to V(V) bio-reduction, particularly transporting vanadate into the cytoplasm for intracellular reduction as detoxification, with releasing of reduction products, and they were also associated with other metal bio-reduction processes.55,57 Compared with the A sample, the relative abundance of functional genes for the biosynthesis of amino acids and carbon metabolism was also enriched with lower concentration of 10 mg L−1 V(V).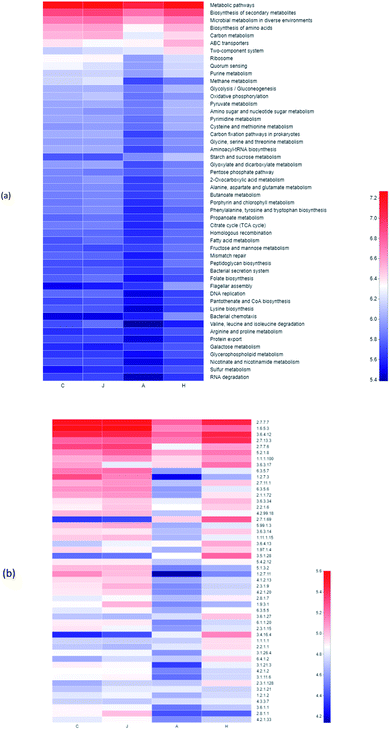 | ||
| Fig. 10 Heatmap of pathway level 3 (a) and enzyme (b) through the PICRUSt 2 analysis based on the KEGG database. | ||
Enrichments of enzyme in samples were also observed, which presumably contributed to the V(V) reduction (Fig. 10b). Enzymes of 2.7.1.69 (protein-N(pi)-phosphohistidine-sugar phosphotransferase), 3.5.1.28 (N-acetylmuramoyl-L-alanine amidase) and 3.4.16.4 (serine-type D-Ala-D-Ala carboxypeptidase) in H were enriched significantly compared with the other three samples. In addition, the abundances of 2.7.13.3 (histidine kinase) and 3.6.3.17 (monosaccharide-transporting ATPase) were enhanced during the V(V) processes (Fig. 10b).
Straw, as the only solid carbon source, served as an electron donor for heterotrophs to initiate V(V) reduction. A more detailed mechanism of V(V) reduction needs to be revealed with the use of new tools in the future. Furthermore, the presence of co-contaminants should be explored and considered more during bioprocessing. For practical applications of V(V) bioremediation, supplementation of an optimal solid carbon source as straw and others could be taken into consideration based on the results in this study to better avoid secondary pollution in aquifers.
4 Conclusions
Straw was feasible as a solid carbon source for bioremediating V(V) in polluted groundwater. The V(V) reduction efficiency was up to 88.2% with the initial 10 mg L−1 V(V), 5 g straw and precipitated sludge (25 mL) as inocula. Increasing the initial V(V) concentration resulted in lower V(V) removal efficiency, but demonstrated higher removal capacity during the whole bioprocesses. The removal efficiency of V(V) illustrated a positive correlation with the dosage of straw in an appropriate range. Dissolved organic matter (DOM) changes demonstrated that both amount of carbon source and initial concentration of V(V) likely affected the microbial activity, which was also simultaneously verified by the corresponding V(V) removal efficiency. V-resistant microorganisms like unclassified_f_Enterobacteriaceae were the predominant microbial species contributing to the V(V) reduction, and functional genes based on the PICRUSt 2 analysis indicated that ABC transporters played an important role in the bio-reduction of V(V). The relatively high V(V) removal efficiency means a possibility of the V bioremediation in groundwater.Conflicts of interest
There are no conflicts to declare.Acknowledgements
This research work was supported by the National Natural Science Foundation of China (NSFC: No. 51908021) and the Scientific Research Ability Improvement Program for Young Teachers of Beijing University of Civil Engineering and Architecture (X21017).References
- C. E. Fiorentino, J. D. Paoloni, M. E. Sequeira and P. Arosteguy, J. Contam. Hydrol., 2007, 93, 122–129 CrossRef CAS PubMed.
- C. Y. Lai, Q. Y. Dong, J. X. Chen, Q. S. Zhu, X. Yang, W. Da Chen, H. P. Zhao and L. Zhu, Environ. Sci. Technol., 2018, 52, 10680–10688 CrossRef CAS.
- C. T. A. Lee, A. D. Brandon and M. Norman, Geochim. Cosmochim. Acta, 2003, 67, 3045–3064 CrossRef CAS.
- K. Righter, S. R. Sutton, L. Danielson, K. Pando and M. Newville, Am. Mineral., 2016, 101, 1928–1942 CrossRef.
- D. Rehder, Org. Biomol. Chem., 2008, 6, 957–964 RSC.
- M. Inyang, B. Gao, Y. Yao, Y. Xue, A. R. Zimmerman, P. Pullammanappallil and X. Cao, Bioresour. Technol., 2012, 110, 50–56 CrossRef CAS.
- A. Ścibior, Ł. Pietrzyk, Z. Plewa and A. Skiba, J. Trace Elem. Med. Biol., 2020, 61, 126508 CrossRef.
- B. Gummow, C. J. Botha, J. P. T. M. Noordhuizen and J. A. P. Heesterbeek, Prev. Vet. Med., 2005, 72, 281–290 CrossRef CAS PubMed.
- L. Jia, E. J. Anthony and J. P. Charland, Energy Fuels, 2002, 16, 397–403 CrossRef CAS.
- L. Zhong, Y. Huang, S. Ni, H. Lu and L. Zaidong, Comput. Tech. Geophys. Geochem. Explor., 2019, 53, 1689–1699 Search PubMed.
- R. Meng, T. Chen, Y. Zhang, W. Lu, Y. Liu, T. Lu, Y. Liu and H. Wang, RSC Adv., 2018, 8, 21480–21494 RSC.
- L. Hao, B. Zhang, C. Feng, Z. Zhang, Z. Lei, K. Shimizu, X. Cao, H. Liu and H. Liu, Chemosphere, 2018, 202, 272–279 CrossRef CAS PubMed.
- L. Hao, Y. Liu, N. Chen, X. Hao, B. Zhang and C. Feng, Sci. Total Environ., 2021, 751, 142161 CrossRef CAS.
- L. Hao, B. Zhang, C. Tian, Y. Liu, C. Shi, M. Cheng and C. Feng, J. Power Sources, 2015, 287, 43–49 CrossRef CAS.
- M. Li, B. Zhang, S. Zou, Q. Liu and M. Yang, J. Hazard. Mater., 2020, 384, 121386 CrossRef CAS PubMed.
- J. Shi, B. Zhang, Y. Cheng and K. Peng, Water Res., 2020, 186, 116354 CrossRef CAS PubMed.
- B. Zhang, R. Qiu, L. Lu, X. Chen, C. He, J. Lu and Z. J. Ren, Environ. Sci. Technol., 2018, 52, 7434–7442 CrossRef CAS PubMed.
- L. Hao, B. Zhang, C. Feng, Z. Zhang, Z. Lei and K. Shimizu, Chemosphere, 2021, 263, 128246 CrossRef CAS PubMed.
- B. Zhang, L. Hao, C. Tian, S. Yuan, C. Feng, J. Ni and A. G. L. Borthwick, Bioresour. Technol., 2015, 192, 410–417 CrossRef CAS PubMed.
- J. Li, X. Hao, M. C. M. van Loosdrecht and R. Liu, Water Res., 2021, 188, 116541 CrossRef CAS.
- X. S. He, B. D. Xi, X. Li, H. W. Pan, D. An, S. G. Bai, D. Li and D. Y. Cui, Chemosphere, 2013, 93, 2208–2215 CrossRef CAS PubMed.
- Y. Jiang, B. Zhang, C. He, J. Shi, A. G. L. Borthwick and X. Huang, Water Res., 2018, 141, 289–296 CrossRef CAS.
- I. Kamika and M. N. B. Momba, Water, Air, Soil Pollut., 2012, 223, 2525–2539 CrossRef CAS.
- B. Zhang, Y. Cheng, J. Shi, X. Xing, Y. Zhu, N. Xu, J. Xia and A. G. L. L. Borthwick, Chem. Eng. J., 2019, 375, 121965 CrossRef CAS.
- L. Hao, B. Zhang, M. Cheng and C. Feng, Bioresour. Technol., 2016, 201, 105–110 CrossRef CAS PubMed.
- S. Freguia, K. Rabaey, Z. Yuan and J. Keller, Environ. Sci. Technol., 2008, 42, 7937–7943 CrossRef CAS.
- S. F. M. Ramle, O. Sulaiman, R. Hashim, T. Arai, A. Kosugi, H. abe, Y. Murata and Y. Mori, Lignocellulose, 2012, 1, 33–44 Search PubMed.
- F. Lionetto, R. Del Sole, D. Cannoletta, G. Vasapollo and A. Maffezzoli, Materials, 2012, 5, 1910–1922 CrossRef CAS.
- M. O. Kazeem, U. K. Md Shah, A. S. Baharuddin and N. A. A. Rahman, BioResources, 2017, 12, 6207–6236 CrossRef CAS.
- C. A. Stedmon and R. Bro, Limnol. Oceanogr.: Methods, 2008, 6, 572–579 CrossRef CAS.
- G. P. Sheng and H. Q. Yu, Water Res., 2006, 40, 1233–1239 CrossRef CAS PubMed.
- J. Gao, J. Lv, H. Wu, Y. Dai and M. Nasir, Chemosphere, 2018, 193, 1027–1035 CrossRef CAS PubMed.
- Y. Wang, X. Zhang, X. Zhang, Q. Meng, F. Gao and Y. Zhang, Chemosphere, 2017, 180, 531–539 CrossRef CAS.
- Y. Yuan, B. Xi, X. He, W. Tan, R. Gao, H. Zhang, C. Yang, X. Zhao, C. Huang and D. Li, J. Hazard. Mater., 2017, 339, 378–384 CrossRef CAS PubMed.
- H. Wang, N. Chen, C. Feng, Y. Deng and Y. Gao, Chemosphere, 2020, 253, 126693 CrossRef CAS PubMed.
- X. S. He, B. D. Xi, D. Y. Cui, Y. Liu, W. Bin Tan, H. W. Pan and D. Li, J. Hazard. Mater., 2014, 268, 256–263 CrossRef CAS.
- B. C. Qi, C. Aldrich and L. Lorenzen, Chem. Eng. J., 2004, 98, 153–163 CrossRef CAS.
- J. Bridgeman, A. Baker, C. Carliell-Marquet and E. Carstea, Environ. Technol., 2013, 34, 3069–3077 CrossRef CAS.
- A. P. Yelton, K. H. Williams, J. Fournelle, K. C. Wrighton, K. M. Handley and J. F. Banfield, Environ. Sci. Technol., 2013, 47, 6500–6509 CrossRef CAS.
- H. Zhang, B. Zhang, S. Wang, J. Chen, B. Jiang and Y. Xing, Environ. Pollut., 2020, 265, 114782 CrossRef CAS PubMed.
- P. R. Waghmare, S. M. Patil, S. L. Jadhav, B. H. Jeon and S. P. Govindwar, Agriculture and Natural Resources, 2018, 52, 399–406 CrossRef.
- H. Rantanen, L. Virkki, P. Tuomainen, M. Kabel, H. Schols and M. Tenkanen, Carbohydr. Polym., 2007, 68, 350–359 CrossRef CAS.
- K. Komori, P. c. Wang, K. Toda and H. Ohtake, Appl. Microbiol. Biotechnol., 1989, 31, 567–570 CrossRef CAS.
- Y. Qin, L. Li, J. Wu, B. Xiao, T. Hojo, K. Kubota, J. Cheng and Y. Y. Li, Bioresour. Technol., 2019, 276, 325–334 CrossRef CAS.
- B. A. Tantry, D. Shrivastava, I. Taher and M. Tantry, J. Appl. Environ. Microbiol., 2015, 3, 101–105 CAS.
- A. Rivas-Castillo, D. Orona-Tamayo, M. Gómez-Ramírez and N. G. Rojas-Avelizapa, Biotechnol. Bioprocess Eng., 2017, 22, 296–307 CrossRef CAS.
- B. Zhang, S. Wang, M. Diao, J. Fu, M. Xie, J. Shi, Z. Liu, Y. Jiang, X. Cao and A. G. L. Borthwick, J. Geophys. Res.: Biogeosci., 2019, 124, 601–615 CrossRef CAS.
- X. Fan, J. Tang, L. Nie, J. Huang and G. Wang, Stand. Genomic Sci., 2018, 13, 1–8 CrossRef PubMed.
- M. Aoki, T. Kowada, Y. Hirakata, T. Watari and T. Yamaguchi, J. Environ. Sci. Health, Part A: Toxic/Hazard. Subst. Environ. Eng., 2020, 55, 1589–1595 CrossRef CAS.
- K. S. Inglett, H. S. Bae, H. C. Aldrich, K. Hatfield and A. V. Ogram, Int. J. Syst. Evol. Microbiol., 2011, 61, 2626–2631 CrossRef CAS PubMed.
- F. P. Camargo, I. K. Sakamoto, I. C. S. Duarte and M. B. A. Varesche, Int. J. Hydrogen Energy, 2019, 44, 22888–22903 CrossRef CAS.
- C. Chassard, E. Delmas, C. Robert, P. A. Lawson and A. Bernalier-Donadille, Int. J. Syst. Evol. Microbiol., 2011, 62, 138–143 CrossRef.
- N. Pous, C. Koch, J. Colprim, S. Puig and F. Harnisch, Electrochem. Commun., 2014, 49, 93–97 CrossRef CAS.
- L. Briand, H. Thomas and E. Donati, Biotechnol. Lett., 1996, 18, 505–508 CrossRef CAS.
- C. Y. Lai, L. L. Wen, L. D. Shi, K. K. Zhao, Y. Q. Wang, X. Yang, B. E. Rittmann, C. Zhou, Y. Tang, P. Zheng and H. P. Zhao, Environ. Sci. Technol., 2016, 50, 10179–10186 CrossRef CAS PubMed.
- B. Zhang, Y. Jiang, K. Zuo, C. He, Y. Dai and Z. J. Ren, J. Hazard. Mater., 2020, 382, 121228 CrossRef CAS.
- L. Li, B. Zhang, C. He and H. Zhang, Sci. Total Environ., 2021, 768, 145331 CrossRef CAS PubMed.
| This journal is © The Royal Society of Chemistry 2021 |

