 Open Access Article
Creative Commons Attribution 3.0 Unported Licence
A nanoprecursor method for successfully synthesizing clinoptilolite with high-crystallinity and resultant effects on CO2/CH4 selective adsorption†
Chengwei Zhai,
Jihong Sun *,
Bingying Jia,
Anadil Gul and
Shiyang Bai
Beijing Key Laboratory for Green Catalysis and Separation, Department of Environmental and Chemical Engineering, Beijing University of Technology, Beijing, 100124, China. E-mail: jhsun@bjut.edu.cn
First published on 15th September 2021
Abstract
Nanoprecursors used as a structural promoter (SP) were prepared by a hydrothermal method and named sol-SP. After centrifugation, the supernatant and precipitate were denoted as solution-SP and solid-SP, respectively. The effect of the additive amount on the structures and properties of the synthesized clinoptilolite was investigated using various characterization techniques. The activation energies of crystallization kinetics during induction and growth periods were calculated. The results showed that the induction period is the control step during the synthesis of clinoptilolite, while additive sol-SP or solid-SP was beneficial to shorten the induction period and therefore enhance the formation of the crystal nucleus. When their pre-crystallization time was too long or the additive amount was too much, the impure phase (phillipsite) in the synthesized clinoptilolite was easily generated. Although the addition of solution-SP had no obvious effect on the induction period, it promoted the growth of crystals after nucleation. Finally, the adsorption performances for CO2 and CH4 were preliminarily assessed using synthetic clinoptilolite as the adsorbent, showing the promising application for the separation of CO2/CH4.
1 Introduction
Clinoptilolite (CP) with heulandite (HEU) structure feature is one of the widely distributed zeolite minerals in nature. Because of its large specific surface area, good ion exchange capability, uniform pore diameter, good adsorption property, low cost, and other characteristics, it is commonly used for gas adsorption and separation.1 Particularly, the selective performances and adsorption capacities of mixture gas largely depend on the type, number, and the position of the equilibrium cations in its HEU skeletons.2,3 Frankiewicz et al.4 reported that various cations in the presence of HEU skeletons and their distributions would affect the adsorption/separation of CH4/N2 and their kinetic performances. Earlier, Chao5 found that Mg-CPs could definitely improve the separation performance of CH4/N2 or CH4/CO mixture gases. In 2001, Aguilar-Armenta et al.6 investigated the adsorption rates of pure CO2, O2, N2, and CH4 using various cation-exchanged (Ca2+, K+, and Na+) CPs as adsorbents, and further demonstrated that cation-exchanged CPs could be used for the separation of N2/O2, N2/CH4, and CO2/CH4 mixtures. Thereafter, Kouvelos et al.7 conducted detailed exploration on monovalent ion-exchanged CPs, such as Na+ and Li+, and their high adsorption capacity and denitrification selectivity further proved them to be promising adsorbents in dynamic pressure swing adsorption separation of CH4/N2.However, natural CP usually contains a large number of impurities and miscellaneous phases, easily leading to micropore blockage, and therefore greatly limiting its applications. In this regard, how to synthesize high purity CP is currently one of the main topics.8 In 1963, Ames9 reported the synthesis of CPs via a hydrothermal route at a temperature of 250–300 °C for 2–5 days. Then, Goto10 used (Na, K)Al2Si7O18 as a raw material to obtain CP at 200 °C for 25 days in a weak alkaline solution at pH 7.9, but, a large number of associated phases such as mordenite were also formed. Although Satokawa and Itabashi11 synthesized Na-and K-CPs by crystallization for 6 days at 150 °C using the reactant system of 1.65 K2O![[thin space (1/6-em)]](https://www.rsc.org/images/entities/char_2009.gif) :
:![[thin space (1/6-em)]](https://www.rsc.org/images/entities/char_2009.gif) 1.65 Na2O
1.65 Na2O![[thin space (1/6-em)]](https://www.rsc.org/images/entities/char_2009.gif) :
:![[thin space (1/6-em)]](https://www.rsc.org/images/entities/char_2009.gif) Al2O3
Al2O3![[thin space (1/6-em)]](https://www.rsc.org/images/entities/char_2009.gif) :
:![[thin space (1/6-em)]](https://www.rsc.org/images/entities/char_2009.gif) 11 SiO2
11 SiO2![[thin space (1/6-em)]](https://www.rsc.org/images/entities/char_2009.gif) :
:![[thin space (1/6-em)]](https://www.rsc.org/images/entities/char_2009.gif) 275 H2O, high reaction temperature, and long crystallization time are not conducive for industrial production. Chi and Sand12 firstly used the “seed” method using natural CP as seeds (an additive amount of 1–10 wt%) to synthesis Na (K)-CPs with a relatively short crystallization time of 27–300 h at 120–195 °C. Subsequently, Zhao et al.13 studied the effect of various parameters such as alkali metals, silica–aluminum ratio, and alkalinity on the structure and texture properties of synthesized CPs. The results showed that Li-, Na-, K-, Rb-CPs can be successfully synthesized via a seed method, in which, the presence of potassium ions is beneficial to reduce the crystallization time. Williams et al.14 and Yuan et al.15 further elucidated the reproducible work of Chi and Sand's method,12 and found that it was still difficult to obtain highly pure CPs under laboratory conditions. Although the seed method actually expanded the range of starting compositions for the successful synthesis of CPs, the higher crystallization temperature, longer crystallization time, and lower crystallinity still could not satisfy the scale-up industries. Recently, Ouyang et al.16,17 proposed a structural promoter (SP) method to successfully synthesize highly pure CPs, which is a big difference from not only traditional structural directed agent but also the above-mentioned seed method.
275 H2O, high reaction temperature, and long crystallization time are not conducive for industrial production. Chi and Sand12 firstly used the “seed” method using natural CP as seeds (an additive amount of 1–10 wt%) to synthesis Na (K)-CPs with a relatively short crystallization time of 27–300 h at 120–195 °C. Subsequently, Zhao et al.13 studied the effect of various parameters such as alkali metals, silica–aluminum ratio, and alkalinity on the structure and texture properties of synthesized CPs. The results showed that Li-, Na-, K-, Rb-CPs can be successfully synthesized via a seed method, in which, the presence of potassium ions is beneficial to reduce the crystallization time. Williams et al.14 and Yuan et al.15 further elucidated the reproducible work of Chi and Sand's method,12 and found that it was still difficult to obtain highly pure CPs under laboratory conditions. Although the seed method actually expanded the range of starting compositions for the successful synthesis of CPs, the higher crystallization temperature, longer crystallization time, and lower crystallinity still could not satisfy the scale-up industries. Recently, Ouyang et al.16,17 proposed a structural promoter (SP) method to successfully synthesize highly pure CPs, which is a big difference from not only traditional structural directed agent but also the above-mentioned seed method.
On the basis of previous results and our preliminary work, the nanoprecursors including sol-SP, solid-SP, and solution-SP were synthesized via a hydrothermal route. The objective of this work is to explore the crystallization process of sol-SP particles and the effect of their additive amounts in the hydrothermal system on the structures and properties of synthetic CPs. Meanwhile, activation energies of crystallization kinetics of the CPs synthesized using additives consisting of various SPs were calculated during induction and growth periods, and therefore the promotion mechanism was put forward. The influences of various pre-crystallization times on the microstructure of the aluminosilicate sol and its morphology were emphasized, in which, the structural evolution over pre-crystallization time was explored using X-ray diffraction (XRD) patterns, nuclear magnetic resonance (NMR) spectra, Fourier transform infrared (FT-IR) and ultraviolet-visible (UV)-Raman spectra, scanning electron microscopic (SEM) images, thermogravimetric-differential scanning calorimetry (TG-DSC) analysis, and inductively coupled plasma (ICP). Subsequently, effects of pre-crystallization time and additive amounts on the obtained nanoprecursors were investigated in the hydrothermal system, the values of apparent activation energy of the induction period (En) and growth procedure (Eg) were calculated. Finally, the various synthetic CPs were used as adsorbents, their adsorption kinetics of CO2/CH4 and separation performances were preliminarily explored. These results showed that three kinds of SPs (sol-SP, solid-SP, and solution-SP) presented different mechanisms to promote the synthesis of CPs. The adsorption capacity and selectivity of CH4 and CO2 were evaluated, showing that the synthesized CPs had high adsorption capacity and CO2/CH4 separation ability. Different SPs did not affect the adsorption capacity of CPs, which initially indicated that it could be used as an efficient CO2/CH4 separation agent.
2 Experimental
2.1 Materials
As a silica source, an aqueous colloidal silica sol (Ludox JN-30, 30 wt% SiO2) with an average particle size of 10–20 nm and density of 1.2 g cm−3 supplied by Qingdao Ocean Chemical Plant was used. As an alumina source, Al(OH)3 (99.5 wt%) provided by Tianjin Fuchen chemical reagents factor was used. KOH (82.0 wt%) and NaOH (96.0 wt%) were purchased from Beijing Chemical Works. All the chemicals were of analytical reagent grade. The resistivity of the deionized water was 18.25 MΩ cm at 25 °C.2.2 SPs preparation
According to our previous report,16 NaOH, KOH, Al(OH)3, and deionized water were placed in a 50 mL Teflon-lined beaker and stirred at 150 °C for 3 h until a transparent meta-aluminate solution (Na/K = 1) was obtained. Deionized water and silica sol were then added to the above prepared alkali metal–aluminate solution (Si/Al = 5.85, (Na + K)/Si = 0.48, H2O/SiO2 = 32.91). After stirring at room temperature for 2 h, the gel was transferred to a stainless-steel autoclave with polytetrafluoroethylene liners and kept at 150 °C for 6–102 h in the oven. Finally, the autoclave was taken out and cooled. The sol-SP was obtained and then partially centrifuged, in which, supernatant and precipitate were named as solution-SP and solid-SP, respectively.2.3 Synthesis of CPs
NaOH, KOH, Al(OH)3, and deionized water were mixed in a 50 mL Teflon-lined beaker and stirred at 150 °C until it became a clear aluminate solution. Then, the remaining deionized water, silica sol, and sol-SP (or solution-SP, or solid-SP) with a designated amount were added to the above aluminate solution slowly, which was continuously stirred for 2 h at room temperature. After that, the prepared mixture was put into a Teflon-lined stainless-steel autoclave and further crystallized at 140–180 °C for 6–144 h. Finally, the autoclave was taken out and cooled, then by filtration and washing, the synthesized CPs were obtained.It should be noted that the mass fraction of the added sol-SP (or solution-SP, or solid-SP) was approximately 1–18% of the synthesized mixture mass (excluding the mass of the sol-SP (or solution-SP, or solid-SP) required to be added). While the starting molar ratios of Na2O![[thin space (1/6-em)]](https://www.rsc.org/images/entities/char_2009.gif) :
:![[thin space (1/6-em)]](https://www.rsc.org/images/entities/char_2009.gif) K2O
K2O![[thin space (1/6-em)]](https://www.rsc.org/images/entities/char_2009.gif) :
:![[thin space (1/6-em)]](https://www.rsc.org/images/entities/char_2009.gif) SiO2
SiO2![[thin space (1/6-em)]](https://www.rsc.org/images/entities/char_2009.gif) :
:![[thin space (1/6-em)]](https://www.rsc.org/images/entities/char_2009.gif) Al2O3
Al2O3![[thin space (1/6-em)]](https://www.rsc.org/images/entities/char_2009.gif) :
:![[thin space (1/6-em)]](https://www.rsc.org/images/entities/char_2009.gif) H2O were equal to 1.39
H2O were equal to 1.39![[thin space (1/6-em)]](https://www.rsc.org/images/entities/char_2009.gif) :
:![[thin space (1/6-em)]](https://www.rsc.org/images/entities/char_2009.gif) 1.39
1.39![[thin space (1/6-em)]](https://www.rsc.org/images/entities/char_2009.gif) :
:![[thin space (1/6-em)]](https://www.rsc.org/images/entities/char_2009.gif) 11.70
11.70![[thin space (1/6-em)]](https://www.rsc.org/images/entities/char_2009.gif) :
:![[thin space (1/6-em)]](https://www.rsc.org/images/entities/char_2009.gif) 1: 385 in synthesized mixtures. The mass of each component of each sample in the starting synthesis system was collected in Table S1 of the ESI† section.
1: 385 in synthesized mixtures. The mass of each component of each sample in the starting synthesis system was collected in Table S1 of the ESI† section.
2.4 CO2/CH4 adsorption
First, 0.15 g of the above CPs were heated at 120 °C for 6 h in a vacuum to remove water and gases. Subsequently, CH4 or CO2 adsorption isotherms on each sample were measured at 0 or 25 °C with the retention pressure equal to the saturated vapor pressure of CO2 or CH4.2.5 Characterizations
Crystal phases of the synthesized samples were determined using XD-6 (Beijing Purkinje General Instrument Co. Ltd) X-ray diffractometer with Cu Kα as the radiation source at 4°·min−1 and tested at 2θ range of 5–50°. The SEM instrument (JEOLJEM-220) operating at 15.0 kV was used to observe the morphology and structure of the synthesized samples. A 10 mg of sample was used during TG-DSC analysis on PerkinElmer Pyris I in the temperature range of 25–900 °C in the air atmosphere. The heating rate was 10 °C min−1 and the flow rate was 20 mL min−1. The FT-IR spectrum of the sample in the wavenumber range of 400–2000 cm−1 was recorded using an IR Prestige-21 FT-IR spectrophotometer. The elemental composition (Na+, K+, Si4+, and Al3+) and percentage of samples were determined using an ICP analyzer (Optima DV 2000), before analysis, the samples were dissolved in hydrofluoric acid (2.5%). The UV-Raman spectra of samples were measured in the wavenumber range of 200–1200 cm−1 using a Raman spectrometer (Lab Ram HR Evolution) with a laser source wavelength of 325 nm. The 29Si-NMR analysis was performed on an Agilent 600M solid-state nuclear magnetic resonance spectrometer with a resonance frequency of 99 MHz and MAS of 12 kHz, using TSP as the internal standard. Adsorption of CH4 or CO2 and adsorption–desorption isotherms of N2 was determined using JWGB jw-bk300 provided by Beijing Sci. & Tech. Co. Ltd. All samples were degassed for 6 h at a high vacuum of 120 °C, followed by measuring N2 adsorption–desorption isotherms at −196 °C. The Horvath–Kawazoe (HK) model was used to calculate micropore size distribution based on the desorption branch of isotherm.18 The micropore volumes of the synthesized CPs were calculated on the basis of the HK model using desorption data (relative pressure (P/P0) ≤ 0.20) of the N2 adsorption–desorption isotherms. While their inter-particle mesoporous volumes were calculated on the basis of the Barrett–Joyner–Halenda model via desorption data (0.20 ≤ P/P0 ≤ 0.99) of the N2 adsorption–desorption isotherms. Therefore, the total pore volumes of the synthesized CPs were equal to the sum of their micropore volume and the inter-particle mesopore volume.3 Results and discussion
3.1 Structural characterization
Fig. 1A presents XRD patterns of sol-SP with different pre-crystallization times of 6, 60, and 102 h, respectively. As can be seen in Fig. 1A-a and -b, the samples with the pre-crystallization time of 6 and 60 h revealed diffuse peaks at 2θ of 10–40°, indicating the existence of amorphous phases. However, the characteristic peaks of CP, such as 9.9° (020), 11.2° (200), and 22.3° (131), appeared in the sol-SP that was pre-crystallized for 102 h (Fig. 1A-c), which can be used as an efficient “seeds” preliminarily.16 Correspondingly, Fig. 1B-a and -b show SEM micrographs, which revealed that the amorphous particles of sol-SP increased in size from 100 to 300 nm with the extension of pre-crystallization time of 6–60 h. While, the obvious CP particles with sheet stacked structures were obtained from sol-SP after crystallization for 102 h (Fig. 1B–c).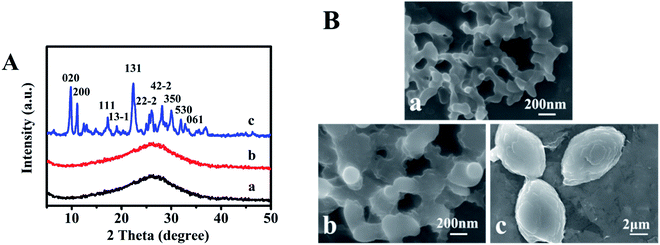 | ||
| Fig. 1 XRD patterns (A) and SEM images (B) of the obtained sol-SP with pre-crystallization time periods. (a) 6, (b) 60, and (c) 102 h. | ||
The sol-SP was further investigated by UV-Raman spectroscopy as shown from the data in Fig. 2A. As can be seen, Raman bands at 486 and 779 cm−1 could be assigned to monomeric silicate, the band at 600 and 1025 cm−1 was attributed to the oligomeric silicate species and another band at 1079 cm−1 belonged to double 4-membered rings.19 Therefore, the spectra of sol-SP with the pre-crystallization time interval of around 6 h (Fig. 2A-a) and 60 h (Fig. 2A-b) had the almost same composition, indicating the existence of main monomer and oligomeric silicate species. It can be speculated that these components of the initial crystallization may be composed of primary and secondary structural units of aluminosilicate. Correspondingly, FT-IR spectra also proved these observations (as shown in Fig. 2D). The peak at 1638 cm−1 was assigned to the deformation and vibration of H2O molecule,20 the bands at 1032 and 1202 cm−1 were attributed to the tetrahedral interior T–O–T (T = Si and Al) asymmetric stretching vibrations. While the others at 435 and 601 cm−1 were ascribed to the tetrahedron internal bending vibration of T–O and the external tetrahedron double loop.21
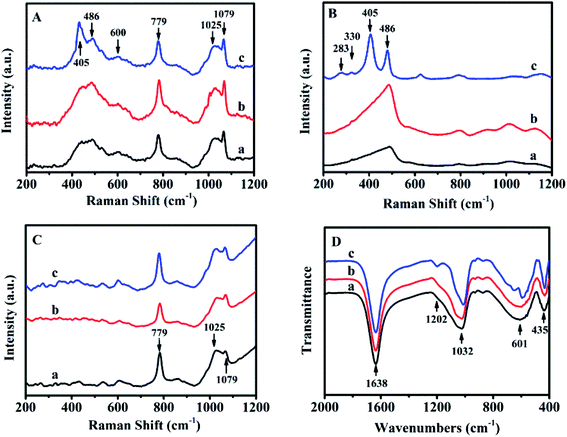 | ||
| Fig. 2 UV-Raman spectra of sol-SP (A), solid-SP (B), solution-SP (C) and FT-IR spectra of sol-SP (D) with pre-crystallization time periods. (a) 6, (b) 60, and (c) 102 h. | ||
Fig. 2B shows the UV-Raman spectrum of solid-SP, which revealed that the strongest band at 486 cm−1 was due to the banding mode of the characteristic monomeric silicate,19 the bands at 283 and 330 cm−1 were corresponding to the banding mode of 8-membered rings (8R) and 6-membered rings (6R).22 While, the band at 405 cm−1 was assigned to the vibration of Si–O–Al in the framework of CP.23 However, the bands in the Raman spectra of solution-SP (Fig. 2C) were different from those of solid-SP (Fig. 2C). The strongest band at 779 cm−1 was attributed to the characteristic monomeric silicate, the band at 1025 cm−1 was assigned to the banding mode of the oligomeric silicate species, while the band at 1079 cm−1 belonged to the double 4-membered rings.19
These demonstrations suggest that the HEU structure may be formed in solid-SP, while the ring structure appeared in solution-SP, which could also be confirmed via FT-IR spectra. For example, in Fig. S1-A of the ESI section,† FT-IR spectra of the solid-SP mainly revealed bands at 1060, 1205 cm−1 (tetrahedral interior T–O–T (T = Si and Al) asymmetric stretching vibration), 449 cm−1 (tetrahedron internal bending vibration of T–O), and 606 cm−1 (external tetrahedron double loop).21 While, Fig. S1-B† indicated that FT-IR spectra of the solution-SP showed the bands at 1638 (deformation and vibration of H2O molecule),20 1032 (tetrahedral interior T–O–T (T = Si and Al) asymmetric stretching vibration), and 601 cm−1 (external tetrahedron double loop).21
Fig. 3 illustrates 29Si-NMR profiles of solid-SP obtained at the pre-crystallization time of 6, 60, and 102 h, respectively. As can be seen, the broad resonances centered at −87, −95, −101, −106 and −114 ppm were characteristic of Si(4Al), Si(3Al), Si(2Al), Si(1Al) and Si(0Al) silicon environments. In the early stages of the crystallization of 6 h (Fig. 3a), the solid-SP structures were mainly Si(0Al) species, which may be due to the rapid combination of aluminate and silicate. These particles are highly chemically active, and thereafter are beneficial to promote the nucleation of aluminosilicate. With the extension of the pre-crystallization time up to 60 h (Fig. 3b), Si(0Al) is gradually transformed into Si(3Al) and Si(2Al). Subsequently, more silicates were embedded in the aluminosilicate networks and emerge the appearances of Si(1Al) mostly.24,25
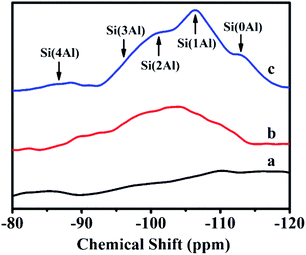 | ||
| Fig. 3 29Si-NMR spectra of solid-SP with pre-crystallization time periods. (a) 6, (b) 60, and (c) 102 h. | ||
In addition, the calculated Si/Al ratios (as shown in eqn (1) (ref. 26)) of solid-SPs increased with the prolongation of pre-crystallization time, showing 2.44 (6 h), 3.23 (60 h) and 4.84 (102 h), respectively, which was almost consistent with the reported literature.27
 | (1) |
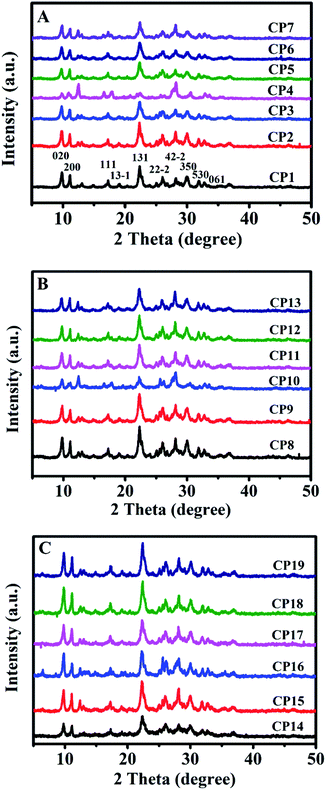
Table 1 summarizes the various synthetic parameters of CPs and corresponding their phase compositions. Fig. 4A shows the XRD patterns of CPs synthesized with and without sol-SP. As can be seen in Fig. 4A, -CP1, -CP2, and -CP3, typical diffractive peaks of CP, such as (020), (200), (111), (13−1), (131), (22−2), (42−2), (350), (530) and (061),28 appeared in the synthesized samples without additive sol-SP or with the addition of pre-crystallization sol-SP for 6 and 60 h. However, as the pre-crystallization time of the sol-SP was extended to 102 h, a large number of coexisting phases, such as phillipsite and mordenite, appeared in the final products. In addition, Fig. 4A, CP3, -CP5, -CP6, and -CP7 indicated that the coexisting phases of phillipsite were more obvious with the increased additive amount of sol-SP.
| Sample | Pre-crystallization time (h) | The additive amount of various SPa (wt%) | Crystallization time (h) | Product phase | SBETb | PVc | MPSd | ||
|---|---|---|---|---|---|---|---|---|---|
| sol-SP | Solid-SP | Solution-SP | |||||||
| a The mass and composition of the synthetic SPs were the same as described in section 2.2.b BET surface area (m2 g−1).c Total pore volume (cm3 g−1).d Mean micropore size (nm). | |||||||||
| CP1 | — | 0 | 144 | cp | 50.1 | 0.13 | 0.81 | ||
| CP2 | 6 | 3 | 96 | cp | — | — | — | ||
| CP3 | 60 | 3 | 84 | cp | 54.4 | 0.12 | 0.82 | ||
| CP4 | 102 | 3 | 48 | cp + phillipsite | 23.8 | 0.06 | 0.92 | ||
| CP5 | 60 | 6 | 78 | cp + phillipsite | — | — | — | ||
| CP6 | 60 | 9 | 78 | cp + phillipsite | — | — | — | ||
| CP7 | 60 | 18 | 66 | cp + phillipsite | 39.4 | 0.10 | 0.92 | ||
| CP8 | 6 | 3 | 96 | cp | — | — | — | ||
| CP9 | 60 | 3 | 84 | cp | 42.5 | 0.15 | 0.88 | ||
| CP10 | 102 | 3 | 48 | cp + phillipsite | 23.9 | 0.07 | 0.95 | ||
| CP11 | 60 | 6 | 78 | cp + phillipsite | — | — | — | ||
| CP12 | 60 | 9 | 78 | cp + phillipsite | — | — | — | ||
| CP13 | 60 | 18 | 66 | cp + phillipsite | 38.5 | 0.10 | 0.83 | ||
| CP14 | 6 | 3 | 108 | cp | — | — | — | ||
| CP15 | 60 | 3 | 108 | cp | 44.3 | 0.13 | 0.92 | ||
| CP16 | 102 | 3 | 108 | cp | 41.3 | 0.12 | 0.96 | ||
| CP17 | 60 | 6 | 108 | cp | — | — | — | ||
| CP18 | 60 | 9 | 108 | cp | — | — | — | ||
| CP19 | 60 | 18 | 108 | cp | 39.2 | 0.12 | 0.93 | ||
Similarly, as can be seen in Fig. 4B, XRD patterns suggested that the results obtained using the additive solid-SP were basically consistent with the same phenomena as that of the additive sol-SP (Fig. 4A). When the pre-crystallization time or the additive amount was increased, the occurrences of the impurity and other phases happened in the final products. However, different observations appeared for additive solution-SP, as shown in Fig. 4C, CP14, -CP15, and -CP16, the characteristic peaks of the synthesized samples gradually increased in intensity and no impurity phases appeared with the increase of the pre-crystallization time. Similarly, Fig. 4C, CP17, -CP18, and -CP19 presented that the synthesized samples revealed pure HEU structures without any impurity although the additive amount of solution-SP was increased when the pre-crystallization time of the solution-SP was the same.
Fig. 5 shows the morphologies of the synthetic CPs. First of all, Fig. 5a revealed the granular particles synthesized without additive SP in the size of about 10 μm, being consistent with the reported literature.11,12 Comparably, a significant decrease occurred in the particle size of CPs obtained in the presence of sol-SP. In detail, their particle sizes were about 7 and 2 μm when an additive amount (3 wt%) of pre-crystallization were from 60 and 102 h of sol-SP (as shown in Fig. 5b and c), respectively, similar to those obtained by the seed method.12,13 Meanwhile, their particle sizes also showed the declining tendencies with the increased additive amount (3–18 wt%) of pre-crystallization 60 h of sol-SP (as shown in Fig. 5b and d).
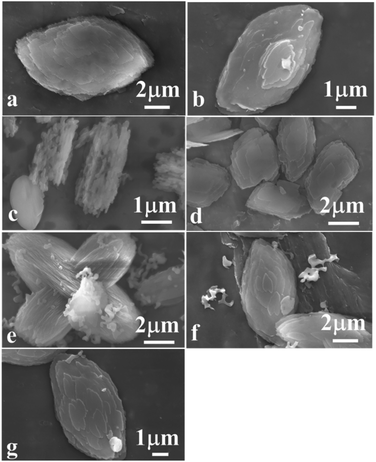 | ||
| Fig. 5 SEM images of synthetic CPs with various additive amounts of sol-SP, solid-SP and solution-SP. (a) CP1, (b) CP3, (c) CP4, (d) CP7, (e) CP15, (f) CP16, and (g) CP19. | ||
The observations of the samples synthesized with solid-SP were the same as those with sol-SP, showing the declining particle size with the increase in pre-crystallization time (as shown in Fig. S2-a and -b†) or the additive amount (as shown in Fig. S2-a and -c†). However, no matter what was the prolonged pre-crystallization time (as shown in Fig. 5e and f) or the increased additive amount of the solution-SP (as shown in Fig. 5e and g), the synthetic CPs presented granule morphology of size of around 8–10 μm. These phenomena obviously indicate that CPs with smaller granule size can be synthesized using sol-SP or solid-SP as additives, while the particle size and morphology of CPs synthesized using solution-SP have no obvious change.
Fig. S3† provides the N2 adsorption–desorption isotherms of all related samples, and their corresponding textural parameters are collected in Table 1. As can be seen, all the isotherms presented the H3-type hysteretic loops, which can be attributed to the multi-layer adsorption and capillary condensation phenomena.7 Meanwhile, a sudden increase in the adsorption capacity can be observed at very low pressure, indicating the presence of microporous structures with a mean pore size of approximately 0.8–0.9 nm. In addition, specific surface areas of synthetic CPs were slightly decreased with prolonged pre-crystallization time (such as CP3, CP4, and CP9, CP10, as shown in Table 1) or the increased additive amount of the sol-SP and solid-SP (such as CP3, CP7, and CP9, CP13, as shown in Table 1). One of the possible reason may be due to the presence of impurities in the synthetic CPs or the blockage of microspores. Comparably, the relative specific surface area of CPs synthesized with solution-SP had fewer impurities and higher crystallinity, the specific surface areas did not decrease significantly (such as for CP15, CP16, and CP19, as shown in Table 1).
3.2 Thermal stability (TG-DSC)
TG-DSC profiles of synthetic CPs were also collected and the results are provided in Fig. S4 of the ESI section.† As can be seen in Fig. S4-A,† the TG profiles can be divided into two stages, exhibiting continuous weight-loss tendencies as a function of temperature (25–900 °C). The first period at 25–300 °C had a high weight loss rate (7–9 wt%) and was generally considered to be the removal of physisorbed water,29 while, the second one during the temperature range of 300–500 °C presented a low weight loss of less than 2% at a slow rate, which was attributed to the dehydroxylation of the CPs.30 These results of additive sol-SP were basically the same as that of additive solid-SP (Fig. S4-B†) and solution-SP (Fig. S4-C†). While there was a slight difference in the adsorption capacities of the physisorbed water. Hence, these observations suggest that the additive SP has no obvious effect on the thermal stability of the synthetic CPs.Meanwhile, two endothermic peaks of synthetic CPs in the temperature range of 25–900 °C were observed, as shown in DSC curves in Fig. S4† (inset). The first one at 25–300 °C was associated with the desorption of surface-adsorbed physical water, corresponding to a weight loss of the first stage in TG profiles. The second one at 300–500 °C may be related to the desorption of the combined water. However, an exothermic peak was not observed at higher temperatures, indicating that the phenomena of crystal transformation or structural collapse did not occur.
3.3 Crystallization kinetics
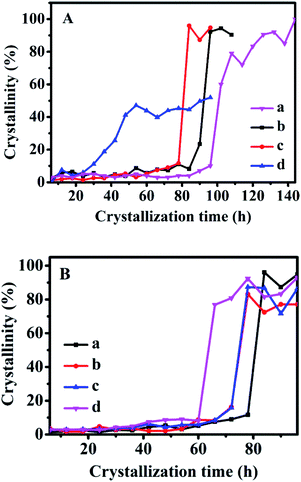
Based on the reported literature,31–33 the crystallization progress of traditional zeolites generally consists of three distinct regions: induction, growth, and stable periods, respectively. The research on zeolite synthesis mainly focuses on the induction period and growth period. The induction period mainly includes the nucleation process of crystals, and the time that approximately 10% crystallinity passes through is defined as the induction time in literature.16 During growth periods, the rapid evolution of the crystal structure results in a sudden change in the slope of the crystallization curve. The growth time is defined as the difference between the time taken to achieve constant crystallinity and the induction time. After that, the stable period mainly includes the process of slowing down the growth of the crystal. Therefore, according to the relative value of the sum of ten diffraction peaks in the XRD patterns of the CPs: (020), (200), (111), (13−1), (131), (22−2), (42−2), (350), (530), (061), the crystallinity of CPs obtained after the crystallized time of 144 h at 150 °C without SP were normalized as 1.0, and then the relative crystallinity of other samples was obtained accordingly.Fig. 6 shows the crystallization kinetics of the synthetic CPs with the additive sol-SP. As can be seen, the induction time of the CPs synthesized without sol-SP was about 96 h (Fig. 6A-a), which was remarkably longer than that with the additive sol-SP. However, the induction time gradually decreased to 90, 78, and 24 h with the prolonged pre-crystallization time of 6 h (Fig. 6A-b), 60 h (Fig. 6A-c), and 102 h (Fig. 6A-d), respectively. Similarly, the crystal induction period declined to 78, 72, and 60 h with the increased additive amount of sol-SP of 3 (Fig. 6B-a), 6 (Fig. 6B-b), 9 (Fig. 6B-c), and 18 wt% (Fig. 6B-d).
Comparably, the addition of sol-SP did not significantly shorten the growth periods of the synthetic CPs, showing around 6–10 h. Obviously, the additive sol-SP is beneficial to the promotion of crystal nuclei but has little effect on the growth process. The possible reasons could be interpreted as follows: when the sol-SP is added to the synthesis system, it is rapidly combined with the amorphous aluminosilicate species in the mother liquor to generate the 8-member ring and 10-member ring structural units (as shown in Fig. 2), which consist of crystal nuclei. In this regard, the steps for controlling the reaction rate are directional polymerization of silicate and aluminate species, which is conducive to shortening the formation time of the crystal nucleus. Then, the recombination of crystal nuclei and aluminosilicate species led to the formation of nanocrystals, which subsequently aggregates the large crystals by polymerization, dissolution, and repolymerization.34,35 This explanation could be consistent with the crystallization process of conventional zeolites, such as FAU and L zeolite reported in the literature. For example, Kumar et al.36 studied the synthesis process of L zeolites and found that precursor particles were firstly formed in the crystallization process, and then gradually increased in size until reaching the maximum before the beginning of the growth period. However, the number of these particles continued to decrease after the beginning of the growth period, providing nutrients for the growth of L zeolites. Valtchev et al.37 believed that zeolite particles with small size and poor stability were easy to dissolve as nutrients, which promoted the formation of larger zeolite crystals in the growing period of FAU zeolite.
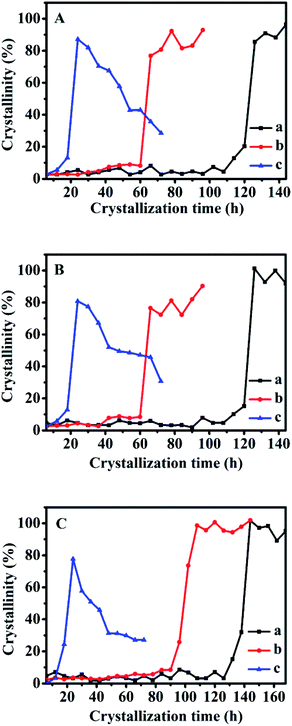
The crystallization kinetics of the synthetic CPs after adding solid-SP and shown in Fig. S5-A† is almost similar to that with sol-SP. The crystallization induction time of CPs was reduced to 90, 78, and 24 h with the increased re-crystallization time (6–102 h) of the additive solid-SP. Also, the induction times were shortened to 78, 72, and 60 h with the increase of additive solid-SP (3–18 wt%), respectively.
However, as can be seen in Fig. S5-B,† the crystallization kinetics of CPs synthesized by additive solution-SP presented that the induction time of the synthetic CPs was around 96 h, which showed a big difference from that with sol-SP and solid-SP, but very similar to that without additive SP (Fig. 6A-a). These investigations indicated that the solution-SP obtained either in crystallization time or in additive amount had little impact on the induction period. Meanwhile, the relative crystallinity of the synthetic CPs in the growth procedure varied slightly (around 90–97%) with additive solution-SP of different pre-crystallization times of 6, 60, and 102 h, higher than that 80% for CP synthesized without any additive (as shown in Fig. 6A-a). Similar phenomena on various additive amounts of solution-SP were also observed in Fig. S5-C.† Obviously, these results demonstrate that the additive solution-SP may be useful to promote the repaid growth of CPs after nucleation, but has no significant effect on decreasing the induction period.
The kinetic parameters of the crystallization process were further explored in detail as shown from the data in Fig. 7, representing the crystallization performances of CPs synthesized with additive 18 wt% of sol-SP, solid-SP, and solution-SP (pre-crystallization time of 60 h) at 140, 150, and 180 °C, respectively. The activation energy (En and Eg) of each stage in the synthesis of CPs was calculated based on the Arrhenius equation.
The apparent En value was calculated using nucleation rate (1/t0) and temperature based on eqn (2).38
 | (2) |
Similarly, eqn (3) was used to calculate the apparent Eg value,39 the rate constant (k) can be obtained from the slope at the steepest point of the crystallization curve.
 | (3) |
Therefore, the logarithmic graphs of the reciprocal of nucleation rate (or growth rate) and temperature are shown in Fig. S6 of the ESI section.†
Table 2 summarizes various parameters of En, t0, and kmax values during crystallization of synthetic CPs. Based on the ICP data, chemical formulas of various synthetic CPs were provided, showing that the Si/Al molar ratio of related samples was about 5.79–6.44. As can be seen, the En value obtained by additive sol-SP was basically similar with the additive solid-SP that was around 65.5–67.0 kJ mol−1, but a little smaller than that (73.3 kJ mol−1) by the additive solution-SP, which was almost consistent with the result (73.9 kJ mol−1) in literature without any SP additive.16 Accordingly, Eg values obtained by additive sol-SP or solid-SP was almost the same, showing around 20.1–21.9 kJ mol−1, but larger than that (18.2 kJ mol−1) by additive solution-SP.
| Sample | Chemical formulaa | T (°C) | Induction period | Growth period | ||||
|---|---|---|---|---|---|---|---|---|
| t0 (h) | ln![[thin space (1/6-em)]](https://www.rsc.org/images/entities/char_2009.gif) An An |
En (kJ mol−1) | kmax | ln![[thin space (1/6-em)]](https://www.rsc.org/images/entities/char_2009.gif) Ag Ag |
Eg (kJ mol−1) | |||
| a CP1: Na1.24K4.70Si30.85Al4.89O72. | ||||||||
| CP7 | Na1.15K5.55Si30.40Al5.23O72 | 140 | 108 | 14.4 | 65.5 | 7.1 | 8.40 | 21.9 |
| 150 | 60 | 9.0 | ||||||
| 180 | 18 | 13.0 | ||||||
| CP13 | Na1.32K4.56Si30.94Al4.79O72 | 140 | 110 | 14.9 | 67.0 | 8.4 | 8.03 | 20.1 |
| 150 | 60 | 10.2 | ||||||
| 180 | 18 | 14.3 | ||||||
| CP19 | Na1.16K4.19Si31.00Al4.88O72 | 140 | 130 | 16.5 | 73.3 | 7.3 | 7.31 | 18.2 |
| 150 | 85 | 8.1 | ||||||
| 180 | 18 | 11.6 | ||||||
Therefore, the En value obtained by additive sol-SP was lower than that by additive solution-SP, suggesting that additive sol-SP can reduce the activation energy during the induction period and shorten the crystallization process. While, the results revealed that the En values are much higher than the Eg values, indicating that the induction period is the dominant kinetics during the crystallization process.
The results of the additive solution-SP show that it can promote the rapid growth of the synthetic CPs, the possible explanations are that the double four-member rings in the solutions should be connected to the crystal nucleus, resulting in the rapid growth of CPs. On the other hand, unlike the addition of sol-SP and solid-SP, the additive solution-SP had a less significant effect on the growth period, which could be caused by the relatively few active substances in the solution-SP.
3.4 Adsorption performances of CO2 and CH4
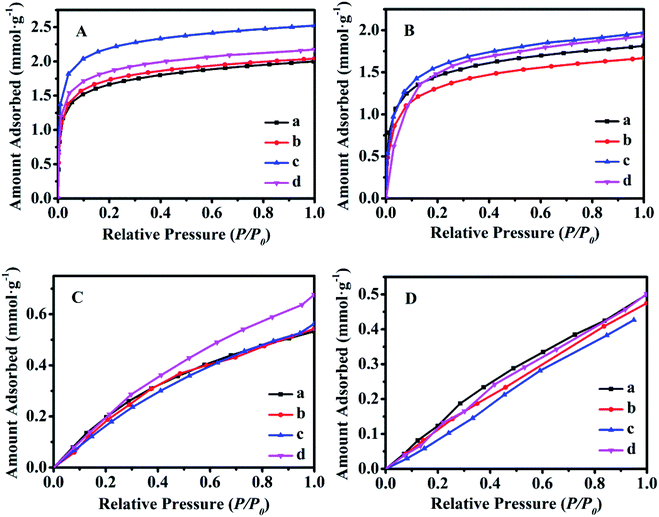
Fig. 8 shows the equilibrium adsorption isotherms of CO2 and CH4 for various synthetic CPs at 0 and 25 °C. As can be seen, all samples presented the type I isotherms according to Brunauer's classification.40 The CO2 maximum adsorption capacities of CP1, CP7, CP13 and CP19 were up to 1.99, 2.04, 2.52, 2.17 mmol g−1 at 0 °C (Fig. 8A) and 1.81, 1.67, 1.97, 1.93 mmol g−1 at 25 °C (Fig. 8B), respectively. While, all of the related samples exhibited similar behavior for adsorbed CH4, showing the maximum capacities of around 0.53–0.67 mmol g−1 at 0 °C (Fig. 8C) and 0.47–0.50 mmol g−1 at 25 °C (Fig. 8D). However, their CO2 and CH4 uptake at 0 °C were much higher than that at 25 °C. Kennedy et al. also reported a similar result,41 the possible explanation is that the kinetic diameter (0.333 nm) of the CO2 molecule is smaller than that of CH4 (0.380 nm), which seems to easily diffuse into the micropore of CPs. Although the essence mechanism is still unclear, the charge distribution of exchangeable cations (Na+ and K+) in HEU skeletons also has a great influence on the adsorption performance.7The Freundlich–Langmuir equation (as shown in eqn (4)) was used to calculate the molar adsorption capacity.42 Their adsorption heat of CO2 and CH4 could be also calculated on the basis of the Clausius–Clapeyron equation (as shown in eqn (5)).
 | (4) |
 | (5) |
Various parameters were collected and are reported in Table S2.†
Accordingly, the selectivity and adsorption heat of CO2/CH4 is shown in Fig. S7.† As can be seen in Fig. S7-A and -B,† the adsorption calorific values of CO2 and CH4 adsorption were all greater than 0, indicating an endothermic process. The results were consistent with those described in the literature, for example, Salehi et al.43 and Davarpanah et al.44 calculated that adsorption heats of CP for CO2 and CH4 were 21.47 and 16.86 kJ mol−1, respectively, the reason for the low adsorption affinity is that CH4 and CO2 are non-polar molecules.
While Fig. S7-C and -D† exhibited similar performances of the CO2/CH4 selectivity at 0 and 25 °C. The CO2/CH4 selective factors for each sample (CP1, CP7, CP13, and CP19) were 3.42, 3.85, 4.82, 3.94 at 0 °C and 3.69, 3.51, 4.45, 3.90 at 25 °C, respectively. Compared with CO2/CH4 selective adsorption performance for reported materials (as shown in Table S3†),43,45–48 it can be speculated that the separation performance of CPs can be further improved via Li+, Ca2+, Ce3+ modifications. These results implied that the synthesized CPs should be a promising candidate for CO2/CH4 separation.
4 Conclusions
The different pre-crystallized sol-SP, solid-SP, and solution-SP were prepared, which were used as structure promoters to be added to the hydrothermal system for the successful synthesis of three types of CPs. Various characterizations demonstrated their differences in composition and structural properties. The Arrhenius equation was employed to calculate activation energy values (En and Eg) of the induction phase and growth phase during the synthesis processes. The adsorption capacity and its separation ability of synthetic CPs for CO2 or CH4 were preliminarily explored. The results showed that the nucleation process is the main controlling step during the synthesis of CPs, whereas sol-SP and solid-SP can both promote the formation of crystal nuclei and shorten the crystallization time, showing the same promotion mechanism. Particularly, with an increased additive amount of sol-SP (solid-SP) or prolonging of their pre-crystallization time, the En value during the induction period decreased gradually, however, either too long pre-crystallization time or too much addition easily led to appearances of the impurity phase (phillipsite) in synthetic CPs. Comparably, solution-SP accelerated the growth process in the synthesis of CPs, which was beneficial to improve the relative crystallinity of CPs but had no obvious effect on the induction period. The adsorption capacity and separation performance of the synthetic CPs for CO2/CH4 provided a theoretical basis for the further design, synthesis and modification of better CP adsorbents.Author contributions
Chengwei Zhai: investigation, writing-original draft preparation, Bingying Jia, Anadil Gul: data curation, Jihong Sun: supervision, conceptualization, methodology, Shiyang Bai: formal analysis, validation.Conflicts of interest
There are no conflicts to declare.Acknowledgements
This work was supported by the National Natural Science Foundation of China (21878006).References
- B. E. Alver and M. Sakizci, Adsorption, 2015, 21, 391–399 CrossRef CAS.
- A. Jayaraman, A. J. Hernandez-Maldonado, R. T. Yang, D. Chinn, C. L. Munson and D. H. Mohr, Chem. Eng. Sci., 2004, 59, 2407–2417 CrossRef CAS.
- D. A. Kennedy, M. Khanafer and F. H. Tezel, Microporous Mesoporous Mater., 2019, 281, 123–133 CrossRef CAS.
- T. C. Frankiewicz and R. G. Donnelly, in Industrial Gas Separations, ed. T. E. Whyte, C. M. Yon and E. H. Wagener, American Chemical Society, Washington D.C., 1983, vol. 223, ch. 11, pp. 213–233 Search PubMed.
- C. C. Chao, US Pat., 4964889, 1990 Search PubMed.
- G. Aguilar-Armenta, G. Hernandez-Ramirez, E. Flores-Loyola, A. Ugarte-Castaneda, R. Silva-Gonzalez, C. Tabares-Munoz, A. Jimenez-Lopez and E. Rodriguez-Castellon, J. Phys. Chem. B, 2001, 105, 1313–1319 CrossRef CAS.
- E. Kouvelos, K. Kesore, T. Steriotis, H. Grigoropoulou, D. Bouloubasi, N. Theophilou, S. Tzintzos and N. Kanelopoulos, Microporous Mesoporous Mater., 2007, 99, 106–111 CrossRef CAS.
- Ö. Güvenir, H. Kalıpçılar and A. Çulfaz, Cryst. Res. Technol., 2009, 44, 293–299 CrossRef.
- L. Ames Jr, Am. Mineral., 1963, 48, 1374–1381 Search PubMed.
- Y. Goto, Am. Mineral., 1977, 62, 330–332 CAS.
- S. Satokawa and K. Itabashi, Microporous Mater., 1997, 8, 49–55 CrossRef CAS.
- C. H. Chi and L. Sand, Nature, 1983, 304, 255–257 CrossRef CAS.
- D. Zhao, R. Szostak and L. Kevan, J. Mater. Chem., 1998, 8, 233–239 RSC.
- C. D. Williams, Chem. Commun., 1997, 21, 2113–2114 RSC.
- J. S. Yuan, L. Shi, H. R. Han and Z. Y. Ji, Chin. J. Inorg. Chem., 2007, 23, 994–998 CAS.
- T. Ouyang, C. W. Zhai, J. H. Sun, H. Panezai and S. Y. Bai, Microporous Mesoporous Mater., 2020, 294, 109913–109922 CrossRef CAS.
- J. H. Sun, T. Ouyang, S. Y. Bai, C. W. Zhai, J. Jiao and J. Li, Chin. Appl. Pat., CN109592696A, 2019.
- M. A. A. Musa, C. Y. Yin and R. M. Savory, Mater. Chem. Phys., 2010, 123, 5–8 CrossRef CAS.
- X. Zhao, R. Liu, H. Zhang, Y. Shang, Y. Song, C. Liu, T. Wang, Y. Gong and Z. Li, J. Appl. Crystallogr., 2017, 50, 231–239 CrossRef CAS.
- N. G. Corral-Capulin, A. R. Vilchis-Nestor, E. Gutiérrez-Segura and M. Solache Ríos, J. Fluorine Chem., 2018, 213, 42–50 CrossRef CAS.
- Y. Garcia-Basabe, I. Rodriguez-Iznaga, L. C. D. Menorval, P. Llewellyn, G. Maurin, D. W. Lewis, R. Binions, M. Autie and A. R. Ruiz-Salvador, Microporous Mesoporous Mater., 2010, 135, 187–196 CrossRef CAS.
- Y. Xiao, N. Sheng, Y. Chu, Y. Wang, Q. Wu, X. Liu, F. Deng, X. Meng and Z. Feng, Microporous Mesoporous Mater., 2017, 237, 201–209 CrossRef CAS.
- K. Elghniji, E. Elaloui and Y. Moussaoui, Chem. Pap., 2017, 72, 1159–1168 CrossRef.
- A. Rivera, T. Farıas, A. Ruiz-Salvador and L. C. D. Ménorval, Microporous Mesoporous Mater., 2003, 61, 249–259 CrossRef CAS.
- E. Lippmaa, M. Maegi, A. Samoson, M. Tarmak and G. Engelhardt, J. Am. Chem. Soc., 1981, 103, 4992–4996 CrossRef CAS.
- N. Al-Yassir, M. N. Akhtar and S. Al-Khattaf, J. Porous Mater., 2012, 19, 943–960 CrossRef CAS.
- H. Tanaka, N. Yamasaki, M. Muratani and R. Hino, Mater. Res. Bull., 2003, 38, 713–722 CrossRef CAS.
- M. M. J. Treacy and J. B. Higgins, Collection of simulated XRD powder patterns for zeolites, Elsevier Science, Amsterdam, 2001 Search PubMed.
- E. Yrükoullar, G. Yılmaz and S. Dikmen, J. Therm. Anal. Calorim., 2010, 100, 925–928 CrossRef.
- B. E. Alver, M. Sakizci and E. Yörükoğullari, J. Therm. Anal. Calorim., 2009, 100, 19–26 CrossRef.
- V. Nikolakis, D. G. Vlacho and M. Tsapatsis, Microporous Mesoporous Mater., 1998, 21, 337–346 CrossRef CAS.
- J. L. Dong, Q. H. Xu and C. H. Ryong, Chin. J. Inorg. Chem., 1993, 9, 394–400 CAS.
- S. L. Peng, R. Ullah, S. Y. Bai, J. H. Sun and X. Wu, Acta Petrol. Sin., 2019, 35, 348–358 CAS.
- M. D. Oleksiak, J. A. Soltis, M. T. Conato, R. L. Penn and J. D. Rimer, Chem. Mater., 2016, 28, 4906–4916 CrossRef CAS.
- S. Mintova, N. H. Olson, V. P. Valtchev and T. Bein, Science, 1999, 283, 958–960 CrossRef CAS PubMed.
- M. Kumar, R. Li and J. D. Rimer, Chem. Mater., 2016, 28, 1714–1727 CrossRef CAS.
- V. P. Valtchev and K. N. Bozhilov, J. Phys. Chem. B, 2004, 108, 15587–15598 CrossRef CAS.
- F. Marzpour Shalmani, R. Halladj and S. Askari, Ultrason. Sonochem., 2016, 29, 354–362 CrossRef CAS PubMed.
- D. Uzcátegui and G. González, Catal. Today, 2005, 107–108, 901–905 CrossRef.
- S. Brunauer, L. S. Deming, W. E. Deming and E. Teller, J. Am. Chem. Soc., 1940, 62, 1723–1732 CrossRef CAS.
- D. A. Kennedy, M. Mujčin, C. Abou-Zeid and F. H. Tezel, Microporous Mesoporous Mater., 2019, 274, 327–341 CrossRef CAS.
- X. Yang, F. E. Epiepang, J. B. Li, Y. W. Wei, Y. S. Liu and R. T. Yang, Chem. Eng. J., 2019, 362, 482–486 CrossRef CAS.
- R. N. Salehi, S. Sharifnia and F. Rahimpour, J. Nat. Gas Sci. Eng., 2018, 54, 37–46 CrossRef.
- E. Davarpanah, M. Armandi, S. Hernández, D. Fino, R. Arletti, S. Bensaid and M. Piumetti, J. Environ. Manage., 2020, 275, 111229 CrossRef CAS PubMed.
- A. Arefi Pour, S. Sharifnia, R. NeishaboriSalehi and M. Ghodrati, J. Nat. Gas Sci. Eng., 2015, 26, 1246–1253 CrossRef CAS.
- S. Oddy, J. Poupore and F. H. Tezel, Can. J. Chem. Eng., 2013, 91, 1031–1039 CrossRef CAS.
- D. A. Kennedy and F. H. Tezel, Microporous Mesoporous Mater., 2018, 262, 235–250 CrossRef CAS.
- A. D. J. Montes Luna, G. Castruita de León, S. P. García Rodríguez, N. C. Fuentes López, O. Pérez Camacho and Y. A. Perera Mercado, J. Nat. Gas Sci. Eng., 2018, 54, 47–53 CrossRef CAS.
Footnote |
| † Electronic supplementary information (ESI) available. See DOI: 10.1039/d1ra03314j |
| This journal is © The Royal Society of Chemistry 2021 |

