 Open Access Article
Phosphorus speciation analysis of fatty-acid-based feedstocks and fast pyrolysis biocrudes via gel permeation chromatography inductively coupled plasma high-resolution mass spectrometry†
Victor Garcia-Montoto ab,
Sylvain Verdierc,
David C. Dayton
 d,
Ofei Mante
 d,
Carine Arnaudguilhema,
Jan H. Christensenb and
Brice Bouyssiere
 *a
*a
aUniversite de Pau et des Pays de l'Adour, E2S UPPA, CNRS, Institut des Sciences Analytiques et de Physico-chimie pour l'Environnement et les Materiaux (IPREM), UMR 5254, 64000 Pau, France. E-mail: brice.bouyssiere@univ-pau.fr
bDepartment of Plant and Environmental Sciences, University of Copenhagen, Thorvaldesensvej 40, 1871 Frederiksberg C, Denmark
cHaldor Topsoe A/S, Haldor Topsøes allé 1, 2800 Kgs. Lyngby, Denmark
dTechnology Advancement and Commercialization, RTI International, Research Triangle Park, NC 27709, USA
First published on 5th August 2021
Abstract
Renewable feedstocks, such as lignocelulosic fast pyrolysis oils and both vegetable oil and animal fats, are becoming a viable alternative to petroleum for producing high-quality renewable transportation fuels. However, the presence of phosphorus-containing compounds, mainly from phospholipids, in these renewable feedstocks is known to poison and deactivate hydrotreating catalysts during fuel production. In this work, gel permeation chromatography (GPC) combined with inductively coupled plasma high-resolution mass spectrometry (ICP-HRMS) was used to analyze feedstocks including unprocessed soybean oil, animal fat, and pyrolysis oils from red oak and milorganite to identify phosphorus species. The results have shown the presence of a wide range of different phosphorous compounds among all the samples analysed in this work. The GPC-ICP-HRMS analyses of a vegetable oil and two animal fats have shown different fingerprints based on the molecular weight of each of the samples, highlighting the structural differences among their corresponding phosphorus-containing compounds. While the presence of low-molecular-weight species, such as phospholipids, was expected, several high-molecular-weight species (MW > 10![[thin space (1/6-em)]](https://www.rsc.org/images/entities/char_2009.gif) 000 Da) have been found, suggesting that high-molecular-weight micelles or liposomes might have been formed due to the high concentration of phospholipids in these samples. Results obtained through the hydroxylation of a mix of phospholipids (asolectin) and its posterior GPC-ICP-HRMS agree with this hypothesis. With respect to the lignocellulosic catalytic fast pyrolysis oil samples, the GPC-ICP-HRMS results obtained suggest that either aggregation or polymerization reactions might have occurred during the pyrolysis process, yielding phosphorus-containing compounds with an approximate molecular weight above 91
000 Da) have been found, suggesting that high-molecular-weight micelles or liposomes might have been formed due to the high concentration of phospholipids in these samples. Results obtained through the hydroxylation of a mix of phospholipids (asolectin) and its posterior GPC-ICP-HRMS agree with this hypothesis. With respect to the lignocellulosic catalytic fast pyrolysis oil samples, the GPC-ICP-HRMS results obtained suggest that either aggregation or polymerization reactions might have occurred during the pyrolysis process, yielding phosphorus-containing compounds with an approximate molecular weight above 91![[thin space (1/6-em)]](https://www.rsc.org/images/entities/char_2009.gif) 000 kDa. In addition, an aggregation phenomenom has been observed for those phosphorus species present within the fast pyrolysis oils after being stored for 3 months, especially for those pyrolysis oils contaning pre-processed feedstocks, such as milorganite.
000 kDa. In addition, an aggregation phenomenom has been observed for those phosphorus species present within the fast pyrolysis oils after being stored for 3 months, especially for those pyrolysis oils contaning pre-processed feedstocks, such as milorganite.
Introduction
The use of renewable feedstocks, such as fatty acids or lignocellulosic materials, to produce drop-in hydrocarbon transportation fuels is increasing the use of renewable energy in the transport sector. The RED II legislation (Renewable Energy Directive for 2021–2030 in the EU) has set an obligation on fuel suppliers that ensures that by 2030 at least 14% of the energy supplied for final consumption in the transport sector is produced from renewable sources and at least 3.5% of transportation fuels are produced from renewable feedstocks. Furthermore, the overall EU target for renewable energy sources consumption by 2030 is 32%.1,2Fatty acid feedstocks, such as virgin oils, used cooking oils and animal fats, are the most common feedstocks for producing either biodiesel or renewable diesel. Biodiesel is produced by combining lipids with an alcohol, generally methanol, in a base-catalysed transesterification process, where the fatty acids present within the feedstocks are transformed into fatty acid methyl esters (FAMEs) and glycerol is produced as a by-product. These feedstocks can also be converted into hydrocarbons (mainly n-C15, n-C16, n-C17 and n-C18) in a hydrotreating process by reacting these feedstocks with high pressure hydrogen in the presence of a NiMo or CoMo catalyst. This mixture of n-alkanes, once purified, is known as renewable diesel or hydrotreated vegetable oil (HVO).3–6
Lignocellulosic catalytic fast pyrolysis biocrudes are another source of renewable hydrocarbon-rich intermediates that can be upgraded into transportation fuels. Lignocellulosic-derived feedstocks such as woody biomass, forest residuals, and agricultural residues are heated at temperatures between 450 and 600 °C in the absence of oxygen to thermally decompose their organic matter into char, gas and organic vapours that are posteriorly condensed, thus obtaining a liquid that is known as bio-oil or biocrude.7–9 These pyrolysis oils can be used as feedstocks for a hydrotreating process to produce hydrocarbon fuels with a high heating value and low content of impurities.
Both fatty acid and lignocellulosic-derived feedstocks contain a relatively high concentration of phosphorus originating from those phospholipids present within the cell walls in both animal and vegetal cells.9 Although some studies have shown minimal impact of model phospholipids on hydroprocessing catalyst performance,10 other phosphorus compounds that are present within these feedstocks can negatively affect the upgrading processes for high-energy-value hydrocarbon fuels. When phosphorous compounds interact with the hydrotreating catalyst in the absence of alkalis, they decompose to produce phosphoric acid that promotes oligomerization and polymerization reactions causing high-molecular-weight oligomers to deposit on the catalyst surface forming carbon deposits that ultimately cause catalyst deactivation. When alkali metals are present, phosphates form deposits in the catalyst bed leading to catalyst deactivation and bed agglomeration.11 Deposit formation may indeed cause serious issues in industrial units such as pressure drops and high catalyst deactivation.12
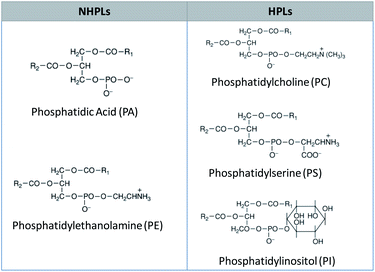
The phospholipid components in fatty acid feedstocks have been well characterized and can be divided into two groups based on how they interact with water: non-hydratable phospholipids (NHPLs) and hydratable phospholipids (HPLs). Phosphatidic acid (PA) and phosphatidylethanolamine (PE) are the most common NHPLs and they tend to form salts with Ca and Mg ions. Phosphatidylcholine (PC), phosphatidylinositol (PI) and phosphatidylserine (PS) are representative HPLs that form insoluble hydrates which are easily removed from the feedstock matrix with water. The structure of these phospholipids is detailed in Fig. 1.
The elimination of these phosphorus species is known as “degumming” and this treatment is carried out through different processes that reduce the content of phosphorus in these feedstocks typically to less than 1 ppm. Water degumming, acid degumming and absorption are some of the most common methods used to pre-treat feedstocks and to remove phosphorus and other contaminants.13,14 However, using standard techniques to remove phosphorous species from lignocellulosic pyrolysis oils is not effective so reliable alternatives need to be developed. Nevertheless, the physical and chemical form of phospholipids can be a function of the surrounding matrix. For example, micelles can form when the hydrophilic part of the phospholipids (the phosphate group) interacts with the hydrophobic part of the phospholipids (the fatty acid chains) to produce spherical phospholipid aggregates. Hydroxylation of the double bonds present in the fatty acid chain can increase the number of hydroxyl groups structurally changing phospholipids but also changing the polarity of the molecule which alters the aggregation behaviour and inhibits micelle formation.15
The phosphorus in lignocellulosic feedstocks or solid waste can also have a phospholipidic origin, since these compounds are present in all the cell membranes that conform the vegetable cells organelles such as chloroplasts and nucleus. The transformation of these phospholipids during pyrolysis processes is unknown so understanding their structure would be useful to adjust the feedstock pre-treatment process conditions and improve the efficiency of the corresponding hydrotreating processes (e.g. by developing an efficient catalyst that facilitates and increases the conversion of these bio-oils to biodiesel or renewable transportation fuel hydrocarbons).
The use of gel permeation chromatography (GPC) coupled with UV-VIS and RI detectors for the analysis of pyrolysis oils has already been used as a complementary technique for determining the composition of these samples and some of their fractions.15–18 However, the coupling of this technique with element detection has not been widely used for this type of samples. Integrating GPC with inductively coupled plasma high-resolution mass spectrometry (GPC-ICP-HRMS) is a method that can be used to obtain a size distribution fingerprint of phosphorous containing species. This method has already been used to analyse several elements (S, Ni and V, among others) in complex matrices, such as petroleum,19–22 atmospheric resid oils23 and asphaltenes.24,25
Measuring the molecular weight distribution of known phosphorus-containing species related to their hydrodynamic volume in fatty acid feedstocks can be used as a reference for identifying and understanding those present in lignocellulosic feedstocks like the biocrudes. When performing a chromatographic separation while using GPC columns, which are filled with a porous gel, those analytes with a bigger hydrodynamic volume will elute first, as their interaction with the gel pores will be lower than those analytes with a lower hydrodynamic volume. Thus, the aim of this study was to compare the phosphorous containing species identified in fatty acid feedstocks with those found in lignocellulosic biocrudes using GPC-ICP-HRMS. A better understanding of the composition of phosphorous containing species will facilitate their posterior removal from renewable feedstocks to improve the reliability and efficiency of hydroprocessing for producing high-quality transportation fuels.
Experimental
Instrumentation
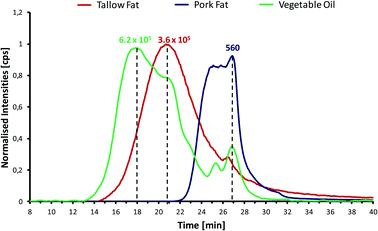
The phosphorus concentration in the vegetable oil and the tallow fat were obtained from Verdier et al.12,26 They consist of the median concentration obtained by twelve laboratories participating in a Round Robin study for the quantitative analysis of trace elements in renewable feedstocks. These results are detailed in Table 1.
| Sample name | Method | P concentration (ppm) |
|---|---|---|
| a Average value obtained from 12 independent analytical laboratories. | ||
| Soybean vegetable oil | ICP-OESa | 2 |
| Tallow animal fat | ICP-OESa | 87 |
| Pork animal fat | ICP-MS | 105 |
| Milorganite pyrolysis oil | ICP-MS | 26 |
| Milorganite & red oak pyr. oil | ICP-MS | 34 |
| Red oak pyrolysis oil | ICP-MS | 7.3 |
The instrument was equipped with a modified DS-5 microflow total consumption nebulizer (CETAC, Omaha, NE) coupled to a custom-made spray chamber heated to 65 °C by a water/glycol mixture in a temperature-controlled bath circulator Neslab RTE-111 (Thermo Fisher Scientific, Waltham, MA).23
The mass spectrometer was optimized and mass-calibrated daily at resolutions of 300 and 4000 by injecting a standard solution containing 1.0 ng g−1 of Ag, Al, B, Ba, Ca, Cd, Co, Cr, Cu, Fe, In, K, Li, Mg, Mn, Mo, Na, Ni, P, Pb, Sc, Si, Sn, Ti, V, Zn and Y in tetrahydrofuran (THF). A mass offset was applied to compensate for the mass drift of the sector field magnet.23,28
A Dionex high-performance liquid chromatography (HPLC) system fitted with an UltiMate 3000 microflow pump, an UltiMate 300 autosampler and a low port-to-port dead-volume microinjection valve was also used for sample analysis. The separation was carried out via three Waters (Waters Corporation, Mildford, MA) styrene-divinylbenzene gel permeation columns (7.8 mm i.d. and 300 mm length): (1) an HR4 column (particle size of 5 μm and exclusion limit of 600![[thin space (1/6-em)]](https://www.rsc.org/images/entities/char_2009.gif) 000 Da of polystyrene equivalent), (2) an HR2 column (particle size of 5 μm and exclusion limit of 20
000 Da of polystyrene equivalent), (2) an HR2 column (particle size of 5 μm and exclusion limit of 20![[thin space (1/6-em)]](https://www.rsc.org/images/entities/char_2009.gif) 000 Da) and (3) an HR0.5 column (particle size of 5 μm and exclusion limit of 1000 Da of polystyrene equivalent). These columns were protected using a Styragel guard column (4.6 mm i.d. and 30 mm length) fitted between the columns and the HPLC instrument.
000 Da) and (3) an HR0.5 column (particle size of 5 μm and exclusion limit of 1000 Da of polystyrene equivalent). These columns were protected using a Styragel guard column (4.6 mm i.d. and 30 mm length) fitted between the columns and the HPLC instrument.
The GPC columns were calibrated by using three solutions containing polystyrene standards dissolved in THF. Solution 1 contained PSs with a MW of 3![[thin space (1/6-em)]](https://www.rsc.org/images/entities/char_2009.gif) 152
152![[thin space (1/6-em)]](https://www.rsc.org/images/entities/char_2009.gif) 000, 1
000, 1![[thin space (1/6-em)]](https://www.rsc.org/images/entities/char_2009.gif) 044
044![[thin space (1/6-em)]](https://www.rsc.org/images/entities/char_2009.gif) 000 and 466
000 and 466![[thin space (1/6-em)]](https://www.rsc.org/images/entities/char_2009.gif) 300 Da respectively; Solution 2 contained PSs with a MW of 206
300 Da respectively; Solution 2 contained PSs with a MW of 206![[thin space (1/6-em)]](https://www.rsc.org/images/entities/char_2009.gif) 000, 67
000, 67![[thin space (1/6-em)]](https://www.rsc.org/images/entities/char_2009.gif) 600 and 27
600 and 27![[thin space (1/6-em)]](https://www.rsc.org/images/entities/char_2009.gif) 060 Da respectively and Solution 3 contained PSs with a MW of 12
060 Da respectively and Solution 3 contained PSs with a MW of 12![[thin space (1/6-em)]](https://www.rsc.org/images/entities/char_2009.gif) 980, 666, 1140 and 162 Da. The peaks were eluted from the highest to the lowest molecular size, which in this case, agreed with their molecular weight. The peaks have been detected with an Ultimate 300 VWD UV-VIS detector fixed at a wavelength of 420 nm. The GPC-UV-VIS chromatogram showing the PS calibration peaks is shown in Fig. S1.† A calibration curve was obtained by plotting the logarithm of each standard's MW versus their corresponding retention times. This calibration curve, which allows an estimation of the molecular weight of an eluted analyte is shown in Fig. S2.†
980, 666, 1140 and 162 Da. The peaks were eluted from the highest to the lowest molecular size, which in this case, agreed with their molecular weight. The peaks have been detected with an Ultimate 300 VWD UV-VIS detector fixed at a wavelength of 420 nm. The GPC-UV-VIS chromatogram showing the PS calibration peaks is shown in Fig. S1.† A calibration curve was obtained by plotting the logarithm of each standard's MW versus their corresponding retention times. This calibration curve, which allows an estimation of the molecular weight of an eluted analyte is shown in Fig. S2.†
Reagents, samples and solutions
An unprocessed soybean oil and two samples of animal fat, one from tallow and the other one from pork, were provided by Haldor Topsoe.The hydroxylation of the vegetable oil was carried out following a method developed by Casper et al.29 20 g of vegetable oil was mixed with 40 mL of glacial acetic acid (analytical grade) and 10.71 mL of hydrogen peroxide (35% w/w), both of purchased from Sharlau (Spain). The mixture was heated to reflux for 1 hour and then the organic layer was washed up with saturated solutions of sodium bisulphite (ACS reagent), sodium bicarbonate (ACS reagent, ≥99.7%) and sodium chloride (ACS reagent), which were purchased from Sigma-Aldrich (Germany). Then, the product was dried over anhydrous magnesium sulphate (≥99.5%), purchased from Sigma-Aldrich (Germany), and the solvent was evaporated. Asolectin from soybean (mixture of phospholipids) was also purchased from Sigma-Aldrich (Germany) and hydroxylated with the same reagents as the vegetable oil.
Pure red oak and milorganite were the lignocellulosic feedstocks used in this work. They were processed separately and, afterwards, 50% blends of both were also processed to determine the influence of biosolids such as milorganite in the biocrude composition respect to the pure red oak biocrudes.
The catalytic fast pyrolysis (CFS) was carried out in a pilot-scale catalytic fast pyrolysis unit with γ-Al2O3 being the catalyst, with a catalyst-to-biomass ratio average equal to 5. This unit consisted of a stainless-steel fluidized bed reactor that can process up to 1 tonne of feedstock per day (1 TPD). A more detailed description of the CFS process has been provided by Dayton et al.30 and Mante et al.31
The liquid–liquid extraction has been carried out with xylene (mixture of isomers, ACS reagent) purchased from Scharlau (Barcelona, Spain). 1 g of each biocrude was mixed with 9 g of xylene and sonicated for 5 minutes and centrifuged for 3 minutes at 5000 rpm in order to separate both phases. These two steps were repeated in order to optimise the extraction procedure. The xylene soluble fraction balance consisted of 50.65%, 5.12% and 4.3% respectively for milorganite, milorganite and red oak and pure red oak biocrudes. All the samples were diluted in THF with a dilution factor of 5 and then injected to the GPC-ICP-HRMS.
Results and discussion
Quantitative results
In order to test this hypothesis, the hydroxylation of the vegetable oil was carried out by adding hydroxyl groups within the fatty acid chains, which can cause a decrease within the hydrophobic part of the phospholipid will complicate the formation of micelles in the presence of a polar solvent since these hydroxyl groups will interact with the solvent via hydrogen bonds.
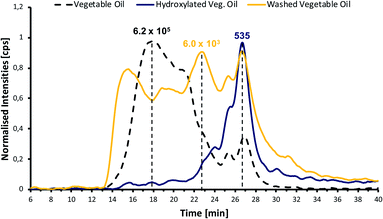
Fig. 3 shows the GPC-ICP-HRMS chromatograms of the phosphorus species, based on their molecular weight, for the vegetable oil sample and its product after (1) hydroxylation and posterior wash with water at basic pH and (2) after just having been washed with water at basic pH (this test was designed as a blank to evaluate the consequences of washing with water).
As it can be observed from Fig. 3, the phosphorus molecular weight distribution in the hydroxylated vegetable oil is quite different compared to the vegetable oil. The relative amount of high-molecular-weight (HMW) species has been drastically reduced in the hydroxylated vegetable oil sample, confirming that introducing a hydroxyl group within the phospholipid fatty acid chains reduces aggregation. Additional washing of the vegetable oils also reduces the HMW species by removing some of those hydratable phospholipids present in the sample.
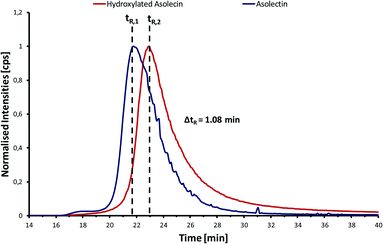 | ||
| Fig. 4 GPC-ICP-MS chromatograms corresponding to the analysis of P in the asolectin standard (blue) and the hydroxylated asolectin standard (red). | ||
Two main differences in the GPC-ICP-HRMS chromatogram of the hydroxylated asolectin sample can be observed: (1) a larger tailing that might be produced by several new compounds produced a consequence of the rupture of certain carbon–carbon double bonds of unsaturated higher fatty acids during the hydroxylation process and (2) a shift in the retention time of 1.08 minutes. This shift corresponds to an average difference of 8000 Da between the phosphorus species before and after hydroxylation. Such a large molecular size suggests that micelles are being formed in both samples. The lower relative amount of phosphorus HMW compounds in the hydroxylated asolectin and the lower average molecular size of the phosphorus containing species might indicate that even if micelles are formed in the hydroxylated vegetable oil they have smaller hydrodynamic volume and therefore, a smaller molecular mass. This supports the hypothesis that hydroxylation reduces micelle formation but, in this case, the size of the micelles is smaller because there are fewer phospholipids available for aggregation. In addition, asolectin, like lecithin, can be considered as a typical gum that is formed within the vegetable oil.32
Analysis of fast pyrolysis feedstocks
![[thin space (1/6-em)]](https://www.rsc.org/images/entities/char_2009.gif) :
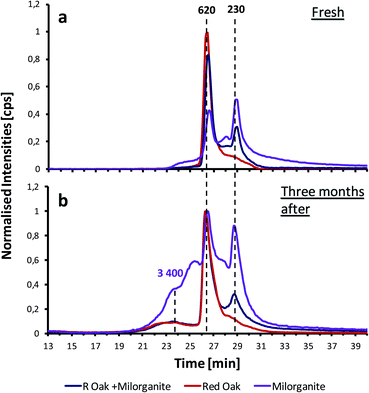
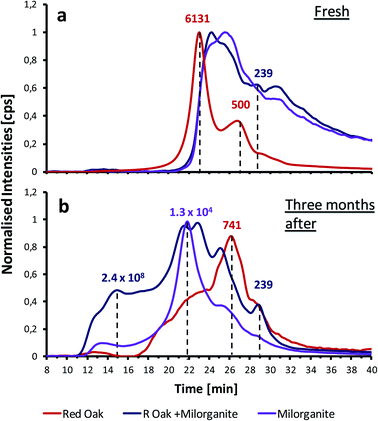
:![[thin space (1/6-em)]](https://www.rsc.org/images/entities/char_2009.gif) 1 mixture of both. The similarity between the phosphorus distribution in both biocrudes can also be observed: the same species might be shared among the three biocrudes indicated by the first eluting peak, corresponding to a molecular weight of about 620 Da (tR = 26.5 min). The same peak is observed for all three chromatograms but in different intensities. The retention time of the last-eluting peak indicates a molecular weight of around 230 Da, similar to the peaks observed for the vegetable oil and animal fat samples, which could correspond to the rupture of the phospholipids by the loss of the two fatty acid chains. This theory seems plausible, since milorganite was already processed (dewatered, dried and pelletized) before pyrolysis. Phospholipids could have ruptured during dewatering and drying of the biosolids causing the peak that it is observed after 29 minutes of analysis. In addition, these results suggest that the phospholipids do not suffer any rupture or decomposition during the pyrolysis process.
1 mixture of both. The similarity between the phosphorus distribution in both biocrudes can also be observed: the same species might be shared among the three biocrudes indicated by the first eluting peak, corresponding to a molecular weight of about 620 Da (tR = 26.5 min). The same peak is observed for all three chromatograms but in different intensities. The retention time of the last-eluting peak indicates a molecular weight of around 230 Da, similar to the peaks observed for the vegetable oil and animal fat samples, which could correspond to the rupture of the phospholipids by the loss of the two fatty acid chains. This theory seems plausible, since milorganite was already processed (dewatered, dried and pelletized) before pyrolysis. Phospholipids could have ruptured during dewatering and drying of the biosolids causing the peak that it is observed after 29 minutes of analysis. In addition, these results suggest that the phospholipids do not suffer any rupture or decomposition during the pyrolysis process.
Fig. 5b shows the GPC-ICP-MS chromatogram of the same xylene extract after being stored for three months. The same peaks can observed in the chromatograms. However, when comparing with the fresh samples chromatogram, the relative amount of HMW species increases from less than 5% up to 20% of the total area for the stored samples. These results indicate that the sample has further aged and additional aggregation has taken place e.g., polymerization of phospholipids. This hypothesis agrees with other observations found in the literature.33 In addition, the formation of new shoulder peaks suggest that new larger aggregates are being formed during storage.
For comparison purposes, the GPC-ICP-HRMS peaks have been divided into four fractions on the basis of their estimated molecular weight. These fractions are listed in Table S1.† In Fig. S3,† a bar plot comparing the distribution of the four chromatographic fractions between samples is shown. The results demonstrate a general decrease of the LMW compounds (F3 and F4) and an increase of the HMW fractions (F1 and F2).
Fig. 6b shows the GPC-ICP-HRMS chromatogram of the XIE sample after having been stored for three months. The results clearly show a change in the distribution of the phosphorus species towards shorter retention times: the relative area of the HMW region increases after storage, especially for the sample that consists of a 50![[thin space (1/6-em)]](https://www.rsc.org/images/entities/char_2009.gif) :
:![[thin space (1/6-em)]](https://www.rsc.org/images/entities/char_2009.gif) 50 mixture of milorganite and red oak. These results could be caused by the formation of micelles or liposomes within the sample matrix. Since the pyrolysis oils contain water, salts and several polar compounds, they might still be present in the matrix and contribute to the formation of these larger aggregates. The formation of other complexes within the matrix might be another reason that could explain the high presence of HMW species that vary from 35 to 67% of the total areas in these xylene insoluble extracts. Further analyses carried out with high-resolution MS techniques, such as FT-ICR-MS, would help to elucidate the structure of such high molecular weight compounds. Fig. S4† shows the size distribution of the four chromatographic fractions of the xylene insoluble extract. A significant increase of the fraction corresponding to the phosphorus species with the highest molecular weights is observed for the milorganite derived biocrudes, highlighting the instability that these biocrudes possess with respect to pure red oak derived ones.
50 mixture of milorganite and red oak. These results could be caused by the formation of micelles or liposomes within the sample matrix. Since the pyrolysis oils contain water, salts and several polar compounds, they might still be present in the matrix and contribute to the formation of these larger aggregates. The formation of other complexes within the matrix might be another reason that could explain the high presence of HMW species that vary from 35 to 67% of the total areas in these xylene insoluble extracts. Further analyses carried out with high-resolution MS techniques, such as FT-ICR-MS, would help to elucidate the structure of such high molecular weight compounds. Fig. S4† shows the size distribution of the four chromatographic fractions of the xylene insoluble extract. A significant increase of the fraction corresponding to the phosphorus species with the highest molecular weights is observed for the milorganite derived biocrudes, highlighting the instability that these biocrudes possess with respect to pure red oak derived ones.
Conclusions
The application of a GPC-ICP-HRMS methodology for the analysis of fatty acid feedstocks and renewable feedstocks has proven itself very valuable and has provided with a very novel insight on the molecular weight distribution of phosphorus species in this type of samples. It has also highlighted the different variety of phosphorus species among such different types of samples.Vegetable oil and animal fat samples have shown different fingerprints based on their molecular weight distribution. While phosphorus-containing compounds in animal fats tend to form medium- to low-molecular weight species, the presence of high-molecular-weight species is more common in soybean oil. The high presence of phospholipids in these samples might be the cause, and the results obtained through the hydroxylation of both a vegetable oil and asolectin have agreed with this hypothesis: the elimination of HMW phosphorus species was achieved, probably due to the impossibility of micelle formation due to the presence of hydroxyl groups within the phospholipid fatty acid chains. Further analyses, such as the analysis of the fatty-acid feedstock GPC fractions via FT-ICR-MS analysis, will help on the structure elucidation of such complex species.
On the other hand, the GPC-ICP-HRMS analyses in renewable feedstocks have shown that the phosphorus species present in these samples differ significantly from fatty-acid feedstocks. Phosphorus-containing compounds with higher molecular weights (MW > 91![[thin space (1/6-em)]](https://www.rsc.org/images/entities/char_2009.gif) 000 kDa) have been detected. Furthermore, the instability of these compounds has been confirmed due to a significant increase of HMW species in renewable feedstocks after having been stored for three months. However, a higher stability has been found in red oak fast pyrolysis oil than in those fast pyrolysis oils containing milorganite.
000 kDa) have been detected. Furthermore, the instability of these compounds has been confirmed due to a significant increase of HMW species in renewable feedstocks after having been stored for three months. However, a higher stability has been found in red oak fast pyrolysis oil than in those fast pyrolysis oils containing milorganite.
Future analyses with high-resolution mass spectrometry techniques, such as FT-ICR-MS, should focus on each of the obtained fractions in order to elucidate the structure of such complex compounds that are suspected to be the cause of catalyst poisoning and pressure drops during the hydrothermal conversion into high-quality transportation fuels, facilitating the development of more efficient purification processes that will enhance the production of high-quality transportation fuels from renewable feedstocks.
Author contributions
Conceptualization: Garcia-Montoto, V.; Verdier, S.; Dayton, D.C.; Mante, O.; Arnauldguilhem, C.; Christensen, J. H.; Bouyssiere, B.; funding acquisition: Bouyssiere, B.; Verdier, S.; investigation: Arnauldguilhem, C.; Garcia-Montoto, V.; methodology: Bouyssiere, B.; Garcia-Montoto, V.; project administration: Bouyssiere, B.; Christensen, J. H.; resources: Dayton, D. C.; Mante, O.; Verdier, S.; supervision: Bouyssiere, B.; Christensen, J. H.; validation: Dayton, D. C.; Mante, O.; Verdier, S.; writing—original draft preparation: Garcia-Montoto, V.; writing—review and editing: Garcia-Montoto, V.; Verdier, S.; Dayton, D. C.; Mante, O.; Christensen, J. H.; Bouyssiere, B.; all authors have read and agreed to the published version of the manuscript.Conflicts of interest
There are no conflicts to declare.Acknowledgements
The financial support of the Conseil Reǵional d’Aquitaine (20071303002PFM) and the Fonds Europeén de Developpement Economique et Regional (FEDER) (31486/08011464) is acknowledged.Notes and references
- H. D. C. Hamje, H. Hass, L. Lonza, H. Maas, A. Reid, K. D. Rose and T. Venderbosch, EU renewable energy targets in 2020: Revised analysis of scenarios for transport fuels, Publications Office of the European Union, Luxembourg, 2014 Search PubMed.
- European Commission, Official Journal of the European Union, 2018, vol. 61, pp. 1–230 Search PubMed.
- S. N. Naik, V. Goud, P. K. Rout and A. K. Dalai, Renew. Sustain. Energy Rev., 2010, 14, 578–597 CrossRef CAS.
- J. van Gerpen, Fuel Process. Technol., 2005, 86, 1097–1107 CrossRef CAS.
- R. G. Egeberg, N. H. Michaelsen and L. Skyum, ERTC Nov, 2009, pp. 9–11 Search PubMed.
- G. W. Huber, P. O'Connor and A. Corma, Appl. Catal., A, 2007, 329, 120–129 CrossRef CAS.
- A. V. Bridgwater, Biomass Bioenergy, 2012, 38, 68–94 CrossRef.
- S. Czernik and A. V. Bridgwater, Energy Fuels, 2016, 590–598 Search PubMed.
- V. Dhyani and T. Bhaskar, Renewable Energy, 2018, 129, 695–716 CrossRef CAS.
- E. D. Revellame, W. E. Holmes, T. J. Benson, A. L. Forks, W. T. French and R. Hernandez, Top. Catal., 2012, 55, 185–195 CrossRef CAS.
- D. Kubička and J. Horáček, Appl. Catal., A, 2011, 394, 9–17 CrossRef.
- S. Verdier, O. F. Alkilde, R. Chopra, J. Gabrielsen and M. Grubb, Haldor Topsoe's Hydroprocessing White Paper, 2019 Search PubMed.
- G. Sengar, P. Kaushal, H. K. Sharma and M. Kau, Rev. Chem. Eng., 2014, 30, 183–198 Search PubMed.
- Y. C. Sharma, M. Yadav and S. N. Upadhyay, Biofuels, Bioprod. Biorefin., 2019, 13, 174–191 CrossRef CAS.
- M. Garcia-Perez, A. Chaala, H. Pakdel, D. Kretschmer and C. Roy, Biomass Bioenergy, 2007, 31, 222–242 CrossRef CAS.
- C. A. Mullen and A. A. Boateng, J. Anal. Appl. Pyrolysis, 2011, 90, 197–203 CrossRef CAS.
- Y. S. Choi, P. A. Johnston, R. C. Brown, B. H. Shanks and K. H. Lee, J. Anal. Appl. Pyrolysis, 2014, 110, 147–154 CrossRef CAS.
- B. Scholze, C. Hanser and D. Meier, J. Anal. Appl. Pyrolysis, 2001, 58–59, 387–400 CrossRef CAS.
- G. Caumette, C.-P. Lienemann, I. Merdrignac, B. Bouyssiere and R. Lobinski, J. Anal. At. Spectrom., 2009, 24, 263–276 RSC.
- G. Caumette, C. P. Lienemann, I. Merdrignac, B. Bouyssiere and R. Lobinski, J. Anal. At. Spectrom., 2010, 25, 1123–1129 RSC.
- G. Gascon, V. Vargas, L. Feo, O. Castellano, J. Castillo, P. Giusti, S. Acevedo, C.-P. Lienemann and B. Bouyssiere, Energy Fuels, 2017, 31, 7783–7788 CrossRef CAS.
- V. Vargas, J. Castillo, R. Ocampo Torres, B. Bouyssiere and C. P. Lienemann, Fuel Process. Technol., 2017, 162, 37–44 CrossRef CAS.
- V. Garcia-Montoto, S. Verdier, Z. Maroun, R. Egeberg, J. L. Tiedje, S. Sandersen, P. Zeuthen and B. Bouyssiere, Fuel Process. Technol., 2020, 201, 106341 CrossRef CAS.
- G. Gascon, J. Negrín, V. G. Montoto, S. Acevedo, C.-P. Lienemann and B. Bouyssiere, Energy Fuels, 2019, 33, 8110–8117 CrossRef CAS.
- G. Gascon, J. Negrin, V. Garcia-Montoto, S. Acevedo, C. P. Lienemann and B. Bouyssiere, Energy Fuels, 2019, 33, 1922–1927 CrossRef CAS.
- S. Verdier, P. Wiwel, J. Gabrielsen and L. F. Østergaard, Haldor Topsoe's Renewable White Paper, 2019 Search PubMed.
- S. H. Tan and G. Horlick, Appl. Spectrosc., 1986, 40, 445–460 CrossRef CAS.
- A. Desprez, B. Bouyssiere, C. Arnaudguilhem, G. Krier, L. Vernex-Loset and P. Giusti, Energy Fuels, 2014, 28, 3730–3737 CrossRef CAS.
- T. Newbold and D. M. Casper, US Pat.Application no. 12/460545, 2009 Search PubMed.
- D. C. Dayton, J. R. Carpenter, A. Kataria, J. E. Peters, D. Barbee, O. D. Mante and R. Gupta, Green Chem., 2015, 17, 4680–4689 RSC.
- O. D. Mante, D. C. Dayton, J. R. Carpenter, K. Wang and J. E. Peters, Fuel, 2018, 214, 569–579 CrossRef CAS.
- D. R. Erickson, Practical Handbook of Soybean Processing and Utilization, Elsevier, 1995, pp. 174–183 Search PubMed.
- S. W. Banks, D. J. Nowakowski and A. v. Bridgwater, Energy Fuels, 2016, 30, 8009–8018 CrossRef CAS.
Footnote |
| † Electronic supplementary information (ESI) available. See DOI: 10.1039/d1ra03470g |
| This journal is © The Royal Society of Chemistry 2021 |

