 Open Access Article
Methane hydrate formation behaviors in high water-cut oil-in-water systems with hydrate promoters
Yan Kele*ab,
Ren Yuemengab,
Lv Chengab,
Xiao Anshanab and
Lv Xiaofang *c
*c
aSINOPEC Qingdao Research Institute of Safety Engineering, Qingdao, China. E-mail: yankl.qday@sinopec.com; lvxiaofang5@cczu.edu.cn; Tel: +86-532-83786440
bState Key Laboratory of Safety and Control for Chemicals, Qingdao, China
cJiangsu Key Laboratory of Oil and Gas Storage & Transportation Technology, School of Petroleum Engineering, Changzhou University, Changzhou, China
First published on 14th September 2021
Abstract
Hydrate slurry transport technology has become a focal point among worldwide researches, due to its high economic efficiency. However, the mechanism and law of hydrate growth kinetics in flow systems were still unclear, especially in high water-cut oil–water systems with hydrate promoters. On this basis, this paper conducted a series of growth kinetic experiments using a high-pressure transparent sapphire cell, and investigated systematically several influencing factors (such as initial pressure, the concentration of emulsifier, hydrate promoter, and the concentration of hydrate promoter) of growth kinetics, and obtained the quantitative relationship between these factors and gas consumption as well as the hydrate growth rate (gas consumption rate). It could be seen from the analysis of these influencing factors that the presence of hydrate promoters can promote hydrate nucleation rapidly and shorten the hydrate induction time, as compared with the (diesel oil + water) system. The concentration of emulsifier is positively correlated with the induction period of hydrate formation, whether it was sodium dodecyl sulfate (SDS) or L-leucine (L-l) systems. The SDS and L-l system could significantly improve the formation kinetics of methane hydrate in the emulsion system, while tetrabutylammonium bromide (TBAB) and polysorbate 80 (Tween80) significantly inhibited the nucleation and growth of methane hydrate in the emulsion. The kinetic curves of hydrate formation showed a trend of first increasing and then gradually decreasing, with the increase of SDS concentrations. However, the hydrate formation kinetics tended to increase gradually and reach equilibrium in the L-l system, with an increase in the concentration of L-l.
1 Introduction
Formation of gas hydrates in systems with high water content is one of the major challenges faced by the petroleum industry today.1 Conventional mitigation using thermodynamic inhibitors is expensive due to large water volumes, while the most recent flow management strategies (anti-agglomerants, cold flow, etc.) have not yet been adopted because the dynamics of hydrate slurry are insufficiently understood.2 Clathrate hydrate formation presents a serious challenge to the petroleum industry. The low temperature and high pressure conditions necessary for hydrate formation between natural gas and water are frequently satisfied in petroleum pipelines. Upon formation, hydrate accumulation and agglomeration ultimately form a plug, blocking the flow through the pipeline.3 These plugs can be costly and dangerous to remove and can lead to a significant loss in production.4As oil and gas are produced from less profitable and/or older wells, there is an increased likelihood of higher water cuts, resulting in more costly inhibition strategies. Various authors have studied hydrate formation from low water cut emulsions with few studies approaching 60 vol% or more.5 The purpose of this work is to increase the understanding of hydrate formation and dissociation from these high water content (>60 vol%) emulsions of water-in-oil (W/O) and oil-in-water (O/W).6 For W/O emulsions, it has been proposed that the hydrate initially forms as shells around water drops. In the model, shells form rapidly first, followed by a slow conversion of the internal, trapped water to hydrate, which is limited by mass transfer of the hydrate guest molecule through the shell.7,8
Hoiland et al.9 have considered the interaction of hydrates and emulsions at high water cuts as they explored how the presence of hydrate particles can promote or delay the inversion of a water-crude oil emulsion (emulsion inversion describes the change in emulsion type from O/W to W/O or vice versa as discussed below). By comparing the water cut at inversion with hydrates to that without hydrates, Hoiland et al.9 predicted the relative wettability of the hydrate particles. The results showed good correlation between the crude oil plugging behavior tested in a flow loop and the experimental wettability; crude oil, which formed oil-wet hydrates (through adsorption of natural components) showed no signs of plugging in the flow loop.
Some researchers10,11 have also investigated the effect of different hydrate promoters on methane hydrate formation in high water-cut systems. Solidified natural gas (SNG) is a new and promising option to store natural gas in the field of natural gas storage and transportation because of several benefits offered that include mild storage and transportation environments, eco-friendliness and so on, compared with conventional gas storage technologies, such as CNG/LNG.12–14 However, the slow hydrate formation rate and low gas storage capacity are the bottlenecks hindering the development of solidified natural gas technology; chemical promoters are an effective way to improve the gas storage efficiency of hydrate.15 However, most of the current studies on the methane hydrate kinetics with chemical promoters are based on pure water systems, and the studies on hydrate in oil–water systems are rarely reported.16,17 The presence of the oil phase in the oil–water system significantly increases the hydrate formation process; part of the research contents have been covered in the earlier paper,18 but the effect of emulsifier on the methane hydrate formation kinetics in oil–water systems is not included.
Studies on hydrate slurry based on absorption-water method have been paid more attention in the field of natural gas storage in recent years;19 the gas storage efficiency can be improved by the absorption of oil to gas and the effective coupling between gas and water to form hydrate. Most of the current studies in this field focus on how to control the slurry which makes the oil–water system stable in order to improve the fluidity, and the starting point of this work is to use high water cut oil–water volume for gas storage, for studying the specific effects of methane hydrate formation kinetics in oil–water systems with the presence of the oil phase, the concentration of emulsifier and the type of promoters.11,18,20,25,36 A systematic study of this field is of great significance to the development of solid hydrate gas storage technology and absorption-water gas storage technology.21
2 Experimental section
2.1 Materials
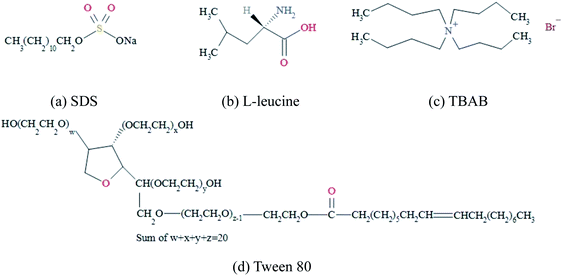
The methane gas with high-purity grade (99.995%) used in this study was manufactured and supplied by Qingdao Heli Gas Co. Ltd. The deionized water used was prepared by twice distilling in our laboratory with a conductivity less than 10−4 S m−1. Diesel oil (Table 1) with a freezing point of 263.2 K is adopted to eliminate the impact of resin and asphaltene compositions in crude oil. The hydrate promoters under test including SDS (99.5% pure), L-l (98% pure), TBAB (99.0% pure) and Tween80 (pharmaceutically pure) were purchased from Shanghai Aladdin Biochemical Technology Co. Ltd. and used without further purification. The chemical structure of these promoters mentioned is shown in Fig. 1. The dosage of these hydrate promoters in this work was set at 0.01%, 0.03%, 0.05% and 0.1% for SDS, 0.1%, 0.3%, 0.5% and 1% for L-l, 0.05% for Tween80, and 0.05% for TBAB, all of which were the weight percent to water.| Component | Mol% | Wt% |
|---|---|---|
| Heptanes | 0.50 | 1.05 |
| Octanes | 0.50 | 0.92 |
| Nonanes | 2.81 | 4.60 |
| Decanes | 7.74 | 11.40 |
| Undecanes | 8.74 | 11.73 |
| Dodecanes | 9.95 | 12.24 |
| Tridecanes | 8.74 | 9.94 |
| Tetradecanes | 6.53 | 6.90 |
| Pentadecanes | 4.92 | 4.86 |
| Hexadecanes | 4.72 | 4.37 |
| Heptadecanes | 5.33 | 4.64 |
| Octadecanes | 6.83 | 5.63 |
| Eicosanes | 14.47 | 10.74 |
| Tetracosanes | 15.78 | 9.77 |
| Octacosanes plus | 2.41 | 1.28 |
| Total | 100.00 | 100.00 |
2.2 Apparatus and procedure
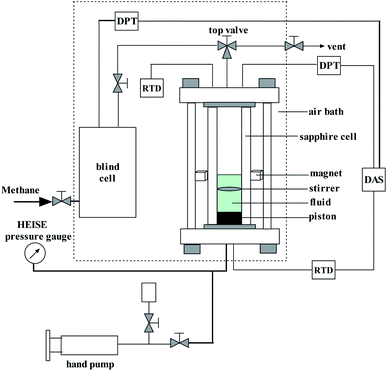
A schematic diagram of the experimental apparatus used for methane hydrate formation and dissociation studies is shown in Fig. 2. The most important parts of the apparatus are a transparent sapphire cell with a diameter of 2.54 cm and an effective volume of 60 cm3, and a steel-made blind cell with an effective volume of 155 cm3. The designed maximum pressure of the sapphire and blind cell is 15 MPa and 25 MPa, respectively. A calibrated Heise pressure gauge and differential pressure transducers are used to measure the system pressure with a precision of ±0.01 MPa. The system temperature is controlled by a humidity chamber with a precision of ±0.1 K, and the temperature sensor used is a secondary platinum resistance thermometer Pt100.Initially, the emulsion was prepared by mixing distilled water, oil and the surfactant combination in a certain proportion in a glass beaker. The volume of the emulsion was 10 mL. The emulsification was performed using an ULTRA TURRAX T-18 homogenizer (dispersator). The surfactant combination includes Span20 + SDS and Span20 + L-l with different concentrations. Before the experiment, the sapphire cell was washed with distilled water and dried, and then loaded with 10 mL of prepared oil–water mixture. Subsequently, the sapphire cell was installed and connected to the blind cell. These two cells were then purged through vacuuming, replacing with methane, and vacuuming in turn. Afterwards, the top valve of the sapphire cell was closed and the blind cell was charged with methane until the desired pressure was achieved. The air bath was set to the experimental temperature. Thereafter, when the sapphire cell system achieved the given temperature and kept at least 1.0 h, the top valve of the sapphire cell was opened, letting the low temperature methane into the sapphire cell. When the pressure of the sapphire cell reached a specified value, the top valve was closed again. The stirrer was turned on at a stirring speed of 60 rpm to promote the hydrate formation. The system pressure dropped rapidly to a stable value, which means that the methane gas reached the dissolved equilibrium into the diesel oil. And then this stable stage may be kept for a period until the gas hydrate formed in the system. Generally, the time interval between the time point when the system reached the thermodynamic equilibrium state and the time point when stable hydrate nucleation occurred could be regarded as induction time. In this work, the time from the injection of methane to the appearance of gas hydrate that was characterized by pressure reduction or temperature increase was defined as the induction time. The pressure variation with the time was recorded with a computer. After 1.0 h from the beginning of the hydrate formation, the experiment was manually stopped and the temperature of the air bath was set to 298.15 K. In this present work, the temperature and initial pressure of all the experiments were set at 276.15 K and 7.0 MPa.
2.3 Experimental data processing
It was reported that the solubility of methane in pure water is much less than that in the oil by an order of magnitude under standard conditions.22 Therefore, the solubility of methane in water was neglected in this work. The methane solubility in oil, S, is defined as
 | (1) |
 | (2) |
The mole number of diesel oil is determined by
 | (3) |
When the methane hydrate appears, the total mole number of methane gas in the sapphire cell contains the residual gas phase and dissolved in the diesel oil,
 | (4) |
With the formation of methane hydrate in the cell, the gas molecules transfer from the gas phase to the hydrate phase, resulting in the pressure drop. Therefore, the gas mole number at time t including the residual gas phase and in the oil can be calculated by
 | (5) |
| Δn = n1 − nt | (6) |
3 Results and discussion
3.1 Methane hydrate formation in high water cut systems
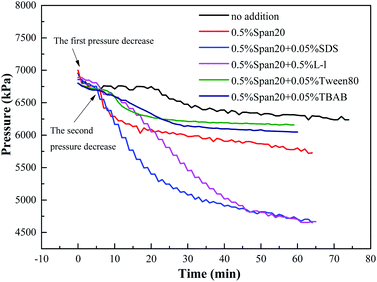
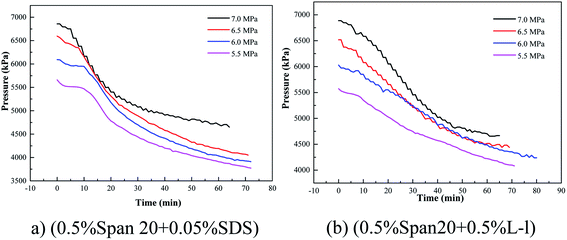
In order to study the effect of initial pressure, temperature and water cut on the formation rate of hydrate slurry in deep-sea operation of multiphase oil and gas pipeline, all the experiments performed in this work were conducted at constant volume and constant temperature, recording the variations of pressure with time, which expressed the formation rate of hydrate slurry. Fig. 3 shows the typical pressure variation curves of different promoters in the oil–water system. Fig. 4–6 show the influence of concentration of promoters, concentration of emulsifier and initial pressure on the pressure variation, respectively. It can be seen from Fig. 3 that there were two sharp decreases in pressure, corresponding to the absorption of methane and hydrate formation, respectively. The initial sharp decrease in pressure demonstrated that the absorption process of methane in the oil reached equilibrium rapidly within 5 min. And then, the pressure remained constant in the cell until the pressure decreased again. The hydrate growth resulted in the pressure drop due to the consumption of gas in the formation process. The second sharp decrease in pressure indicated the formation of methane hydrate.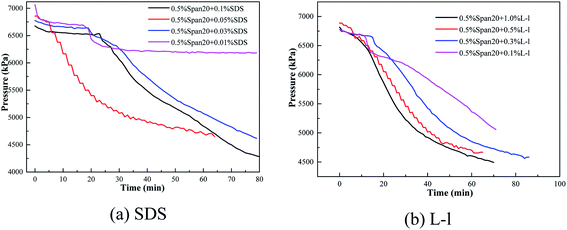 | ||
| Fig. 4 Pressure variations of methane hydrate formation with different promoter concentrations in water–oil systems within an emulsifier. | ||
A high water cut system (up to 30 vol%) was used in this study, which was different from the study of Mu et al.25 But the pressure changes after the system intake were similar between two studies; most test systems had two sharp decreases in pressure, the initial sharp decrease in pressure was the absorption and dissolution of methane gas in the oil phase (it was reported that the solubility of methane in pure water is much less than that in the oil; therefore, the solubility of methane in water was neglected in this work25), and the second sharp decrease in pressure was due to the consumption of gas in the formation process. For example, in a system of 80 vol% (diesel + water), before 30 min, it was the dissolution process of methane in the oil phase, being an obvious dissolution equilibrium stage, and after 30 min, the pressure of the system decreased to 6300 kPa due to the formation of hydrate. However, the two pressure drop stages described in some systems were not obvious as shown in Fig. 3, which means that hydrates appeared in the methane's dissolution stage, leading to a sharp drop in pressure. For example, in the (0.5% Span20 + 0.05% SDS) system, there were no obvious two sharp decreases in pressure and hydrate particles appeared in the system before the gas dissolution equilibrium was reached.
The induction time of hydrate formation and gas consumption at different times in the high water cut system under the condition of different emulsifier concentrations, hydrate promoters, and initial pressure are shown in Table 2.
| Number | Experimental pressure (MPa) | Emulsifier concentrations | Promoter concentrations and types | Induction time (min) | Gas consumption (min) | ||
|---|---|---|---|---|---|---|---|
| t20 | t40 | t60 | |||||
| 1 | 7 | — | — | 22 | 0.0108 | 0.0133 | 0.0153 |
| 2 | 7 | 0.5% Span20 | — | 7.25 | 0.0198 | 0.0238 | 0.0291 |
| 3 | 7 | 0.5% Span20 | 0.05% SDS | 6.0 | 0.0442 | 0.0548 | 0.0609 |
| 4 | 7 | 0.5% Span20 | 0.5% L-l | 5.5 | 0.0309 | 0.0553 | 0.0599 |
| 5 | 7 | 0.5% Span20 | 1% Tween80 | 8.5 | 0.0128 | 0.0139 | 0.0147 |
| 6 | 7 | 0.5% Span20 | 1% TBAB | 4.5 | 0.0151 | 0.0178 | 0.0189 |
![[thin space (1/6-em)]](https://www.rsc.org/images/entities/char_2009.gif) |
|||||||
| Experiment of promoter concentrations | |||||||
| 7 | 7 | 0.5% Span20 | 0.1% SDS | 24 | 0.0342 | 0.0521 | 0.0653 |
| 3 | 7 | 0.5% Span20 | 0.05% SDS | 6.0 | 0.0442 | 0.0548 | 0.0609 |
| 8 | 7 | 0.5% Span20 | 0.033% SDS | 20 | 0.0256 | 0.0447 | 0.0585 |
| 9 | 7 | 0.5% Span20 | 0.01% SDS | 16 | 0.0142 | 0.0153 | 0.0141 |
| 10 | 7 | 0.5% Span20 | 1.0% L-l | 5.0 | 0.0355 | 0.0548 | 0.0619 |
| 4 | 7 | 0.5% Span20 | 0.5% L-l | 5.5 | 0.0309 | 0.0553 | 0.0599 |
| 11 | 7 | 0.5% Span20 | 0.3% L-l | 15 | 0.0277 | 0.0492 | 0.0572 |
| 12 | 7 | 0.5% Span20 | 0.1% L-l | 13 | 0.0156 | 0.0306 | 0.0465 |
![[thin space (1/6-em)]](https://www.rsc.org/images/entities/char_2009.gif) |
|||||||
| Effect of emulsifier concentrations | |||||||
| 13 | 7 | 1.0% Span20 | 0.05% SDS | 8.0 | 0.04627 | 0.05954 | 0.06811 |
| 3 | 7 | 0.5% Span20 | 0.05% SDS | 6.0 | 0.0442 | 0.0548 | 0.0609 |
| 14 | 7 | 0.25% Span20 | 0.05% SDS | 5.0 | 0.0397 | 0.0496 | 0.0534 |
| 15 | 7 | 0.1% Span20 | 0.05% SDS | 5.0 | 0.0356 | 0.0429 | 0.0499 |
| 16 | 7 | 1.0% Span20 | 0.5% L-l | 8.0 | 0.0344 | 0.0531 | 0.0588 |
| 4 | 7 | 0.5% Span20 | 0.5% L-l | 5.5 | 0.0309 | 0.0552 | 0.0599 |
| 17 | 7 | 0.25% Span20 | 0.5% L-l | 5.5 | 0.0305 | 0.0562 | 0.0629 |
| 18 | 7 | 0.1% Span20 | 0.5% L-l | 4.0 | 0.0261 | 0.0506 | 0.0618 |
![[thin space (1/6-em)]](https://www.rsc.org/images/entities/char_2009.gif) |
|||||||
| Effect of initial pressure | |||||||
| 3 | 7 | 0.5% Span20 | 0.05% SDS | 6.0 | 0.0442 | 0.0548 | 0.0609 |
| 19 | 6.5 | 0.5% Span20 | 0.05% SDS | 6.5 | 0.034 | 0.0501 | 0.0586 |
| 20 | 6 | 0.5% Span20 | 0.05% SDS | 8.5 | 0.0349 | 0.0496 | 0.0567 |
| 21 | 5.5 | 0.5% Span20 | 0.05% SDS | 9.5 | 0.0314 | 0.0416 | 0.0478 |
| 4 | 7 | 0.5% Span20 | 0.5% L-l | 5.5 | 0.0309 | 0.0553 | 0.0599 |
| 22 | 6.5 | 0.5% Span20 | 0.5% L-l | 7 | 0.0273 | 0.0462 | 0.0537 |
| 23 | 6 | 0.5% Span20 | 0.5% L-l | 9 | 0.0174 | 0.0342 | 0.0441 |
| 24 | 5.5 | 0.5% Span20 | 0.5% L-l | 9 | 0.0179 | 0.0281 | 0.0361 |
According to Table 2, compared with the system without emulsifiers and hydrate promoters, the addition of emulsifiers and hydrate promoters both can promote the hydrate nucleation and shorten the hydrate induction time. For example, the hydrate induction time was 22 min in the pure (diesel + water) system and 7.5 min in the (diesel + water + 0.5% Span20) system, while less than 7 min (except Tween80) in the (diesel + water + 0.5% Span20 + promoters) system; in the 1.0% TBAB system, the hydrate induction time was 4.5 min, which might be because TBAB was a thermodynamic promoter which can reduce the hydrate formation conditions, and thus the induction time of hydrate formation was shorter.
3.2 Methane consumption in high water cut systems with different kinds of hydrate promoters
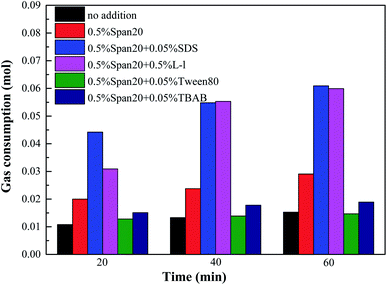
Gas consumption in high water cut systems with different kinds of hydrate promoters was shown in Fig. 7. The appearance of white hydrate particles in the system was shown as the origin, and the gas consumption first increased sharply and then tended to be stable with the continuous hydrate formation, the gas consumption first increased sharply and then tended to be stable. In addition, with the addition of emulsifiers and hydrate promoters, the hydrate formation kinetics were significantly improved, and the best promotion effect was obtained under the same conditions in the system containing 0.05% SDS and 0.5% L-l. Meanwhile, the experiment also found that, compared with the system of (diesel + water + emulsifier), the addition of SDS/L-l/Tween80/TBAB had different effects on the methane hydrate formation kinetics; SDS/L-l can significantly improve the methane hydrate formation kinetics in the emulsion system, while Tween80 and TBAB can inhibit the methane hydrate formation in the emulsion system.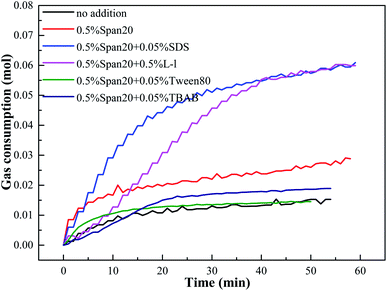 | ||
| Fig. 7 Gas consumption in the process of methane hydrate formation with different kinds of promoters. | ||
In order to compare the promotion effect at different experimental stages in detail, the comparison of gas consumption at 20 min, 40 min and 60 min of hydrate formation is shown in Fig. 8. According to Fig. 8, the gas consumption was the highest in both (0.5% Span20 + 0.05% SDS) and (0.5% Span20 + 0.5% L-l) systems, indicating that the two systems had a faster hydrate formation rate. For example, when the experiment was carried out for 40 minutes, the gas consumption of (0.5% Span20 + 0.05% SDS) and (0.5% Span20 + 0.5% L-l) was as high as 0.0548 mol and 0.0553 mol, while that of the 0.5% Span20 alone was 0.0198 mol, and that of the system of (0.5% Span20 + 1.0% TBAB) and (0.5% Span20 + 1.0% TBAB) was only 0.0128 mol and 0.0121 mol.
 | ||
| Fig. 8 Comparison of gas consumption in different stages of methane hydrate formation in high water cut systems. | ||
Considering that SDS and L-l can promote the methane hydrate formation kinetics in an oil–water emulsion, therefore, these two promoters will be the focus of the study; the following will focus on the effects of methane hydrate formation kinetics in the emulsion system with the hydrate promoter concentrations, emulsifier concentrations and initial pressure.
3.3 Effect of the concentration of hydrate promoter on the hydrate formation
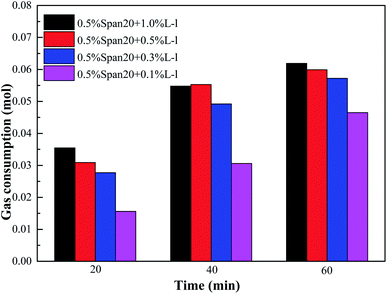
Variation of gas consumption with different promoter concentrations on methane hydrate formation is shown in Fig. 9, and the concentrations of SDS were 0.1%, 0.05%, 0.03% and 0.01%, while those of the L-l were 1.0%, 0.5%, 0.3% and 0.1%, respectively, and the emulsifier concentration was 0.5% Span20, and the temperature and initial pressure of all the experiments were set at 276.15 K and 7.0 MPa.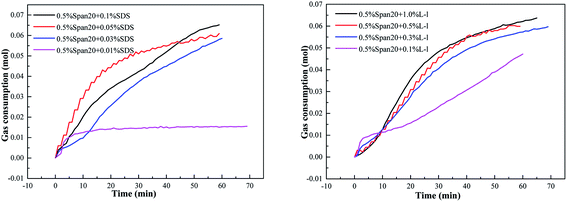 | ||
| Fig. 9 Variations of gas consumption with different promoter concentrations with methane hydrate formation (a: SDS ;b: L-l ). | ||
The initial concentration of SDS/L-l had different effects on the induction time of hydrate formation in the emulsion system shown in Table 2. For the SDS system, with the increase of SDS concentration (the critical micellar concentration (CMC) of SDS water solution is 242 ppm under hydrate-forming conditions), the induction time of hydrate formation showed a trend of first gradually shortening and then increasing; 0.05% concentration had the best promotion effect and the shortest time, only 6.0 min; however, when the concentration increased to 0.1%, the induction time was as long as 24 min, even longer than that in the (diesel + water + no addition) system. For the L-l system, when the concentration was less than 0.5%, the induction time of hydrate formation was more than 10 min, while with the concentration of 0.5% and 1.0%, the induction time was only about 5.0 min.
The initial concentration of SDS/L-l had a great influence on the methane hydrate formation kinetics in the emulsion system as shown in Fig. 9. According to Fig. 9(a), with the increase of SDS concentration, the curve of hydrate formation kinetics showed a trend of first increasing and then gradually decreasing, and was the fastest with the 0.05% concentration. However, in the L-l system, with the increase of L-l concentration, the curve of hydrate formation kinetics showed a trend of gradually increase and then equilibrium, and the hydrate formation kinetics was similar under the concentration of 0.3%, 0.5% and 1.0%.
The comparison of gas consumption of systems with different concentrations of SDS/L-l at different stages (t20, t40 and t60) is shown in Fig. 10 and Fig. 11. The order of gas consumption at t20 and t40 was 0.05% SDS > 0.1% SDS > 0.03% SDS > 0.01% SDS as shown in Fig. 10, but at t60, the gas consumption was similar when the SDS concentration is 0.1%, 0.05% and 0.03% and much larger than that under the 0.01% concentration. It meant that although the concentration in the early stage of hydrate formation had a great influence on the hydrate formation kinetics, there was little difference in gas consumption when the experiment was carried out for 60 min; for example, at t20, the corresponding order of gas consumption was 0.05% SDS (0.0442 mol) > 0.1% SDS (0.0342 mol) > 0.03% SDS (0.0256 mol) > 0.01% SDS (0.0142 mol), when the experiment was carried out for 60 min; the corresponding gas consumption was 0.0653 mol, 0.0609 mol and 0.0585 mol at 0.1% SDS, 0.05% SDS and 0.03% SDS, respectively. In addition, the experimental results also showed that when the concentration of SDS was 0.01%, its promoting effect on methane hydrate was limited and reached equilibrium, and when the experiment was carried out for 20 min, the corresponding gas consumption at t20, t40 and t60 showed little difference.
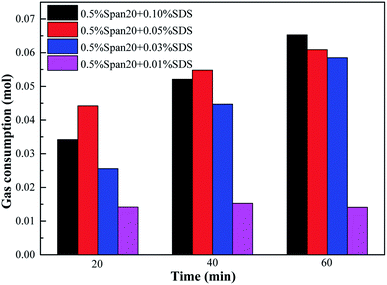 | ||
| Fig. 10 Comparison of gas consumption with the SDS system in different experimental stages of hydrate formation. | ||
Fig. 11 shows that gas consumption gradually increased with the increase of L-l concentrations, and the corresponding gas consumption of each system gradually increased with the progress of the experiment. However, when the experiment was carried out for 60 min, the corresponding gas consumption was relatively close with the concentration of 1.0%, 0.5% and 0.3%. For example, at t20, the corresponding order of gas consumption was 1.0% L-l (0.0355 mol) >0.5% L-l (0.0309 mol) >0.3% L-l (0.0277 mol) >0.1% L-l (0.0156 mol), when the experiment was carried out for 60 min, the corresponding gas consumption was 0.0619 mol, 0.0599 mol and 0.0577 mol with the concentration of 1.0%, 0.5% and 0.3%, respectively, and the gas consumption was relatively close.
The reason why SDS and L-l present different phenomena of different induction time and hydrate formation kinetics in the emulsion system was that SDS and L-l have different promotion mechanisms on hydrate formation; SDS is a good surfactant, which can promote hydrate formation mainly by reducing gas–liquid interfacial tension;26 in addition, Lin et al.27 found that SDS showed the best promotion effect at a concentration of 0.06%; excessive concentration had no obvious continuous enhancement effect on hydrate formation kinetics, and this paper also proved that the concentration of 0.05% is a more appropriate concentration for the promotion effect.
While L-l is an amino acid hydrate surfactant, Liu et al.28 found that L-l was a good promoter for the bubble-free hydrate decomposition; although its hydrate promotion effect is slightly lower than that of SDS, L-l decomposition is bubble-free and eco-friendly, and the promotion mechanism of amino acid surfactant is different from that of SDS. Chen et al.29 believed that compared with the pure water system, the L-l system had significantly shorter hydrate formation time and faster growth rate; a comparison on the change of L-l molecule position and the hydrate formation system potential energy was performed, L-l tended to adsorb on the gas–liquid interface and hydrate surface, and disturbance was formed on the gas–liquid interface-hydrate surface – gas–liquid interface, which was shown as the rise of system potential energy, and then the potential energy dropped sharply until the completion of hydrate layer growth, further demonstrating the positive effect of surface adsorption on methane hydrate formation. Therefore, its mechanism of promotion is quite different from that of SDS.
3.4 Effect of the concentration of the emulsifier on the hydrate formation
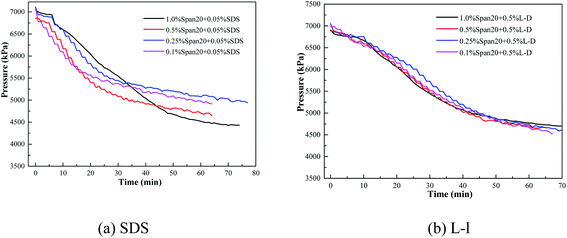
The effect of emulsifier concentration on the methane hydrate formation kinetics of the SDS/L-l system is shown in Fig. 12. The emulsifier is Span20 and the concentrations are 1.0%, 0.5%, 0.25% and 0.1%, respectively.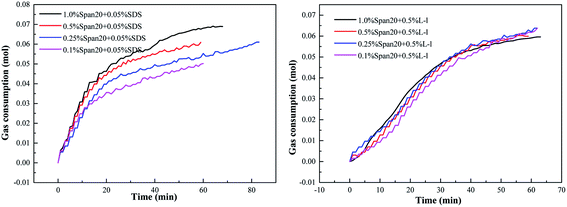 | ||
| Fig. 12 Variations of gas consumption with different emulsifier concentrations on hydrate formation (a: SDS ;b: L-l ). | ||
The concentration of Span20 had a similar effect on the hydrate formation induction time in the oil–water emulsion with SDS/L-l as shown in Table 2. With the increase of emulsifier concentration, the hydrate induction time gradually increased, which was similar to the research results of Chen et al.30 For example, when the emulsifier concentration increased from 0.1% to 1.0%, the induction time of the oil–water emulsion with 0.05% SDS increased from 5.0 min to 8.0 min, while that of the oil–water emulsion with 0.5%L-l increased from 4.5 min to 8.0 min.
Meanwhile, Table 2 also shows that the concentration of emulsifier played a significant role in the hydrate induction time. When the emulsifier concentration was constant, whether it was the SDS or L-l system, the hydrate induction time was similar; for example, under the same condition of 1.0% Span20, the hydrate induction time of the systems of (1.0% Span20 + 0.05% SDS) and (1.0% Span20 + 0.5% L-l) was 8.0 min, and that of the systems of (0.25% Span20 + 0.05% SDS) and (0.25% Span20 + 0.5% L-l) was about 5.5 min. It can be seen that in the emulsion system, the presence of the emulsifier had a great effect on the hydrate formation induction time.
But the reason for the inverse ratio of emulsifier concentrations and hydrate induction time can be attributed to the strong emulsification, with the increase of emulsifier concentrations, both the oil–water emulsion and the droplets in the system are more uniform, which means that methane has a greater solubility in the system, resulting in a longer and more uniform dissolution process, leading to a longer hydrate formation induction time.
The effect of emulsifier concentrations on the hydrate formation kinetics of the system with SDS/L-l is shown in Fig. 12. According to Fig. 12, the emulsifier concentrations had different mechanisms of methane hydrate formation kinetics in the system with SDS/L-l; according to Fig. 12(a), the emulsifier concentrations had a great influence on the SDS system; with the increase of the emulsifier concentration, the methane hydrate formation kinetic rate gradually increased, which was 1.0% Span20 > 0.5% Span20 > 0.25% Span20 > 0.1% Span20. According to Fig. 12(b), the emulsifier concentrations had no obvious influence on the hydrate formation kinetics of the system with L-l; the kinetic curves of the four groups almost coincided within the range of the four emulsifier concentrations.
The comparison of gas consumption at different stages in each system is shown in Fig. 13 and 14. According to Fig. 13, the order of methane hydrate gas consumption under different emulsifier concentrations was 1.0% Span20 > 0.5% Span20 > 0.25% Span20 > 0.1% Span20; for example, at t40, the gas consumption under different emulsifier concentrations was 0.05954 mol, 0.0548 mol, 0.0496 mol and 0.0429 mol, respectively. However, in the emulsion system with 0.5% L-l, the concentrations of emulsifier had little influence on the gas consumption, and it was almost the same in each stage; for example, at t40, the gas consumption was 0.0531 mol, 0.0552 mol, 0.0562 mol, and 0.0506 mol under different emulsifier concentrations.
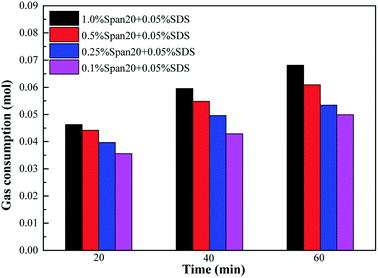 | ||
| Fig. 13 Comparison of gas consumption at different stages of methane hydrate formation with 0.05% SDS under different emulsifiers. | ||
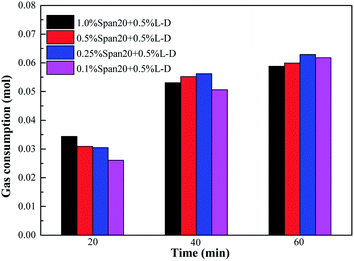 | ||
| Fig. 14 Comparison of gas consumption at different stages of methane hydrate formation with 0.5% L-l under different emulsifiers. | ||
The reasons for the different effects of emulsifier concentrations on the dynamics containing SDS and L-l can be summarized as follows: SDS and L-l promote methane hydrate differently, because SDS is a surfactant and can interact with Span20 for the purpose of synergistic emulsification; with the increase of emulsifier concentrations, the system emulsification degree was enhanced and gas–liquid reaction was more sufficient, thus effectively enhancing the hydrate formation kinetics, while the L-l had different mechanisms of hydrate promotion, and Span20 had limited effect on the hydrate formation kinetics; therefore, with the increasing emulsifier concentrations, the induction time will be reduced gradually in the hydrate nucleation stage due to the emulsification degree enhanced. However, L-l still played a major role in the hydrate formation stage. Therefore, the increase of the emulsifier concentrations had no significant influence on the formation kinetics.31
SDS has the surfactant promoting mechanism, reducing the gas–liquid interfacial tension and increasing the methane solubility, thus improving the hydrate formation rate, while the L-l has the active site adsorption mechanism; therefore, controlling the concentrations of L-l unchanged and changing the emulsifier concentrations can only promote the hydrate nucleation and shorten the induction time, but L-l had limited effect on the hydrate formation kinetics, which was also a major discovery of this paper. In fact, the hydrate promoting mechanism of L-l was non-surfactant type confirmed in some sense.
3.5 Effect of initial pressure on the methane hydrate formation with hydrate promoters
The effect of different initial pressures on the methane hydrate formation kinetics of the SDS/L-l system is shown in Fig. 15. The emulsifier was Span20 and the concentration of SDS and L-l was 0.05% and 0.5%, and the initial pressure was 7.0 MPa, 6.5 MPa, 6.0 MPa and 5.5 MPa respectively.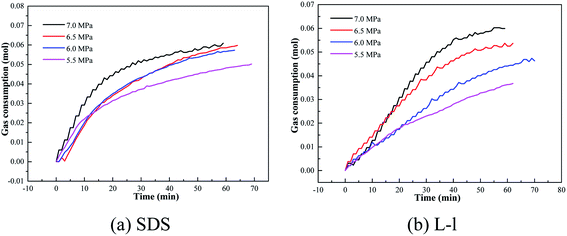 | ||
| Fig. 15 Variation of gas consumption with different initial pressures containing methane hydrate promoters. | ||
According to Table 2, the initial pressure had a similar effect on the induction time of hydrate formation in the oil–water emulsion system containing SDS/L-l; with the decrease of initial pressure, the induction time gradually increased because the lower initial pressure meant the less driving force of hydrate formation, which led to a longer hydrate induction time; for example, when the initial pressure was 7.0 MPa, the hydrate formation induction time in the oil–water emulsion system containing 0.05% SDS and 0.5% L-l was only 6.0 min and 5.5 min, while when the initial pressure dropped to 5.5 MPa, the induction time of hydrate formation increased to 9.5 min and 9.0 min.
Variation of gas consumption on methane hydrate formation with different initial pressures containing 0.05% SDS and 0.5% L-l is shown in Fig. 15, 16 and 17 which showed the comparison of gas consumption when the hydrate was formed to 20 min, 40 min, and 60 min. According to Fig. 15–17, with the decrease of initial pressure, the methane hydrate promotion kinetics of both 0.05% SDS and 0.5% L-l systems gradually decreased, and the corresponding gas consumption gradually decreased. For example, when the initial pressure decreased from 7.0 MPa to 5.5 MPa at 40 min of the experiment, the gas consumption of the 0.05% SDS system decreased from 0.0548 mol to 0.0416 mol and that of the 0.5% L-l system decreased from 0.0553 mol to 0.0281 mol.
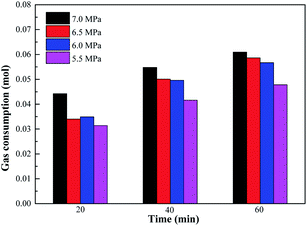 | ||
| Fig. 16 Comparison of gas consumption on methane hydrate formation with different initial pressures containing 0.05% SDS. | ||
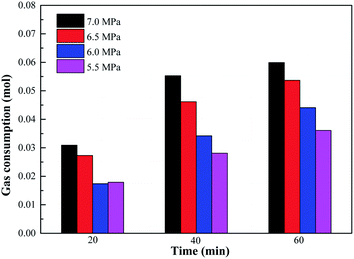 | ||
| Fig. 17 Comparison of gas consumption on methane hydrate formation with different initial pressures containing 0.5% L-l. | ||
3.6 Morphological characteristics of the oil–water system with different hydrate promoters
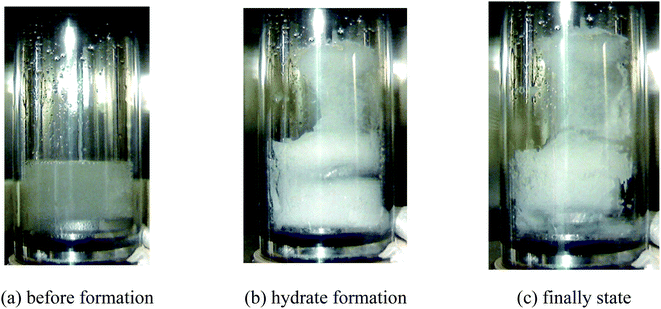
The morphological characteristics of hydrate formation in different promoter systems were compared and analyzed. According to Fig. 18, in the (diesel + water) system, the emulsification effect was poor without the addition of any surfactant. The oil phase existed within the water phase in the form of larger particles even with stirring, and part of the water phase stuck to the wall of the gas-phase pipe. Hydrates began to appear on the gas-phase wall, which then were induced by the pipe to the gas–liquid interface, resulting in hydrate formation inside the reactor occupying a large area. Hydrates in the bulk phase in the sapphire reactor appeared to be relatively soft and mushy. It can also be observed that the oil phase was wrapped into the paste hydrate structure. At the end of hydrate formation, there was no free oil phase in the bulk phase, which might be caused by the porous structure of hydrate and the initial hydrate film that wrapped part of the oil phase.The morphological characteristics of methane hydrate formation in the (diesel + water + emulsifier + promoter) system are shown in Fig. 19. In the presence of the emulsifiers, the system presented a uniform white water-in-oil emulsion before hydrate formation, and the oil phase in the form of small droplets dispersed inside the water phase, unlike the (diesel + water) system, and solid hydrate particles initially formed at the gas–liquid interface, and the appearance of hydrate appeared in the macroscopic form of large particles produced by instantaneous explosion, which may be related to the hydrate formation kinetics promoted rapidly by emulsions and promoters. And then, some hydrate particles accumulated on the wall of the gas phase with stirring, and a large number of hydrate particles stuck together in the main liquid phase, so that the agitator cannot start normally. However, with the help of hydrate promoters and capillary attraction inside the porous structure of the hydrate, the unreacted water phase grew along the wall of the tube, and the overall structure was relatively fluffy, so that the conversion rate of the water phase in the system was relatively high.
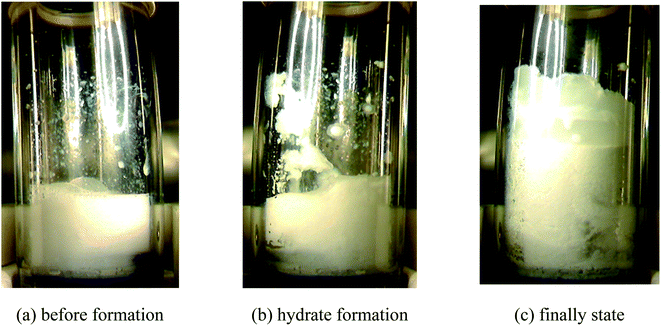 | ||
| Fig. 19 Morphological evolution of the (20 vol% diesel oil + 80 vol% water + 0.5% Span20 + 0.05% SDS) system. | ||
The macro morphology comparison of methane hydrate in the (diesel + water + emulsifier + SDS/Tween80/TBAB) system and (diesel + water + emulsifier + L-l) system after heating decomposition is shown in Fig. 20. According to Fig. 20(a), a large number of bubbles were generated after hydrate decomposition in the (diesel + water + emulsifier + SDS/Tween80/TBAB) system, compared to the emulsion before it was formed, the system was filled with a lot of bubbles; maybe, numerous bubbles were still stored in the emulsion system after the solid hydrate filled with the reaction. According to Fig. 20(b), there was no obvious bubble in the hydrate decomposition process, showing a uniform white emulsion, and the reason for this phenomenon was related to the promotion mechanism and decomposition mechanism of the amino acid hydrate promoter.32
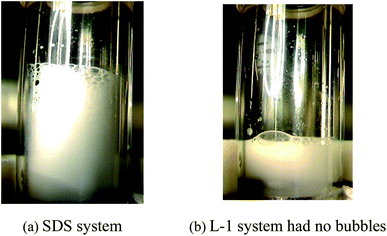 | ||
| Fig. 20 Morphological comparison of hydrate after dissociation in the presence of SDS and L-l (a: SDS system; b: L-1 system had no bubbles). | ||
The promotion effect of L-l may come from its surface activity and surface adsorption.33 Visual observations of methane hydrate growth in the quiescent water/methane system disclosed the formation of a rigid hydrate film at the liquid/gas interface, which would hinder further hydrate formation. In contrast, L-leucine, a typical amphiphilic molecule composed of hydrophilic amine and carboxylic acid groups, along with a hydrophobic aliphatic isobutyl side chain,34 can act as a surfactant to prevent hydrate particles from agglomerating, but to form a rigid hydrate film at the liquid/gas interface instead. As such, the hydrate nucleation begins from the liquid/gas interface close to the reactor wall, where the temperature is the lowest due to the coolant circulation. Finally, methane hydrate grows as a porous structure on the reactor wall, and liquid migrates from the bulk phase to the porous structure due to capillary forces.35 In comparison with L-leucine, L-valine (0.5 wt%) with a lower surface activity shows a slightly lower gravimetric capacity. However, L-isoleucine (0.5 wt%) with an apparent lower surface activity shows a similar gravimetric capacity to L-leucine at the same concentration; this means that there must be other factors involved in promoting the formation of a methane hydrate.36 The exact promotion mechanism remains elusive and needs further investigation. The enhancement of L-leucine was achieved by capillary attraction, rather than by the reduction of the gas–liquid interfacial tension.
4 Conclusions
Through the effects of hydrate promoters on induction time and formation kinetics in high water cut slurry, the results showed that.(1) Compared with the (diesel + water) system, the presence of hydrate promoters can promote the hydrate nucleation rapidly and shorten the hydrate induction time;
(2) SDS/L-l showed a better effect of promoting the growth of hydrate, which could significantly improve the formation kinetics of methane hydrate in the emulsion system, while Tween80 and TBAB inhibited the formation of methane hydrate in the emulsion to some extent.
(3) The initial concentrations of SDS/L-l had great influence on the methane hydrate formation kinetics in the emulsion system. With the increase of SDS concentrations, the kinetic curves of hydrate formation showed a trend of first increasing and then gradually decreasing, and the highest increasing rate was with the concentration of 0.05%, while in the L-l system, with the increase of L-l concentrations, the hydrate formation kinetics tended to increase gradually and reach equilibrium.
(4) With the increase of emulsifier concentrations, whether it was SDS or L-l systems, the hydrate induction time gradually increased, which might be because increase of emulsifier concentration meant that the degree of oil and water emulsification was stronger and the solubility was higher; when the emulsifier concentration was constant, whether it was the SDS or L-l system, the hydrate induction time was similar. In addition, it was found that the change of emulsifier concentrations had no obvious influence on the hydrate formation kinetics in the L-l system.
(5) The initial pressure had a similar effect on the induction time of hydrate formation in the oil–water emulsion system containing SDS/L-l. With the decrease of initial pressure, the induction time increased gradually, and lower initial pressure meant less driving force on hydrate formation, resulting in longer hydrate induction time.
(6) Compared with the (diesel + water) system, before the hydrate formation, the system presented a uniform white oil-in-water emulsion, and solid hydrate particles were initially formed at the gas–liquid interface. Moreover, the appearance of hydrate showed the macroscopic form of large particles produced by instantaneous explosion, which may be related to the hydrate formation kinetics promoted rapidly by emulsions and promoters. In addition, the decomposition of methane hydrate in the systems containing SDS and L-l had different macroscopic forms, and no obvious bubbles appeared in the systems containing L-l. This phenomenon was related to a unique mechanism, and the adsorption-capillary force, more easily aided adsorption on the surface of hydrate. Based on the findings of this work, SDS and L-l show a better promotion performance on hydrate formation, which provides meaningful information for the promising hydrate-based gas storage technology.
Conflicts of interest
There are no conflicts to declare.Acknowledgements
This research was financially funded by the National Natural Science Foundation of China (Grant No. 51904330) and the Research Project Fund of SINOPEC (Grant No. A-535).References
- L. Mu, S. Li and Q. L. Ma, et al., Experimental and modeling investigation of kinetics of methane gas hydrate formation in water-in-oil emulsion, Fluid Phase Equilib., 2014, 362, 28–34 CrossRef CAS.
- W. Wang, Y. Li, S. Fan and D. Liang, Hydrate inhibiting policy based on risk management for oil and gas pipelines, Nat. Gas Ind., 2010, 30(10), 69–72 Search PubMed.
- W. Q. Li, J. Gong and X. F. Lv, et al., A study of hydrate plug formation in a subsea natural gas pipeline using a novel high-pressure flow loop, Pet. Sci., 2013, 10(1), 97–105 CrossRef CAS.
- Z. M. Aman, K. Olcott and K. Pfeiffer, et al., Surfactant adsorption and interfacial tension investigations on cyclopentane hydrate, Langmuir, 2013, 29, 2676–2682 CrossRef CAS PubMed.
- E. D. Sloan, Clathrate hydrate of natural gases, Marcel Dekker Inc., New York, 2nd edn, 1997 Search PubMed.
- A. Majid, D. T. Wu and C. A. Koh, New in situ measurements of the viscosity of gas clathrate hydrate slurries formed from model water-in-oil emulsions, Langmuir, 2017, 33, 11436–11445 CrossRef CAS PubMed.
- J. Gong, B. H. Shi and J. K. Zhao, Natural gas hydrate shell model in gas-slurry pipeline flow, J. Nat. Gas Chem., 2010, 19(3), 261–263 CrossRef CAS.
- B. H. Shi, J. Gong and C. Y. Sun, et al., An inward and outward natural gas hydrates growth shell model considering intrinsic kinetics, mass and heat transfer, Chem. Eng. J., 2011, 171(3), 1308–1316 CrossRef CAS.
- K. Erstad, S. Hoiland and P. Fotland, et al., Influence of petroleum acids on gas hydrate wettability, Energy Fuels, 2009, 23(2), 1359 Search PubMed.
- H. P. Veluswamy, Q. W. Hong and P. Linga, Morphology Study of Methane Hydrate Formation and Dissociation in the Presence of Amino Acid, Cryst. Growth Des., 2016, 16, 5932–5945 CrossRef CAS.
- K. L. Yan, C. Y. Sun and J. Chen, et al., Flow characteristics and rheological properties of natural gas hydrate slurry in the presence of anti-agglomerant in a flow loop apparatus, Chem. Eng. Sci., 2014, 106, 99–108 CrossRef CAS.
- H. P. Veluswamy, A. Kumar and Y. Seo, et al., A review of solidified natural gas technology for gas storage via clathrate hydrates, Appl. Energy, 2018, 216, 262–285 CrossRef CAS.
- H. P. Veluswamy, S. Kumar and R. Kumar, et al., Enhanced clathrate hydrate formation kinetics at near ambient temperatures and moderate pressures: Application to natural gas Storage, Fuel, 2016, 182, 907–919 CrossRef CAS.
- H. P. Veluswamy, A. J. H. Wong and P. Babu, et al., Rapid methane hydrate formation to develop a cost effective large scale energy storage system, Chem. Eng. J., 2016, 290, 161–173 CrossRef CAS.
- A. K. Y. Raman, S. Koteeswaran and D. Venkataramani, et al., A comparison of the rheological behavior of hydrate forming emulsions stabilized using either solid particles or a surfactant, Fuel, 2016, 179, 141–149 CrossRef.
- N. J. Kim, S. S. Park and S. W. Shin, et al., An experimental investigation into the effects of zeolites on the formation of methane hydrates, Int. J. Energy Res., 2015, 39(1), 26–32 CrossRef CAS.
- S. Fan, L. Yang and Y. Wang, et al., Rapid high capacity methane storage in clathrate hydrates using surfactant dry solution, Chem. Eng. Sci., 2014, 106, 53–59 CrossRef CAS.
- M. C. Zi, D. Y. Chen and J. Wang, et al., Kinetic and rheological study of methane hydrate formation in water-in-oil emulsion: effects of emulsion composition and silica sands, Fuel, 2019, 255, 115708 CrossRef CAS.
- H. Liu, L. Mu and B. Liu, et al., Experimental Studies of the Separation of C2 Compounds from CH4+C2H4+C2H6+N2 Gas Mixtures by an Absorption-Hydration Hybrid Method, Ind. Eng. Chem. Res., 2013, 52(7), 2707–2713 CrossRef CAS.
- H. Liu, L. Mu and B. Wang, et al., Separation of ethylene from refinery dry gas via forming hydrate in W/O dispersion system, Sep. Purif. Technol., 2013, 116(37), 342–350 CrossRef CAS.
- M. Pedchenko, L. Pedchenko and T. Nesterenko, et al., Technological Solutions for the Realization of NGH-Technology for Gas Transportation and Storage in Gas Hydrate Form, Solid State Phenom., 2018, 277, 123–136 Search PubMed.
- H. L. Flanagan, P. L. Bolden and A. D. King, The solubility of argon, methane, and ethane in an oil/water microemulsion at 25°C, J. Colloid Interface Sci., 1986, 109(1), 243–248 CrossRef CAS.
- Y. X. Zuo and T. M. Guo, Extension of the Patel–Teja equation of state to the prediction of the solubility of natural gas in formation water, Chem. Eng. Sci., 1991, 46(12), 3251–3258 CrossRef CAS.
- K. Aris, M. Kostis and S. Sofia, et al., Methane hydrocarbon interaction parameters correlation for the Peng–Robinson and the t-mpr equation of state, Fluid Phase Equilib., 1995, 112(1), 33–44 CrossRef.
- L. Mu, S. Li and Q. L. Ma, et al., Experimental and modeling investigation of kinetics of methane gas hydrate formation in water-in-oil emulsion, Fluid Phase Equilib., 2014, 362, 28–34 CrossRef CAS.
- G. Nimalan and R. Amin, The effect of hydrotropes on gas hydrate formation, J. Pet. Sci. Eng., 2003, 40, 37–46 CrossRef.
- S. Y. Lin, R. Y. Tsay and Y. C. Lin, et al., Mass transport of SDS and AOT solutions during a rapid surface expansion: Relaxation of surface tension, J. Taiwan Inst. Chem. Eng., 2020, 108, 23–28 CrossRef CAS.
- H. Liu, L. Mu and B. Wang, et al., Separation of ethylene from refinery dry gas via forming hydrate in W/O dispersion system, Sep. Purif. Technol., 2013, 116, 342–350 CrossRef CAS.
- Y. C. Chen, B. H. Shi and Y. Liu, et al., In situ viscosity measurements of a cyclopentane hydrate slurry in waxy water-in-oil emulsions, Energy Fuels, 2019, 33, 2915–2925 CrossRef CAS.
- C. Chen, X. Li and Y. Chen, Kinetics of methane clathrate hydrate formation in water-in-oil emulsion, Energy Fuels, 2015, 29, 2277–2288 CrossRef.
- J. S. Zhang, S. Lee and J. W. Lee, Kinetics of Methane Hydrate Formation from SDS Solution, Ind. Eng. Chem. Res., 2007, 46, 6353–6359 CrossRef CAS.
- M. Pedchenko, L. Pedchenko and T. Nesterenko, et al., Technological Solutions for the Realization of NGH-Technology for Gas Transportation and Storage in Gas Hydrate Form, Solid State Phenom., 2018, 277, 123–136 Search PubMed.
- Y. Liu, B. Chen and Y. Chen, et al., Methane Storage in a Hydrated Form as Promoted by leucines for Possible Application to Natural Gas Transportation and Storage, Energy Technol., 2015, 3, 815–819 CrossRef CAS.
- M. R. Shirts, J. W. Pitera and W. C. Swope, et al., Extremely precise free energy calculations of amino acid side chain analogs: Comparison of common molecular mechanics force fields for proteins, J. Chem. Phys., 2003, 119(11), 5740–5761 CrossRef CAS.
- A. Kumar, G. Bhattacharjee and B. D. Kulkarni, et al., Role of Surfactants in Promoting Gas Hydrate Formation, Ind. Eng. Chem. Res., 2015, 54, 12217–12232 CrossRef CAS.
- E. B. Webb, C. A. Koh and M. W. Liberatore, High pressure rheology of hydrate slurries formed from water-in-mineral oil emulsions, Ind. Eng. Chem. Res., 2014, 53, 6998–7007 CrossRef CAS.
| This journal is © The Royal Society of Chemistry 2021 |

