 Open Access Article
Photocatalytic degradation of unsymmetrical dimethylhydrazine on TiO2/SBA-15 under 185/254 nm vacuum-ultraviolet†
Yuanzheng Huang ,
Ying Jia*,
Ruomeng Hou,
Zhiyong Huang,
Keke Shen,
Guofeng Jin and
Li'an Hou
Xi'an High Technology Institute, Xi'an 710025, China. E-mail: jysx603@yeah.net
First published on 9th July 2021
Abstract
In this work, TiO2/SBA-15 was synthesized via an in situ hydrothermal method and was used for vacuum-ultraviolet (VUV) photocatalytic degradation of unsymmetrical dimethylhydrazine (UDMH) for the first time. Compared with photocatalysis under UV irradiation, VUV photocatalysis exhibited higher photodegradation efficiency due to the synergetic effect of direct photolysis, indirect photooxidation and photocatalytic oxidation. The synthesized TiO2/SBA-15 catalysts exhibited ordered mesoporous structure and anatase phase TiO2. Titanium content, initial pH and substrate concentration impacted degradation efficiency of UDMH in the VUV photocatalysis process. Among the prepared catalysts, TiO2/SBA-15 with the molar ratio of Ti/Si = 1![[thin space (1/6-em)]](https://www.rsc.org/images/entities/char_2009.gif) :
:![[thin space (1/6-em)]](https://www.rsc.org/images/entities/char_2009.gif) 3 (TS-2) showed the best photocatalytic activity under VUV light, with the rate constant of 0.02511 min−1, which is 1.91 times that with VUV/P25. The superior photocatalytic activity of TS-2 is mainly related to the good balance between the specific surface area and TiO2 contents. The photodegradation efficiency decreases with the increase in the initial UDMH concentration and the maximum degradation rate was obtained at pH 9.0. In the VUV/TS-2 process, ˙OH played a more important role in the degradation of UDMH than ˙O2− and the degradation pathways contained bond breaking, amidation, isomerisation and oxidation reactions. The TS-2 also showed good reusability with the rate constant maintained at above 90% after five cycles and exhibited satisfactory degradation efficiency in tap water.
3 (TS-2) showed the best photocatalytic activity under VUV light, with the rate constant of 0.02511 min−1, which is 1.91 times that with VUV/P25. The superior photocatalytic activity of TS-2 is mainly related to the good balance between the specific surface area and TiO2 contents. The photodegradation efficiency decreases with the increase in the initial UDMH concentration and the maximum degradation rate was obtained at pH 9.0. In the VUV/TS-2 process, ˙OH played a more important role in the degradation of UDMH than ˙O2− and the degradation pathways contained bond breaking, amidation, isomerisation and oxidation reactions. The TS-2 also showed good reusability with the rate constant maintained at above 90% after five cycles and exhibited satisfactory degradation efficiency in tap water.
Introduction
Unsymmetrical dimethylhydrazine (UDMH) is one of the most commonly used liquid rocket propellants.1 The frequent use of UDMH will inevitably produce large amounts of propellant wastewater.2,3 Furthermore, UDMH is carcinogenic, teratogenic and mutagenic. The presence of UDMH in wastewater will cause serious harm both in terms of public health and the ecological environment. Therefore, efficient removal of UDMH is an urgent and vital task. To date, several conventional technologies have been attempted to remove UDMH. Liao et al.4 reported bacteria belonging to Stenotrophomonas sp. and Comamonas sp. was able to degrade UDMH wastewater. Zhang et al.5 synthesized a Ag/β-cyclodextrin co-doped TiO2 floating membrane by an electrospinning process coupled with a hydrothermal method, wherein the adsorption capacity of UDMH was 12.1567 mg g−1. Kosyakov et al.6 researched the removal of UDMH in water by O2, H2O2, KMnO4 and HOCl; they found that chemical oxidation processes were not able to degrade all nitrogen-containing intermediates. Some crucial drawbacks such as catalyst deactivation, high energy consumption, secondary pollution as well as low efficiency still exist.7TiO2 photocatalytic oxidation is one of the most acceptable advanced oxidation processes used for environmental remediation due to the strong oxidizing power and facile operating conditions.8 Gao et al.9 studied the photocatalytic oxidation of UDMH wastewater over Au decorated CdS/TiO2 nanorod arrays under visible light and the photocatalytic activity was improved by the synergistic effect of heterojunction and surface plasmon resonance. However, the practical applications of TiO2 are still limited by the low efficiency due to the high recombination rate of photogenerated electrons and holes.10 The use of supported TiO2 will not only promote the dispersion of active sites and increase the photocatalytic activity, but also reduce the cost of catalyst recovery. To date, many strategies have been developed to support TiO2 onto porous substrates or incorporate Ti species into mesoporous framework.11–13 The removal of UDMH over activated carbon nanotube foams loaded with Ag/TiO2 was reported by Zhang et al.14 They found that adsorption synergetic effect played a vital role in photodegradation. More recently, SBA-15 mesoporous silica used as photocatalyst support is widely researched due to ultraviolet transparent, high specific surface area (600–1100 m2 g−1), adjustable pore diameter (2–30 nm), and uniform mesoporous hexagonal pore size distribution.15,16 Jardim et al.17,18 studied the influence of reaction media and synthesis routes on the physical properties of TiO2/SBA-15 nanocomposites, and they found that the post-synthesis method is more conducive to the formation of single crystal anatase. Conceição et al.19 prepared commercial anatase TiO2/SBA-15, wherein the activity for photocatalytic degradation of pesticide amicarbazone under UVA blacklight increased with increase in TiO2 contents.
Over the past years, vacuum-ultraviolet (VUV) photodegradation is a state-of-the-art technology for organic wastewater treatment due to the advantages of high efficiency and reliability.20,21 The VUV lamp emits both 254 and 185 nm energetic photons and the manufacturing and usage costs of VUV lamp is similar with that of traditional low pressure mercury lamp.22 The efficiency of photocatalytic degradation of organic wastewater under VUV is higher than that under visible or ultraviolet light since water and oxygen can be direct photolyzed by energetic 185 nm photons to produce aqueous electrons (eaq−), hydroxyl radicals (˙OH) and other reactive oxygen species.23 Hence, it can be reasonably expected that VUV photodegradation of UDMH wastewater exhibits an enhanced photocatalytic activity. While, as of yet, not many studies have been performed in the investigation of photocatalytic oxidation of organic contaminants under VUV irradiation over TiO2/SBA-15 catalysts.
In this work, mesoporous TiO2/SBA-15 was directly synthesized via an in situ hydrothermal approach and was used in VUV photocatalytic removal of UDMH in water for the first time. The physical and chemical properties of TiO2/SBA-15 were characterized. In specific, the influence of titanium content, initial pH and substrate concentration on the photocatalytic activity of TiO2/SBA-15 were investigated. The possible mechanism for the degradation of UDMH in VUV/TS-2 process was proposed and the main reactive oxygen species were determined. The degradation pathways were studied based on the intermediates detected by GC-MS. The energy efficient of the process was also evaluated. This efficient process exhibits a promising technology for propellant wastewater treatment.
Experimental
Materials
Pluronic P123 (Mav = 5800, Sigma-Aldrich), tetraethyl orthosilicate (TEOS, SiO2 ≥ 28.4 wt%, Damas-Beta), and titanium butoxide (TBT, 99%, Damas-Beta) were used as structure-directing agent, silica and titanium sources, respectively. Nitric acid (65–68 wt%, Greagent) was used to maintain acidic condition in the synthesis process. Commercial TiO2 (Degussa P25) was used as a reference photocatalyst. UDMH of 98 wt% purity was obtained from Qinghai Liming Chemical Co., Ltd. (Xining, China). Sulfuric acid (98 wt%), tert-butanol (TBA) and sodium hydroxide (≥98 wt%) were purchased from Greagent. All chemicals were used directly without further purification. Distilled water was produced from an UPWS-I-10T water purification system (Yongjieda, Hangzhou, China). Tap water was taken from the Xi'an water group (China).Preparation of catalysts
Mesoporous TiO2/SBA-15 was synthesized by a one-pot hydrolysis method according to the following steps: 2 g of P123 was dissolved in 40 mL of distilled water with 20 mL of HNO3 (0.5 M) and stirred at 40 °C for 4 h until a homogeneous solution obtained. 4.815 mL of TEOS was added and the mixture was stirred at 800 rpm for 12 h. Then, a given amount of TBT (molar ratio of Ti/Si = 0, 1![[thin space (1/6-em)]](https://www.rsc.org/images/entities/char_2009.gif) :
:![[thin space (1/6-em)]](https://www.rsc.org/images/entities/char_2009.gif) 6, 1.5
6, 1.5![[thin space (1/6-em)]](https://www.rsc.org/images/entities/char_2009.gif) :
:![[thin space (1/6-em)]](https://www.rsc.org/images/entities/char_2009.gif) 6, 2
6, 2![[thin space (1/6-em)]](https://www.rsc.org/images/entities/char_2009.gif) :
:![[thin space (1/6-em)]](https://www.rsc.org/images/entities/char_2009.gif) 6, 2.5
6, 2.5![[thin space (1/6-em)]](https://www.rsc.org/images/entities/char_2009.gif) :
:![[thin space (1/6-em)]](https://www.rsc.org/images/entities/char_2009.gif) 6 and 3
6 and 3![[thin space (1/6-em)]](https://www.rsc.org/images/entities/char_2009.gif) :
:![[thin space (1/6-em)]](https://www.rsc.org/images/entities/char_2009.gif) 6) was dripped into the system and reacted for 12 h. The obtained gel was transferred into a Teflon-lined autoclave and aged at 100 °C for 48 h. After aging, the slurry was filtered and washed by 2 L of distilled water. The filter cake was dried at 60 °C overnight and calcined at 500 °C for 4 h in air atmosphere. The solid products were denoted as SBA-15, TS-1, TS-1.5, TS-2, TS-2.5 and TS-3, respectively.
6) was dripped into the system and reacted for 12 h. The obtained gel was transferred into a Teflon-lined autoclave and aged at 100 °C for 48 h. After aging, the slurry was filtered and washed by 2 L of distilled water. The filter cake was dried at 60 °C overnight and calcined at 500 °C for 4 h in air atmosphere. The solid products were denoted as SBA-15, TS-1, TS-1.5, TS-2, TS-2.5 and TS-3, respectively.
Characterization of catalysts
The X-ray diffraction (XRD) patterns of the samples were collected with a Rigaku Smart Lab 9K diffractometer using Cu Kα (λ = 1.5418 Å) radiation. The specific surface areas and pore size distribution were determined from N2 adsorption/desorption isotherms on a Quadrasorb IQ (Quantachrome) at −196 °C. The samples were degassed at 200 °C under vacuum for 4 h prior to the measurement. The pore size distribution and specific surface areas (SBET) were got by Barrett–Joyner–Halenda (BJH) method and Brunauer–Emmett–Teller (BET) method, respectively. The morphology of the samples was observed on a field emission scanning electron microscopy (FE-SEM) (VEGA II XMU) attached with an Oxford EDS detector. Transmission electron microscopic (TEM) images were obtained on a JEOL JEM-2100 F instrument at 200 kV. Fourier transform infrared (FTIR) spectra were recorded on a Nicolet-670 spectrometer. The samples were dispersed in KBr pellets at a mass ratio of 1![[thin space (1/6-em)]](https://www.rsc.org/images/entities/char_2009.gif) :
:![[thin space (1/6-em)]](https://www.rsc.org/images/entities/char_2009.gif) 100 and collected in the range of 400–4000 cm−1 with a resolution of 2 cm−1. Raman spectra were obtained using a Raman spectrometer (inVia Reflex) in the range of 100–1500 cm−1 using an Ar-ion laser at 532 nm excitation. UV-vis diffuse reflectance spectra (UV-vis DRS) were recorded on a Shimadzu UV-2450 spectrophotometer. Photoluminescence (PL) spectroscopy were collected with a photoluminescence spectrometer (FLS1000, Edinburgh Instruments Ltd.). X-ray photoelectron spectroscopy (XPS) was conducted on a Thermo Scientific™ K-Alpha™+ spectrometer equipped with a monochromatic Al Kα X-ray source (1486.6 eV) operating at 100 W. All peaks would be calibrated with C 1s peak binding energy at 284.8 eV for adventitious carbon. An electron paramagnetic resonance (EPR) spectrometer (Bruker A300) was used to detect active radicals using 5,5-dimethyl-1-pyrroline N-oxide (DMPO) as the spin-trap reagent.
100 and collected in the range of 400–4000 cm−1 with a resolution of 2 cm−1. Raman spectra were obtained using a Raman spectrometer (inVia Reflex) in the range of 100–1500 cm−1 using an Ar-ion laser at 532 nm excitation. UV-vis diffuse reflectance spectra (UV-vis DRS) were recorded on a Shimadzu UV-2450 spectrophotometer. Photoluminescence (PL) spectroscopy were collected with a photoluminescence spectrometer (FLS1000, Edinburgh Instruments Ltd.). X-ray photoelectron spectroscopy (XPS) was conducted on a Thermo Scientific™ K-Alpha™+ spectrometer equipped with a monochromatic Al Kα X-ray source (1486.6 eV) operating at 100 W. All peaks would be calibrated with C 1s peak binding energy at 284.8 eV for adventitious carbon. An electron paramagnetic resonance (EPR) spectrometer (Bruker A300) was used to detect active radicals using 5,5-dimethyl-1-pyrroline N-oxide (DMPO) as the spin-trap reagent.
Photocatalytic activity tests
The experimental setup of the photocatalytic degradation (PCD) reactor is shown in Fig. S1.† One 250 mL glass beaker was used as bath reactor and placed in a water bath with magnetic stirring. In a typical run, 230 mL of 100 mg L−1 UDMH solution (natural pH = 9.0) was poured into the reactor. 0.23 g of catalyst was added into the solution at 30 °C under magnetic stirrer at 800 rpm. A VUV lamp (3.0 mW cm−2 of 254 nm and 0.15 mW cm−2 of 185 nm, 4 W, Cnlight) or UV lamp (3.15 mW cm−2 of 254 nm, 4 W, Cnlight) was used as light source. Prior to irradiation, the mixed solution was stirred in dark for 30 min to achieve adsorption and desorption equilibrium on the surface of the catalyst. Initial pH of the solution was adjusted with 0.1 M H2SO4 and 0.2 M NaOH solutions. The entire reactor system was covered with aluminum foil to prevent the leakage of UV light. Samples were taken out at a fixed time interval. Then, samples were filtered with a 0.45 μm filter membrane (PTFE, Millipore) and diluted before analysis.The concentration of UDMH was analyzed according to GB/T 14376-93 by a 721-type spectrometer (Shanghai Analytical Instrument Factory). Briefly, UDMH react with amino ferrocyanide sodium at pH = 4.7 and form a red complex with a maximum absorption wavelength at 500 nm. The degradation intermediates of UDMH were identified by a GC-MS (PerkinElmer, Clarus SQ 8T, USA). More details on the detection of UDMH and GC-MS conditions were shown in Text S1, S2 and Fig. S2.† Degradation efficiency and adsorption capacity were calculated from the following equations:
 | (1) |
 | (2) |
Results and discussion
Characterization
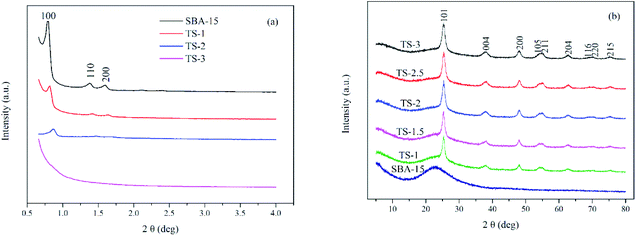
Fig. 1 shows XRD patterns of TiO2/SBA-15. Small angle XRD pattern (Fig. 1a) of the pure SBA-15 have a prominent peak at 2θ of 0.8° corresponding to (100) plane, accompanied by two small humps at 2θ of 1.4° and 1.6° corresponding to (110) and (200) planes. These characteristic peaks indicate the 2D hexagonal structure with space group of P6mm.24 With an increase of Ti content (up to Ti/Si = 2![[thin space (1/6-em)]](https://www.rsc.org/images/entities/char_2009.gif) :
:![[thin space (1/6-em)]](https://www.rsc.org/images/entities/char_2009.gif) 6), the XRD peaks show well-defined characteristic peaks. These peaks slightly shift to higher angles because of the longer Ti–O bond length than Si–O bond.25 However, the intensity of these peaks decreases gradually, indicating that non-framework metal oxide species are formed inside the mesopores and structural integrity is decreased. When the Ti/Si is 3
6), the XRD peaks show well-defined characteristic peaks. These peaks slightly shift to higher angles because of the longer Ti–O bond length than Si–O bond.25 However, the intensity of these peaks decreases gradually, indicating that non-framework metal oxide species are formed inside the mesopores and structural integrity is decreased. When the Ti/Si is 3![[thin space (1/6-em)]](https://www.rsc.org/images/entities/char_2009.gif) :
:![[thin space (1/6-em)]](https://www.rsc.org/images/entities/char_2009.gif) 6, the mesoporous structure is destroyed and three characteristic peaks disappears, indicating that a limited amount of Ti can maintain mesoporous structure.
6, the mesoporous structure is destroyed and three characteristic peaks disappears, indicating that a limited amount of Ti can maintain mesoporous structure.
Fig. 1b is the wide angle XRD patterns of the samples. A broad band between 15° and 35° is assigned to the amorphous SBA-15 silica matrix. The diffraction peaks of TS (2θ of 25.3°, 37.8°, 48.0°, 54.8°, 62.8°, 69.9° and 75.2°) match well with the anatase phase of TiO2 (JCPDS 89-4921). The intensity of those peaks increases with the increase of titanium content. Generally, the photocatalytic activity of anatase TiO2 is better than that of rutile and brookite phases.
Fig. 2 is the nitrogen adsorption–desorption isotherms and the pore size distribution curves of the samples. The specific surface area (SBET), pore volume and average pore size are presented in Table 1. All the samples display type IV isotherms with a H1 hysteresis loop (IUPAV classification), indicating that the materials have ordered mesoporous channels. However, the SBET of samples decrease from 805.691 to 533.249 m2 g−1 as the increase of Ti adding amount from 0![[thin space (1/6-em)]](https://www.rsc.org/images/entities/char_2009.gif) :
:![[thin space (1/6-em)]](https://www.rsc.org/images/entities/char_2009.gif) 6 to 3
6 to 3![[thin space (1/6-em)]](https://www.rsc.org/images/entities/char_2009.gif) :
:![[thin space (1/6-em)]](https://www.rsc.org/images/entities/char_2009.gif) 6. The pore volume of the samples decrease from 1.342 to 0.681 cm3 g−1. The average pore size is between 6–8.2 nm. The results show that excessive Ti doping may block the pores and reduce the order of the mesoporous structure, which may be not conducive to the photocatalytic reaction.
6. The pore volume of the samples decrease from 1.342 to 0.681 cm3 g−1. The average pore size is between 6–8.2 nm. The results show that excessive Ti doping may block the pores and reduce the order of the mesoporous structure, which may be not conducive to the photocatalytic reaction.
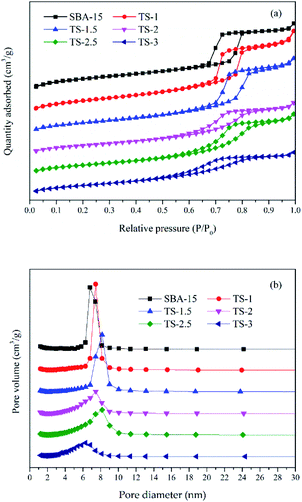 | ||
| Fig. 2 Nitrogen adsorption–desorption isotherm (a) and the pore size distribution curves (b) of the samples. | ||
| Sample | SBET (m2 g−1) | Pore volume (cm3 g−1) | Average pore size (nm) | Eg (eV) |
|---|---|---|---|---|
| SBA-15 | 805.691 | 1.342 | 6.801 | — |
| TS-1 | 733.861 | 1.244 | 7.439 | 3.33 |
| TS-1.5 | 648.358 | 1.085 | 8.165 | 3.29 |
| TS-2 | 547.954 | 1.002 | 7.442 | 3.28 |
| TS-2.5 | 546.537 | 0.847 | 8.159 | 3.26 |
| TS-3 | 533.249 | 0.681 | 6.283 | 3.25 |
Fig. 3 displays the SEM and TEM pictures of the synthesized samples at different magnifications. Clearly, the amount of Ti significantly affects the morphologies of the samples. SEM images indicate that pure SBA-15 and TS-1 have wheat spike shape. While, TS-2 and TS-3 consist of irregular micrometer-sized particles. The result of EDS (Fig. S3†) indicates that only O, Ti and Si elements are present. TEM images present the orderly pore structure of SBA-15, TS-1, and TS-2. The mesoporous channels include (100) direction (Fig. 3A2–C2), and parallel array along the (110) direction (Fig. 3A3–C3), which facilitate the mass transfer of reactants and products. Moreover, the HRTEM image of TS-2 (Fig. S4†) indicates that TiO2 are successfully incorporated in SBA-15. The interplanar lattice spacing of 0.352 nm corresponds to the (1 0 1) lattice plane of TiO2 anatase phase. This frame encapsulated TiO2 improves the dispersion of active sites of titanium dioxide. However, for TS-3, mesoporous structure is affected and the orderly channels is almost disappeared. TiO2 particles are dispersed in the silica matrix. This result is consistent with small angle XRD date discussed above.
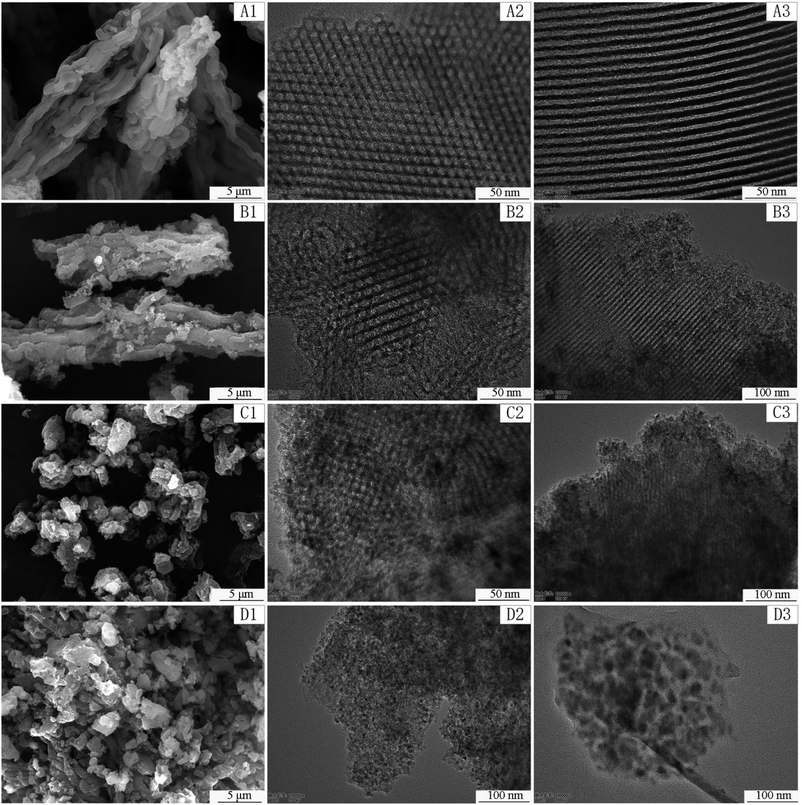 | ||
| Fig. 3 SEM images of SBA-15 (A1), TS-1 (B1), TS-2 (C1), TS-3 (D1) and TEM images of SBA-15 (A2, A3), TS-1 (B2, B3), TS-2 (C2, C3), TS-3 (D2, D3). | ||
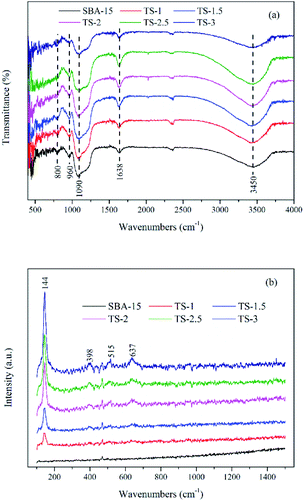
Fig. 4a shows FTIR spectra of the samples. For pure SBA-15, the absorption band at 960 cm−1 is assigned to Si–OH or Ti–O–Si stretching vibration. The intensity of 960 cm−1 for TiO2/SBA-15 is higher than that of SBA-15, which can be can be attributed to the formation of Ti–O–Si bond.26 The bands at around 1090 and 800 cm−1 are assigned to the Si–O–Si asymmetric and symmetric stretching vibrations, respectively. The intensity of Si–O–Si is decreased with the Ti incorporation. The broad bands at around 1638 and 3450 cm−1 are ascribed to bending vibration and stretching vibrations of –OH. The FTIR spectroscopy of TiO2/SBA-15 are similar with that of pure SBA-15, which means that the incorporation of Ti not change the structure of this material.
As Fig. 4b has shown, a strong peak at 144 cm−1 (Eg) along with three peaks at 398 (B1g), 515 (A1g + B1g) and 637 cm−1 (Eg) indicate the presence of anatase phase TiO2. The result is consistent with wide angle XRD (Fig. 1b) analyses.
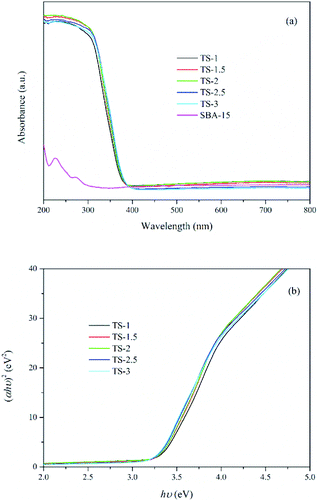
UV-vis DRS has been widely used for determining the nature and state of Ti4+ in titanium-substituted supports. As shown in Fig. 5a, samples with Ti embedded exhibit strong absorption at wavelengths from 200 to 380 nm due to the excitation of TiO2 from the valence band (VB) to conduction band (CB). The wavelengths at about 210–230 nm and 240–250 nm are assigned to the tetrahedral and octahedral sites of the Ti4+, which indicate that Ti species are well-dispersed in mesoporous framework. TS-2 exhibits better light harvesting capacity compared with the others. Besides, almost no absorbance for SBA-15 due to the UV transparent of the SiO2 substrate. The band gap energy (Eg) of the samples is calculated from eqn (3).27
| αhν = A(hν − Eg)1/2 | (3) |
The plots of (ahν)2 versus hν are shown in Fig. 5b and the Eg values are present in Table 1. The value of Eg decreases with increasing Ti content, indicating that a large amount of Ti may causes the formation of TiO2 clusters. According to the study of Sacaliuc et al.,28 larger Eg can be attributed to quantum size effect. Therefore, the growth of TiO2 nanocrystals is suppressed by SBA-15 mesoporous framework, which inhibits the agglomeration of TiO2 nanoparticles and improves the dispersion of active sites.
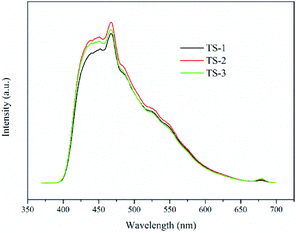
PL spectroscopy interpret the process of generation, migration and recombination of excited electrons and holes in semiconductors, and the intensity of fluorescence indicates the degree of recombination of excited electrons and holes. As shown in Fig. 6, TiO2/SBA-15 samples show obvious PL signals at the wavelength from 400 to 600 nm with similar shape. PL signals decrease following the order: TS-2 > TS-3 > TS-1. Compared with TS-1, TS-2 obtains a larger loading of TiO2, and shows a stronger fluorescence. However, excessive loading of TiO2 causes a decrease in the dispersibility of active sites, which is not conducive to the generation of photo-generated carriers, thereby causing a decrease in the PL signal of TS-3.29
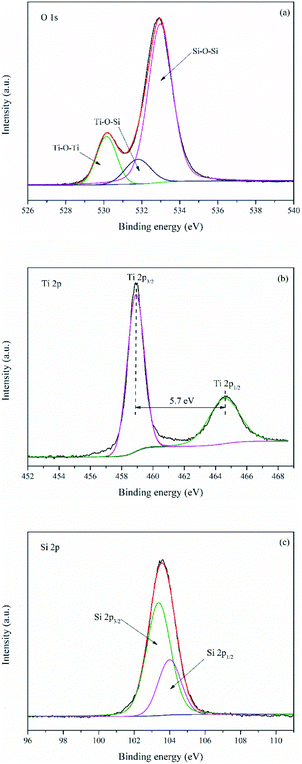
Fig. 7 manifested XPS spectra of TS-2. It can be seen from Fig. S5† that O, Ti, Si and C are existed on the surface of TS-2. The element C in the sample is attributed to the residual carbon. The high resolution XPS spectra of the O 1s spectra (Fig. 7a) could be divided into three peaks at 530.2, 531.8 and 533.0 eV, representing to the oxygen atoms in Ti–O–Ti, Ti–O–Si and Si–O–Si bonds respectively. The high resolution XPS spectra of the Ti 2p spectra (Fig. 7b) exhibit two peaks at 464.6 and 458.9 eV, assigned to Ti 2p1/2 and Ti 2p3/2 bands of TiO2. Furthermore, the splitting between the Ti 2p1/2 and Ti 2p3/2 bands is 5.7 eV, which indicates that the chemical state of Ti in TS-2 was +4.30 Si 2p (Fig. 7c) was fitted with a doublet at 104.0 and 103.4 eV, assigned to Si 2p1/2 and Si 2p3/2. Hence, the XPS result, combined with XRD, EDS, Raman and UV-vis reveal that TiO2 was successfully loaded onto SBA-15.
Photocatalytic activity
Fig. 8a shows the degradation of UDMH in UV/VUV photolysis and photocatalytic process. The UDMH adsorption of SBA-15 after 30 min is negligible. In order to highlight the efficacy of different processes, the rate constants (k) of UDMH removal in different processes were calculated using eqn (4):
 | (4) |
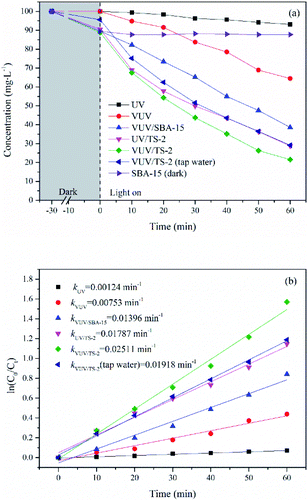 | ||
| Fig. 8 Time course of UDMH concentration in different process (a) and rate constant of UDMH degradation (b). [UDMH]0 = 100 mg L−1, pH0 = 9.0, T = 30 °C. | ||
The fitting lines and k are shown in Fig. 8b. The reactions could be well-fitted with the pseudo-first-order kinetics. The k of UV and VUV was 0.00124 and 0.00753 min−1, respectively, which indicated that both UV and VUV photolysis have the ability to remove UDMH. However, the degradation of UDMH by VUV photolysis was significantly promoted, and the kVUV was 5.1 times higher than that of kUV. In contrast to UV lamp, VUV lamp can emit both 254 nm ultraviolet light and 185 nm vacuum ultraviolet light. The vacuum ultraviolet light not only directly decompose UDMH, but also produce hydroxyl radicals by photolysis of water, thereby accelerating the removal of organic pollutants. Interestingly, the kVUV/SBA-15 was 0.01396 min−1, which was 1.9 times that of kVUV. This result indicates that the synthesized mesoporous SBA-15 support is UV and VUV transparent and the gradient light intensity of the photoreaction system is not affected by the support. Therefore, different from activated carbon and diatomaceous earth supports, SBA-15 can avoid the adverse effects of light absorption and scattering effects. Moreover, the unique mesoporous structure of SBA-15 is conducive to the adsorption-enrichment and the mass transfer, thereby promoting the VUV photolysis process.
The k of UDMH degradation in the VUV/TS-2 and UV/TS-2 process were 0.02511 and 0.01787 min−1, respectively. Both 254 and 185 nm ultraviolet light could excite TS-2 (Fig. 5). Therefore, the faster degradation rate in VUV/TS-2 is attributed to multiple degradation pathways including photocatalysis, VUV photolysis and photooxidation. Furthermore, the kVUV/TS-2 (0.02511 min−1) was slightly higher than kUV/TS-2 + kVUV − kUV, (0.02416 min−1). This may be due to the synergetic effect occurred in VUV/TS-2 process. The removal efficiency of VUV/TS-2 in tap water was inferior compared to deionized water, which may be due to the competition between natural water constituents and UDMH for the VUV photons and ˙OH. However, the VUV/TS-2 process still exhibited satisfactory degradation ability for UDMH in tap water with the k of 0.01819 min−1. Hence, the VUV/TS-2 process shows good prospects in practical applications.
The photocatalytic activity of TiO2/SBA-15 with different titanium contents were evaluated and compared with P25 and TiO2 prepared by hydrolysis (H-TiO2, Text S3†) under VUV irradiation. P25 contains both anatase and rutile phases and exhibits outstanding photocatalytic activity, which is by far widely used commercial photocatalyst. Fig. 9 displays UDMH concentration as a function of reaction time in photocatalytic process. The UDMH concentration dropped in the presence of TiO2/SBA-15 after the adsorption equilibrium. The UDMH adsorbed on TiO2/SBA-15 decreased firstly and then increased with an increasing amount of Ti. The adsorption capacity of TiO2/SBA-15 follows the order: TS-1 > TS-1.5 > TS-2 > TS-3 > TS-2.5, with the values of 12.65, 12.50, 11.26, 9.15 and 8.14 mg g−1, respectively. The addition of Ti reduces the order of the mesoporous channel, resulting in a decrease in specific surface area and pore volume, which is not conducive to the dispersion of active sites and the diffusion of organic molecules. However, the adsorption of P25 and H-TiO2 were insignificant due to the low specific surface area and poor pore structure. The adsorption capacity of P25 and H-TiO2 were 5.52 and 3.70 mg g−1, respectively. Generally, good adsorption capacity and pore structure is conducive to the photocatalytic reaction.
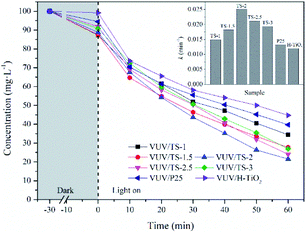 | ||
| Fig. 9 Time course of UDMH concentration over TiO2/SBA-15 with different Ti contents in VUV process, with the rate constants (inset). [UDMH]0 = 100 mg L−1, pH0 = 9.0, T = 30 °C. | ||
The catalytic rates of different catalysts followed the trend: TS-2 > TS-2.5 > TS-3 > TS-1.5 > TS-1 > P25 > H-TiO2, with the k of 0.02511, 0.02115, 0.01931, 0.01817, 0.01487, 0.01317 and 0.01199 min−1, respectively. All the synthesised TiO2/SBA-15 catalysts performed superior photocatalytic activity than P25. Among them, the TS-2 showed maximum degradation performance and the k of VUV/TS-2 was 1.91 times of that in VUV/P25. The rate constant increased firstly and then decreased with an increasing amount of Ti. The photocatalytic activity is therefore mainly related to a balance between the specific surface area and TiO2 contents. A proper amount of Ti increases the photocatalytic active sites and light harvesting capacity. However, excessive Ti causes the agglomeration of TiO2 particles, which not only reduces the specific surface area and pore volume (Table 1), but also not conducive to the dispersion of active sites and the diffusion of reactants and products. The mesoporous SBA-15 support is beneficial to improve the dispersibility of TiO2, increase mass transfer, and then enhance the photocatalytic activity. As compared to the previously reported photocatalytic UDMH degradation processes (Table 2), the VUV/TS-2 process exhibits superior photodegradation efficiency.
| Photocatalyst | [UDMH]0 (mg L−1) | Volume (mL) | Light source | k (min−1) | EEO (kW h m3 per order) | Reference |
|---|---|---|---|---|---|---|
| Ag/β-cyclodextrin/TiO2 | 20 | 20 | 150 W, Xe lamp | 0.03750 | 7680 | Zhang et al.5 |
| aCFs@TiO2-5Ag | 50 | 15 | 100 W, UV light | 0.04500 | 5689 | Zhang et al.14 |
| GO/NiFe2O4/TiO2 nanorod arrays | 20 | 10 | 300 W, Xe lamp | 0.00355 | 324![[thin space (1/6-em)]](https://www.rsc.org/images/entities/char_2009.gif) 507 507 |
Lu et al.31 |
| CdS/TiO2 nanorod arrays | 20 | 15 | 300 W, Xe lamp | 0.00197 | 389![[thin space (1/6-em)]](https://www.rsc.org/images/entities/char_2009.gif) 848 848 |
Gao et al.32 |
| Au/CdS/TiO2 nanorod arrays | 20 | 15 | 300 W, Xe lamp | 0.00372 | 206![[thin space (1/6-em)]](https://www.rsc.org/images/entities/char_2009.gif) 452 452 |
Gao et al.9 |
| TS-2 | 100 | 230 | 4 W, VUV | 0.02511 | 27 | This study |
| TS-2 | 50 | 230 | 4 W, VUV | 0.05910 | 11 | This study |
Effects of initial pH and UDMH concentration on the degradation in VUV/TS-2
The efficiency of the photocatalytic reaction is closely related to the pH of the solution. Here we examined the degradation of UDMH in the VUV/TS-2 process in the initial pH range of 3–12 (Fig. 10a). The k for pH of 3, 6, 8, 9, 10 and 12 was 0.01304, 0.01778, 0.02215, 0.02511, 0.01972 and 0.01552 min−1, respectively. The maximum UDMH degradation rate was obtained at pH 9.0. The lower or higher initial pH value is not conducive to the photocatalytic reaction. This could be explained as follow: (1) increasing the OH− concentration is beneficial to the formation of ˙OH, the key reactive oxygen species for UDMH degradation; (2) the oxidation potential of ˙OH decreases with increasing pH; and (3) a large amount of OH− will compete with UDMH molecules for adsorption sites on the catalyst surface.33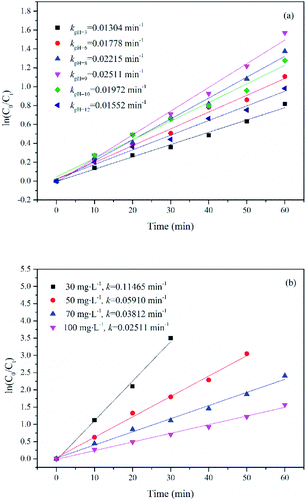 | ||
| Fig. 10 Effect of initial pH (a) and initial substrate concentration (b) on the degradation of UDMH in VUV/TS-2 process. (a) [UDMH]0 = 100 mg L−1, T = 30 °C; (b) pH0 = 9.0, T = 30 °C. | ||
Effect of initial substrate concentration ranging from 30 to 100 mg L−1 on the degradation of UDMH in VUV/TS-2 process was researched. The degradation rate constant as a function of initial UDMH concentration is shown in Fig. 10b. As seen in Fig. 10b, the k for UDMH concentrations of 30, 50, 70 and 100 mg L−1 was 0.11465, 0.05910, 0.03812 and 0.02511 min−1, respectively. The results showed that the photodegradation efficiency of UDMH decreases with the increase in the initial UDMH concentration. The residual UDMH and degradation intermediates in the reaction system increases with the increase in initial substrate concentration. However, the number of energetic photons, reactive species generated in the reaction system and active sites of photocatalyst are limited.34 Therefore, the increased competition resulted in the decrease of UDMH degradation efficiency with the increase of initial UDMH concentration.
Photocatalytic stability of TS-2
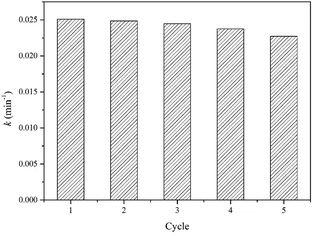
The catalytic stability of photocatalyst for the degradation of water contaminants is an important factor for practical application. Fig. 11 exhibits the reusability of TS-2 for five consecutive cycles in VUV/TS-2 process. In the reusability test, the photocatalyst after each reaction was recovered by filtrated, washed with distilled water for many times and dried at 120 °C for 1 h. After five cycles, the rate constant was 0.02273 min−1, basically maintaining above 90%, exhibiting good potential for practical application.Mechanism for the degradation of UDMH
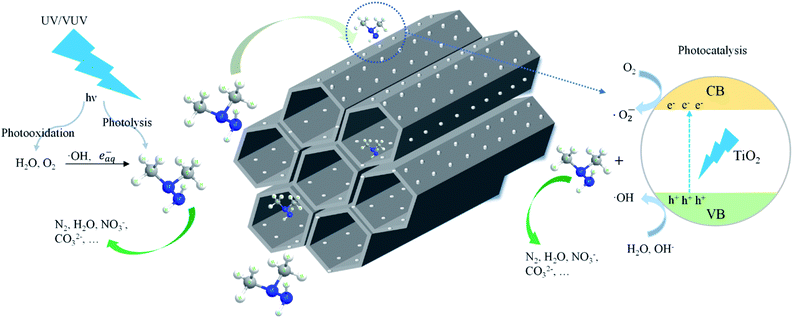
Scheme 1 shows the schematic diagram for the degradation of UDMH in VUV/TS process. There are three degradation pathways involved in the process. Firstly, 185/254 nm photons could directly dissociate UDMH (eqn (5)). Fig. S6† shows the UV absorption curve of UDMH at 190–500 nm. UDMH exhibits a low absorption at 254 nm (A = 0.0185 cm−1) and a high absorption at 190 nm (A = 0.7820 cm−1), which is consistent with the phenomenon that VUV irradiation significantly increase the degradation rate of UDMH. The bond dissociation energy (BDE) of UDMH is between 2.7 and 4.1 eV.35 However, 185 nm photons correspond to the energy of 6.7 eV, which indicates that VUV can break all the chemical bonds of UDMH.36Moreover, H2O and O2 (dissolved oxygen molecules) can be photolyzed by VUV to produce reactive oxygen species (ROS) such as ˙OH, and ˙O2− (eqn (6)–(8)), which are responsible for the indirect oxidation of UDMH.37 Furthermore, under UV/VUV irradiation, light induced electron–hole pairs are generated and migrate to the surface of TiO2. Furthermore, the photogenerated holes and electrons undergo oxidation and reduction reactions, respectively. In these ways, UDMH can be oxidized via holes and ROS (eqn (9)–(11)).
 | (5) |
| H2O + hν (185 nm) → ˙OH + ˙H | (6) |
| H2O + hν (185 nm) → ˙OH + H+ + eaq− | (7) |
| O2 + 2˙H + hν (254 nm) → 2˙OH | (8) |
 | (9) |
| O2 + e− → ˙O2− | (10) |
| hVB+ + H2O → ˙OH + H+ | (11) |
As discussed above, ˙OH and ˙O2− radicals played important roles in photochemical oxidation and photocatalytic degradation of UDMH. To better understand the impact of ˙OH, tert-butanol was used as scavenger for ˙OH.38 While, p-benzoquinone, a typical ˙O2− radicals scavenger with oxidizing potential, can react with UDMH and cause interference. Therefore, the VUV/TS-2 process was conducted under N2 atmosphere in order to eliminate dissolved oxygen and evaluate the effect of ˙O2− radicals indirectly.39 As shown in Fig. 12, the degradation rate decreased to 0.02052 min−1 under N2 atmosphere. While, the addition of TBA significantly suppressed UDMH degradation. The k decreased from 0.02511 min−1 in the absence of scavengers to 0.01640 min−1 and 0.01257 min−1 in the presence of 1 mM TBA and 10 mM TBA, respectively. Thus, ˙OH and ˙O2− radicals contributed 50% and 18% to the degradation rate of UDMH in VUV/TS-2 process, respectively. Fig. 13 shows that the intensities of DMPO-˙OH and DMPO-˙O2− increased with irradiation time and the intensity of DMPO-˙OH was much higher than that of DMPO-˙O2−. Therefore, the results of EPR and quenching tests indicate that ˙OH and ˙O2− radicals were two ROS in the VUV/TS-2 process, and ˙OH played a more vital role due to higher oxidation potential and various formation pathways (eqn (6)–(8) and (11)). However, TBA and N2 didn't completely suppress the degradation rate, and the ROS oxidation overall contributed 68% to the degradation rate. This result suggested that ROS oxidation was the main factor but not the only factor governing the degradation rate. As shown in Fig. 8, the contribution of photolysis (kVUV) and photocatalysis (kUV/TS-2) to the removal rate in VUV/TS-2 process were 29% and 71%, respectively. Therefore, it is reasonable to speculate that ROS oxidation, direct UV/VUV photolysis, as well as hole direct oxidation contributed to the degradation of UDMH in VUV/TS-2 process.
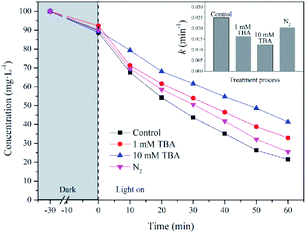 | ||
| Fig. 12 Effect of TBA and dissolved oxygen on UDMH degradation in VUV/TS-2 process. [UDMH]0 = 100 mg L−1, pH0 = 9.0, T = 30 °C. | ||
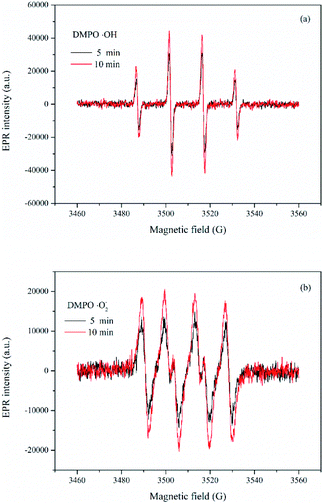 | ||
| Fig. 13 EPR spectra of DMPO-˙OH and DMPO-˙O2− at different reaction time in VUV/TS-2 process. [DMPO]0 = 100 mM. | ||
Degradation pathways of UDMH
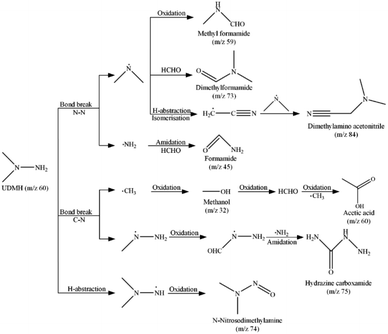
In order to investigate the degradation pathway of UDMH in VUV/TS-2 process, the intermediate products were detected by GC-MS. The results are listed in Table S1† and the mass spectra of seven intermediates are shown in Fig. S7–S14.† The possible degradation pathways of UDMH are proposed and shown in Scheme 2. The C–N and N–N bonds could be broken by reactive species attack and formed methyl radicals, methylhydrazine radicals, amino radicals, and dimethylamine radicals. The methyl radicals could be oxidized to methanol and formaldehyde, and then underwent free radical reactions and oxidation reactions to generate acetic acid. The oxidation and amidation of methylhydrazine radicals leaded to the generation of hydrazine carboxamide.40 Amidation reaction of amino radicals and formaldehyde to form formamide. The dimethylamine radicals reacted with formaldehyde and formed dimethylformamide. Besides, the dimethylamine radicals could be directly oxidized and generated methyl formamide. Also, the H-abstraction, isomerisation and free radical reaction of dimethylamine radicals produced dimethylamino acetonitrile. The H-abstraction and oxidation of UDMH also yield small amount of N-nitrosodimethylamine. All intermediate products can be further oxidized to CO2 and inorganic anions. As discussed above, the degradation of UDMH contained bond break, amidation, isomerisation and oxidation reaction.Energy efficient
In order to evaluated the practicability of the VUV/TS-2 process, the energy efficient was calculated according to eqn (12):41,42
 | (12) |
Conclusions
Mesoporous TiO2/SBA-15 was prepared by an in situ hydrothermal method via tuning Ti content and used for VUV photocatalytic degradation of UDMH in water for the first time. Results suggest that TS-2 with anatase phase, mesoscopic ordering, suitable TiO2 content and high specific surface area, performed outstanding photocatalytic activity. The rate constant of VUV/TS-2 is 0.02511 min−1, which is much higher than that in VUV/P25 (0.01317 min−1). Compared with UV/TS-2 (k = 0.01787 min−1), VUV/TS-2 exhibited much better degradation efficiency. The synergetic effect of direct photolysis, indirect photooxidation and photocatalytic oxidation in VUV/TS-2 process enhanced the removal of UDMH. The VUV/TS-2 process with both excellent photocatalytic activity and high energy efficient provides an economical and promising way for practical degradation of UDMH wastewater.Conflicts of interest
There are no conflicts to declare.Acknowledgements
The authors acknowledge the financial support from the National Natural Science Foundation of China (NSFC) (No. 21875281).Notes and references
- N. V. Ul'yanovskii, D. E. Lakhmanov, I. I. Pikovskoi, D. I. Falev, M. S. Popov, A. Y. Kozhevnikov and D. S. Kosyakov, Sci. Total Environ., 2020, 138483 CrossRef
.
- L. Carlsen, O. A. Kenesova and S. E. Batyrbekova, Chemosphere, 2007, 67, 1108–1116 CrossRef CAS
.
- T. Koroleva, I. Semenkov, A. Sharapova, P. Krechetov and S. Lednev, Environ. Pollut., 2021, 268, 115711 CrossRef CAS
.
- Q. Liao, C. Feng and L. Wang, Appl. Sci., 2016, 6, 95 CrossRef
.
- Y. Zhang, Q. Li, Q. Gao, S. Wan, P. Yao and X. Zhu, Appl. Catal., B, 2020, 267, 118715 CrossRef CAS
.
- D. S. Kosyakov, N. V. Ul'yanovskii, I. I. Pikovskoi, B. Kenessov, N. V. Bakaikina, Z. Zhubatov and A. T. Lebedev, Chemosphere, 2019, 228, 335–344 CrossRef CAS
.
- A. L. Milyushkin, K. P. Birin, D. D. Matyushin, A. V. Semeikin, S. D. Iartsev, A. E. Karnaeva, A. V. Uleanov and A. K. Buryak, Chemosphere, 2019, 217, 95–99 CrossRef CAS
.
- S. Mosleh, M. Rahimi, M. Ghaedi, K. Dashtian and S. Hajati, RSC Adv., 2016, 6, 17204–17214 RSC
.
- X. Gao, X. Liu, Z. Zhu, Y. Gao, Q. Wang, F. Zhu and Z. Xie, Sci. Rep., 2017, 7, 1–10 CrossRef PubMed
.
- B. Li, Y. Hao, B. Zhang, X. Shao and L. Hu, Appl. Catal., A, 2017, 531, 1–12 CrossRef CAS
.
- C. Belver, J. Bedia and J. Rodriguez, J. Hazard. Mater., 2017, 322, 233–242 CrossRef CAS PubMed
.
- Z. Hu, T. Xu and B. Fang, Appl. Surf. Sci., 2017, 420, 34–42 CrossRef CAS
.
- H. Huang, H. Huang, Q. Feng, G. Liu, Y. Zhan, M. Wu, H. Lu, Y. Shu and D. Y. Leung, Appl. Catal., B, 2017, 203, 870–878 CrossRef CAS
.
- Y. Zhang, M. Gong, X. Liu, L. Ji, Z. Yang and X. Zhu, J. Mater. Sci., 2019, 54, 2975–2989 CrossRef CAS
.
- A. Ali, M. Shoeb, Y. Li, B. Li and M. A. Khan, J. Mol. Liq., 2021, 324, 114696 CrossRef CAS
.
- M.-J. López-Muñoz, R. van Grieken, J. Aguado and J. Marugán, Catal. Today, 2005, 101, 307–314 CrossRef
.
- A. A. Jardim, R. Bacani, F. F. Camilo, M. C. Fantini and T. S. Martins, Microporous Mesoporous Mater., 2016, 228, 37–44 CrossRef CAS
.
- A. A. Jardim, R. Bacani, N. S. Goncalves, M. C. Fantini and T. S. Martins, Microporous Mesoporous Mater., 2017, 239, 235–243 CrossRef CAS
.
- D. Conceição, C. Graça, D. Ferreira, A. Ferraria, I. Fonseca, A. B. do Rego, A. Teixeira and L. V. Ferreira, Microporous Mesoporous Mater., 2017, 253, 203–214 CrossRef
.
- W. Szeto, J. Li, H. Huang and D. Y. Leung, Chem. Eng. Sci., 2018, 177, 380–390 CrossRef CAS
.
- M. Moradi and G. Moussavi, Chem. Eng. J., 2019, 358, 1038–1046 CrossRef CAS
.
- D. Wen, Z. Wu, Y. Tang, M. Li and Z. Qiang, J. Hazard. Mater., 2018, 344, 1181–1187 CrossRef CAS PubMed
.
- K. Zoschke, H. Börnick and E. Worch, Water Res., 2014, 52, 131–145 CrossRef CAS PubMed
.
- M. Betiha, Y. Moustafa, M. El-Shahat and E. Rafik, J. Hazard. Mater., 2020, 397, 122675 CrossRef CAS
.
- V. A. Vallés, B. C. Ledesma, G. A. Pecchi, O. A. Anunziata and A. R. Beltramone, Catal. Today, 2017, 282, 111–122 CrossRef
.
- P. Wu, T. Tatsumi, T. Komatsu and T. Yashima, Chem. Mater., 2002, 14, 1657–1664 CrossRef CAS
.
- Y. Tang, E. Zong, H. Wan, Z. Xu, S. Zheng and D. Zhu, Microporous Mesoporous Mater., 2012, 155, 192–200 CrossRef CAS
.
- E. Sacaliuc, A. M. Beale, B. M. Weckhuysen and T. A. Nijhuis, J. Catal., 2007, 248, 235–248 CrossRef CAS
.
- W. Y. Jung, G. D. Lee, S. S. Park, K. T. Lim and S.-S. Hong, Catal. Today, 2011, 164, 395–398 CrossRef CAS
.
- A. Thakur, T. Hamamoto, T. Ikeda, P. Chammingkwan, T. Wada and T. Taniike, Appl. Catal., A, 2020, 595, 117508 CrossRef CAS
.
- Y.-b. Lu, H.-C. Wang, X.-y. She, D. Huang, Y.-x. Yang, X. Gao, Z.-m. Zhu, X.-x. Liu and Z. Xie, Mater. Sci. Semicond. Process., 2021, 121, 105448 CrossRef CAS
.
- X. Gao, X. Liu, X. Wang, Z. Zhu, Z. Xie and J. Li, Nanoscale Res. Lett., 2016, 11, 1–10 CrossRef CAS
.
- M. Saquib, M. A. Tariq, M. Haque and M. Muneer, J. Environ. Manage., 2008, 88, 300–306 CrossRef CAS PubMed
.
- T.-t. Cao, X. Tie-Fu, M.-n. Zhao, J. Xu and C.-w. Cui, J. Hazard. Mater., 2020, 384, 121464 CrossRef CAS PubMed
.
- Y. D. Liu and R. Zhong, J. Hazard. Mater., 2017, 321, 362–370 CrossRef CAS
.
- Y. Huang, Y. Jia, K. Shen, R. Hou, Y. Zhang and L. a. Hou, New J. Chem., 2021, 45, 1194–1202 RSC
.
- S. Liang, Y. Shu, K. Li, J. Ji, H. Huang, J. Deng, D. Y. Leung, M. Wu and Y. Zhang, J. Hazard. Mater., 2020, 122967 CrossRef CAS PubMed
.
- Y. Guo, Y. Zhang, G. Yu and Y. Wang, Appl. Catal., B, 2021, 280, 119418 CrossRef CAS
.
- D. Du, W. Shi, L. Wang and J. Zhang, Appl. Catal., B, 2017, 200, 484–492 CrossRef CAS
.
- B. N. Kenessov, J. A. Koziel, T. Grotenhuis and L. Carlsen, Anal. Chim. Acta, 2010, 674, 32–39 CrossRef CAS
.
- Z. Hu, X. Xie, S. Li, M. Song, G. Liang, J. Zhao and Z. Wang, Chem. Eng. J., 2021, 404, 126541 CrossRef CAS
.
- M. A. Behnajady, B. Vahid, N. Modirshahla and M. Shokri, Desalination, 2009, 249, 99–103 CrossRef CAS
.
Footnote |
| † Electronic supplementary information (ESI) available. See DOI: 10.1039/d1ra03599a |
| This journal is © The Royal Society of Chemistry 2021 |

