 Open Access Article
In situ hydrothermal synthesis of nickel cobalt sulfide nanoparticles embedded on nitrogen and sulfur dual doped graphene for a high performance supercapacitor electrode†
Nutthapong Poompiew a,
Prasit Pattananuwat‡
*abc and
Pranut Potiyaraj‡
 *acd
*acd
aDepartment of Materials Science, Faculty of Science, Chulalongkorn University, Bangkok, 10330, Thailand. E-mail: prasit.pat@chula.ac.th; pranut.p@chula.ac.th; Fax: +66 2 218 5561; Tel: +66 2 218 5544
bResearch Unit of Advanced Materials for Energy Storage, Chulalongkorn University, Bangkok, Thailand
cCenter of Excellence on Petrochemical and Materials Technology, Chulalongkorn University, Bangkok, Thailand
dCenter of Excellence in Responsive Wearable Materials, Chulalongkorn University, Bangkok, Thailand
First published on 19th July 2021
Abstract
Nickel cobalt sulfide nanoparticles (NCS) embedded onto a nitrogen and sulfur dual doped graphene (NS-G) surface are successfully synthesized via a two-step facile hydrothermal process. The electrical double-layer capacitor of NS-G acts as a supporting host for the growth of pseudocapacitance NCS nanoparticles, thus enhancing the synergistic electrochemical performance. The specific capacitance values of 1420.2 F g−1 at 10 mV s−1 and 630.6 F g−1 at 1 A g−1 are achieved with an impressive capability rate of 76.6% preservation at 10 A g−1. Furthermore, the integrating NiCo2S4 nanoparticles embedding onto the NS-G surface also present a surprising improvement in the cycle performance, maintaining 110% retention after 10![[thin space (1/6-em)]](https://www.rsc.org/images/entities/char_2009.gif) 000 cycles. Owing to the unique morphology an impressive energy density of 19.35 W h kg−1 at a power density of 235.0 W kg−1 suggests its potential application in high-performance supercapacitors.
000 cycles. Owing to the unique morphology an impressive energy density of 19.35 W h kg−1 at a power density of 235.0 W kg−1 suggests its potential application in high-performance supercapacitors.
1. Introduction
Over the past few decades, electrical energy demands have been increased by the advancement of portable electronic devices and luxurious “standards of living” technologies. The requirements of high-performance energy storage/supply have been set for next-generation electronic devices, electronic vehicles and electronic household appliances such as high-power-energy output, long-life cycles, safety, compact size, and light weight.1 Supercapacitors possess promising characteristics as an electrical energy storage/supply including high power energy output, fast charge features, low cost and high stability with a long lifetime.2For charge storage mechanisms, supercapacitors (SCs) can be divided into two types of storage mechanism, namely, pseudocapacitors (PCs) and electrical double layer capacitors (EDLCs).3 PC is identified as the reversible faradaic reaction between surface materials and electrolyte, meanwhile EDLC stores the electrical energy by electrostatic absorption between ion/charge diffusion form electrolyte and the surface materials.4,5 Recently, extensive materials have been explored as high-performance materials for PC such as conductive polymers (polyaniline,6,7 polypyrrole8,9 and poly(2,3-dihydrothieno-1,4-dioxin) or PEDOT10) and transition metals (ZnO,11–14 Ni(OH)2,15 V2O5,16 TiO2,17 MnO2,18 NiS2 and CoS2 (ref. 19)). In particular, nickel and cobalt sulfide have been chosen as the electrode material because of their rich electroactive sites, multiple redox reaction, and high theoretical capacitances.19–21 Many attempts have been made to develop the high pseudocapacitance materials with nanostructure. The laser irradiation technique was employed to synthesize nickel sulfide nanostructures, demonstrating the ultra-high specific capacitance of 3761 F g−1 at 10 mV s−1.22 A recent development on synthesis of zinc-cobalt sulfide nanoparticles via the hydrothermal process using hybrid zeolitic imidazolate framework (ZIF) as template reveal the ultra-high capacitance of 1646 F g−1 at 1 A g−1 with capacitance retention of 89% after 2000 cycles.23 Mesoporous carbons with parallel channel structure decorated with nickel cobalt sulfide (NiCoS) nanoflower were successful synthesized by Al leaching following by hydrothermal process. This ordered mesoporous carbon built conductive network with NiCoS, yielding the surprising electrochemical performance with the specific supercapacitance of 1757 F g−1 at 1 A g−1.24
Nevertheless, even though there are many reports mentioned an excellent performance of metal sulfide pseudocapacitors in term of the high electrical conductivity and high capacitance values, but their structure stability of nickel–cobalt sulfide have been limited in ion diffusion, resulting in lack of reversible redox reaction at high current densities.16,25 In order to solve this issue, carbonaceous materials have been introduced as host materials, expecting to increase active sites and electrochemical stability.26 Graphene-based electrode has been recently attended for EDLC and hybrid supercapacitors.27 Interestingly, the doping process of graphene with heteroatoms (such as nitrogen, sulfur, phosphorous, etc.) was reported as an effective method to enhance its electrochemical storage performance, arising from redox surface functionality of heteroatom.28 Its great potential due to not only possessing a high electrical surface area with redox reaction but also the ability to functionalize on the surface to improve the interaction with electrolyte. Sulfur doped graphene was eco-friendly synthesized using sodium thiosulphate as sulfur source and exfoliation catalyst, presenting the high specific capacitance of 320 F g−1 at 3 A g−1 with cycling efficiency of 92% after 1500 cycles.29 Sulfur and nitrogen dual doped graphene using L-cysteine as doping agent was also reported as an excellent reversibility SCs, showing a cycling efficiency of 83.54% after 5000 cycles.30
Therefore, to develop nanostructure of nickel cobalt sulfide (NCS) onto nitrogen, sulfur dual doped graphene (NS-G) surface, the designed facile two-step process of in situ hydrothermal process with low-cost effectiveness is proposed. The morphology-crystal-structure of an intermediate nickel/cobalt carbonate hydroxides mixture is developed in presence of thiourea and graphene oxide through mild hydrothermal process. The influence of coexisting of nickel cobalt sulfide and nitrogen, sulfur dual doped graphene surface is investigated in term of electrochemical performance, capacitive rate performance and cycle stability. Thus, NCS/NS-G composites is examined as potentially an ideal candidate utilizing for hybrid supercapacitors.
2. Experimental
2.1 Materials
Nickel(II) nitrate hexahydrate (Ni(NO3)2·6H2O, >98%), hexamethylenetetramine (HMTA, >99%), sodium dodecyl sulfate (SDS, >99%) and graphite powder (particle size ≤20 μm) were supplied from Sigma-Aldrich. Cobalt(II) nitrate hexahydrate (Co(NO3)2·6H2O, >99%) was purchased from Ajax Finechem. Vulcan XC-72R carbon black (CB, average particle size of 50 nm) and PD-70T carbon fiber paper (CFP) were obtained from Fuel Cell Store. Other chemical reagents used were of analytical grade.2.2 Preparation of graphene oxide aqueous dispersion
Graphite oxide was synthesized by our modified Hummers' method. Briefly, 10 g of graphite powder and 5 g of sodium nitrate were mixed in 300 mL of concentrated sulfuric acid at 10 °C. Subsequently, 30 g of potassium permanganate were slowly added into the mixture and continually stirred at 10 °C for 4 h. After that, the reaction mixture was slowly poured into 350 ml of mixed ice water with the addition of H2O2. The filtrated products were flushed and neutralized with DI water before drying at 60 °C for 24 h. GO aqueous dispersion was prepared in DI water (2 mg ml−1) with an ultrasonic bath (50 Hz) for 3.5 h.2.3 Preparation of nickel cobalt carbonate hydroxide (NiCoCH)
10 ml of 0.5 M Ni(NO3)2·6H2O and 20 ml of 0.5 M Co(NO3)2·6H2O were mixed by control the mixture solution volume of 30 ml. 1.31 g of HMTA and 0.52 g of SDS were added and for 30 minutes. The mixture was transferred into 100 ml Teflon line autoclave and added more 20 ml of DI water. Then, the reactor was conducted at 140 °C for 14 hours. The obtained solid was filtrated and washed several times with DI water and ethanol. Finally, the obtained sample was dried at 60 °C for 24 hours.2.4 Preparation of nickel cobalt sulfide/nitrogen and sulfur dual doped graphene (NS-G/NCS) composites
0.02 g of NiCoCH was dispersed in 20 ml of DI water. Then, 30 ml of 2 mg ml−1 graphene oxide aqueous dispersion and 0.6 g thiourea was added. The mixture was sonicated for 30 minutes and transferred into a 100 mL Teflon line autoclave. The hydrothermal reaction was employed at 140 °C for 24 h. Finally, the obtained product was washed by DI water and dried using the freeze dry technique.2.5 Characterization techniques
A scanning electron microscope equipped with energy dispersive X-ray spectrometer (SEM-EDS, JEOL, JSM-IT500HR, Japan) was used to observe the sample morphology and analyze the surface element of samples. The chemical valence states of the samples were characterized by X-ray photoelectron spectroscopy (XPS, Bara Scientific, AXIS ultra DLD, UK). X-ray diffraction analysis (XRD, BRUKER, D8 ADVANCE, USA) was performed by Cu-Kα radiation (1.5406 Å) at 0.02° per minutes ranging from 5° to 80°.2.6 Preparation of working electrode samples
Working electrode samples were prepared by mixing the composite samples of active materials, carbon black, and PTFE at 70![[thin space (1/6-em)]](https://www.rsc.org/images/entities/char_2009.gif) :
:![[thin space (1/6-em)]](https://www.rsc.org/images/entities/char_2009.gif) 20
20![[thin space (1/6-em)]](https://www.rsc.org/images/entities/char_2009.gif) :
:![[thin space (1/6-em)]](https://www.rsc.org/images/entities/char_2009.gif) 10 by weight, respectively. The solid mixtures were mixed with ethanol to obtained slurry mixture and coated on carbon fiber paper sized at 1 × 1 cm2. The electrode samples were obtained after drying at 60 °C for 24 hours.
10 by weight, respectively. The solid mixtures were mixed with ethanol to obtained slurry mixture and coated on carbon fiber paper sized at 1 × 1 cm2. The electrode samples were obtained after drying at 60 °C for 24 hours.
2.7 Electrochemical characterization
Cyclic voltammetry (CV), galvanostatic charge–discharge (GCD) and electrochemical impedance spectroscopy (EIS) techniques were used to investigate the electrochemical properties of samples. Potentiostat/galvanostat instrument (Metrohm Autolab, PGSTAT204, Netherlands) configurating with three electrode systems including of sample electrode as working electrode, platinum plate as counter electrode and Ag/AgCl as reference electrode was performed in 6 M of KOH electrolyte. CV was investigated in potential range 0 V to 0.55 V, −0.3 V to 0.45 V and −0.1 V to 0.45 V for NS-G, NiCoCH and NS-G/NCS electrode, respectively, with difference scan rate from 10 to 100 mV s−1. GCD was measured in potential range 0 V to 0.44 V, −0.2 V to 0.37 V and −0.1 V to 0.4 V for NS-G, NiCoCH and NS-G/NCS electrode, respectively, with current density ranging from 1 to 10 A g−1. EIS was monitored at 5 mV over a frequency range from 0.01 Hz to 100 kHz in 1 M of KOH solution. The cycle stability was investigated by battery tester (Neware, CT4000). The symmetrical cell with CR2032 battery cell is fabricated for the GCD cycle stability, employing at 0.1 A g−1 from 1 to 10![[thin space (1/6-em)]](https://www.rsc.org/images/entities/char_2009.gif) 000 cycles in 6 M KOH electrolyte. The specific capacitance (Csp) values were calculated from GCD result as following the eqn (1).31,32 The energy density (E) and the power density (P) were calculated from eqn (2) and (3).33,34
000 cycles in 6 M KOH electrolyte. The specific capacitance (Csp) values were calculated from GCD result as following the eqn (1).31,32 The energy density (E) and the power density (P) were calculated from eqn (2) and (3).33,34
 | (1) |
 | (2) |
| P = E/T | (3) |
3. Results and discussion
3.1 Morphological characterization
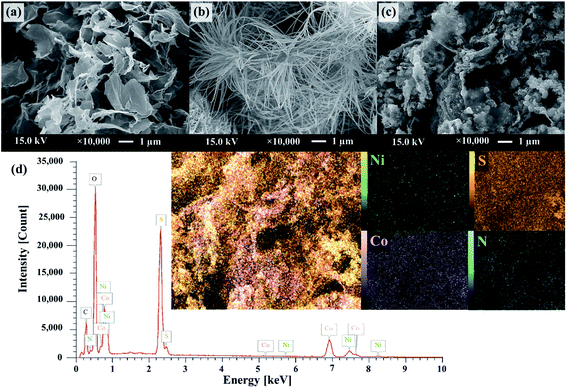
Fig. 1 schematically describes a designed facile two-step hydrothermal synthesis for nickel cobalt sulfide nanostructure embedding on nitrogen and sulfur dual doped graphene surface. Firstly, a mixture of nickel/cobalt carbonate hydroxides precursor is synthesized via a straightforward hydrothermal approach in the presence of Ni2+, Co2+, SDS and HMTA aqueous solution. Subsequently, the phase-structure-morphology of a mixture of nickel/cobalt carbonate hydroxides nanoparticle is developed to embed onto NS-G surface via second step of hydrothermal process in presence of graphene oxide aqueous dispersion and thiourea. Fig. 2 illustrates the representative surface morphologies of NS-G, nickel/cobalt carbonate hydroxide (NiCoCH) and NS-G/NCS. As seen in Fig. 2(a), NS-G manifestly shows the exfoliated layers of individual graphene sheets in 3D network structure, benefiting for electro-absorption of ion/charge electrolytes on surface, which is an excellent feature for of EDLC type materials.8,35,36 Fig. 2(b) displays the sea-urchin-like structure of NiCoCH, which is synthesized via the first step of hydrothermal process. Interestingly, the crystallinity-morphology-structure of the urchin-like structure NiCoCH precursor can be developed via the second step of hydrothermal process in presence of graphene oxide and thiourea. Fig. 2(c) presents the embedded nickel–cobalt nanoparticle on graphene surface. Obviously, the second step approach of hydrothermal process can create the well uniform of highly dense Ni–Co nanoparticles embedded on NS-G. Furthermore, the element compositions of the sample composites were analyzed using energy dispersive X-ray spectrometer. The element distribution maps of NCS/NS-G sample is presented in Fig. 2(d) revealing the distribution of Ni, Co, S and C elements, confirming the compositions of Ni–Co complex on graphene surface. The atom percentage of element composition are also exhibited in Table 1.| Elements | Mass (%) | Atom (%) |
|---|---|---|
| Nickel | 7.81 ± 0.06 | 2.69 ± 0.02 |
| Cobalt | 18.5 ± 0.08 | 6.33 ± 0.03 |
| Sulfur | 17.9 ± 0.03 | 11.3 ± 0.02 |
| Nitrogen | 1.52 ± 0.02 | 2.19 ± 0.03 |
3.2 Structural characterization
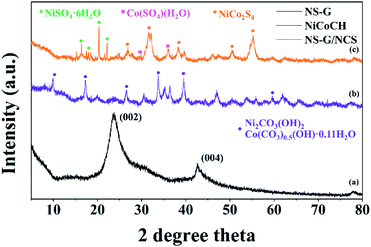
X-ray diffraction is used to investigate the crystal phase of the as-prepared samples. Fig. 3(a) exhibits the two obvious diffraction peaks of NS-G at 2θ of 23.7° and 42.6°, attributing to (002) and (001) reflection of graphitic carbon phase.29,37 The XRD pattern of as-prepared NiCoCH precursor in Fig. 3(b) reveals the diffraction peak at 2θ of 9.9°, 17.2°, 26.6°, 33.7° and 59.5°, which are a good indexed with cobalt carbonate hydroxide (PDF 00-048-0083) and nickel carbonate hydroxide (JCPDS no. 35-0501).38 Fig. 3(c) reveals the diffraction peaks of nickel cobalt sulfide at 2θ of 26.8°, 32.1°, 38.2°, 50.4° and 55.2°, corresponding with PDF 00-020-0782 reference.20,39 Nevertheless, the presence of the signal diffraction pattern of the mixed nickel(II) sulfate hexahydrate and cobalt(II) sulfate hydrate compositions are also observed, implying the coexisting of impurities phase in nickel cobalt sulfide.The valence states and chemical compositions of NCS/NS-G sample were investigated by XPS technique. Fig. 4(a) reveals the survey spectra of NCS/NS-G, ascribing the existing of C, N, S, Ni, Co and O atoms. The deconvoluted C 1s spectrum identifies the presence graphene with nitrogen and sulfur group structures (Fig. 4(b)). The four peaks deconvolution of C 1s spectrum are observed at 285.0, 285.7, 286.5 and 287.8 eV, corresponding with sp2 hybridized C![[double bond, length as m-dash]](https://www.rsc.org/images/entities/char_e001.gif) C bond, sp3 hybridized C–O/C–S/C–N, –C–O and –C
C bond, sp3 hybridized C–O/C–S/C–N, –C–O and –C![[double bond, length as m-dash]](https://www.rsc.org/images/entities/char_e001.gif) O bonding, respectively.30,37 In addition, the calculated C/O ratio of NCS/NS-G sample is 18, implying the very low content of oxygen functionality in NCS structure and confirming the effective hydrothermal reduction process in presence of thiourea.40 N 1s spectrum in Fig. 4(c) can be well fitted to the typical nitrogen doped graphene, which is deconvoluted into three individual peaks consisting of pyridinic N (399.2 eV), pyrrolic N (400.6 eV) and quaternary N (402.0 eV), respectively.30,37 Fig. 4(d) reveals the obvious two major peaks of S 2p spectrum at binding energies of 163.4 and 164.3 eV, which are corresponded with the sulfur binding in C–S bond and conjugated –C
O bonding, respectively.30,37 In addition, the calculated C/O ratio of NCS/NS-G sample is 18, implying the very low content of oxygen functionality in NCS structure and confirming the effective hydrothermal reduction process in presence of thiourea.40 N 1s spectrum in Fig. 4(c) can be well fitted to the typical nitrogen doped graphene, which is deconvoluted into three individual peaks consisting of pyridinic N (399.2 eV), pyrrolic N (400.6 eV) and quaternary N (402.0 eV), respectively.30,37 Fig. 4(d) reveals the obvious two major peaks of S 2p spectrum at binding energies of 163.4 and 164.3 eV, which are corresponded with the sulfur binding in C–S bond and conjugated –C![[double bond, length as m-dash]](https://www.rsc.org/images/entities/char_e001.gif) S– bond in aromatic carbon, respectively.30,37,41 The other two obvious peaks at around 170.1 eV and 169.0 eV can be assigned to –C–Sox–C– bonding, which are mainly derived from oxysulfide species.42,43 It is evidently seen that all mentioned XPS spectra results above suggest the successful doping of nitrogen and sulfur heteroatom onto graphene structure. For Ni 2p spectra, Fig. 4(e) illustrates two spin-orbitals at Ni 2p1/2 and Ni 2p3/2 with satellite peaks (noted as “Sat.”) at binding energy of 874.6 and 857.1 eV, respectively, ascribing to Ni2+ characteristic.40,44,45 For Co 2p spectrum, the peaks at 798.5 eV and 794.1 eV are identified with the valence states of +2 and +3 of Co 2p1/2, respectively. While, the peaks at 782.3 and 779.2 eV are respectively assigned to valence states of +2 and +3, respectively (Fig. 4(f)).41 The peaks 803.5 eV and 786.8 eV are ascribed to the satellite peaks of Co 2p3/2 and Co 2p1/2, respectively. In addition, the peak of S 2p spectrum at 161.8 and 162.3 is ascribed to 2p3/2 and 2p1/2 electrons in metal sulfide, respectively, confirming that the S element is in the divalent state (Fig. 4(d)). These results suggest the presence of the mixed valance state of Ni2+, Co2+ and Co3+ in the obtained product of NCS/NS-G composites.
S– bond in aromatic carbon, respectively.30,37,41 The other two obvious peaks at around 170.1 eV and 169.0 eV can be assigned to –C–Sox–C– bonding, which are mainly derived from oxysulfide species.42,43 It is evidently seen that all mentioned XPS spectra results above suggest the successful doping of nitrogen and sulfur heteroatom onto graphene structure. For Ni 2p spectra, Fig. 4(e) illustrates two spin-orbitals at Ni 2p1/2 and Ni 2p3/2 with satellite peaks (noted as “Sat.”) at binding energy of 874.6 and 857.1 eV, respectively, ascribing to Ni2+ characteristic.40,44,45 For Co 2p spectrum, the peaks at 798.5 eV and 794.1 eV are identified with the valence states of +2 and +3 of Co 2p1/2, respectively. While, the peaks at 782.3 and 779.2 eV are respectively assigned to valence states of +2 and +3, respectively (Fig. 4(f)).41 The peaks 803.5 eV and 786.8 eV are ascribed to the satellite peaks of Co 2p3/2 and Co 2p1/2, respectively. In addition, the peak of S 2p spectrum at 161.8 and 162.3 is ascribed to 2p3/2 and 2p1/2 electrons in metal sulfide, respectively, confirming that the S element is in the divalent state (Fig. 4(d)). These results suggest the presence of the mixed valance state of Ni2+, Co2+ and Co3+ in the obtained product of NCS/NS-G composites.
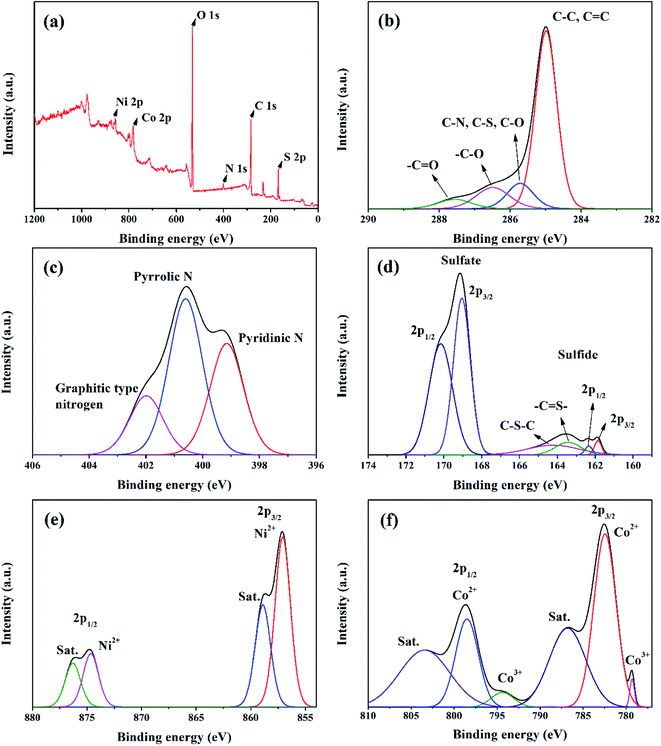 | ||
| Fig. 4 XPS spectra of NS-G/NCS composites; survey spectrum (a), C 1s spectrum (b), N 1s spectrum (c), S 2p spectrum (d), Ni 2p spectrum (e), and Co 2p spectrum (f). | ||
3.3 Electrochemical measurements
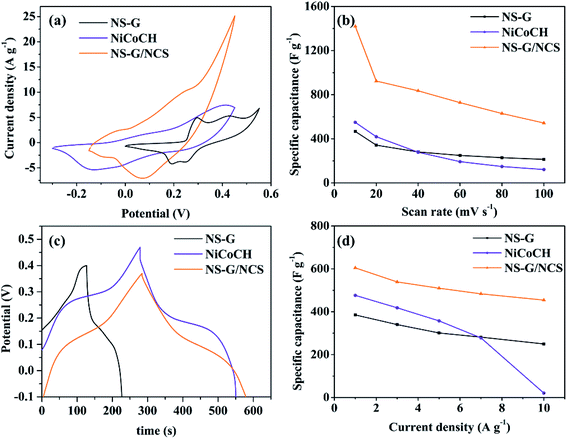
Cyclic voltammograms (CV) study has been used to evaluate the influence of NS-G, NiCoCH and NS-G/NCS electrode samples on electrochemical performance and to evaluate the specific capacitance of the as-prepared sample electrodes. Fig. 5(a) demonstrates cyclic voltammograms of NS-G, NiCoCH and NS-G/NCS. CV curve of mixed NiCoCH electrode exhibits the one anodic peak at 0.35 V and one cathodic peak at −0.15 V, indicating that the capacitive response corresponds with M–O–OH and M carbonate hydroxide (M represents Ni or Co) in sample electrodes.46,47 This pair redox peak of reversible faradaic redox reaction suggests the faradaic reaction in pseudo capacitance behavior of storage charge mechanism.44 NS-G shows a presence of a small slope oxidation peak at 0.29 and 0.42 V and reduction peaks at 0.19 and 0.24 V, arising from the heteroatom effect of nitrogen and sulfur doping on graphitic carbon of graphene structure.15,29 Meanwhile, NCS/NS-G electrode sample reveals a pair of redox peaks, attributing to faradaic reactions of M–S/M–S–OH pairs (M = Ni, Co). The two obvious redox regions are observed at between 0.1 to 0.3 V for oxidation and between 0.04 to 0.14 V for reduction, resulting from the reversible oxidation–reduction of metal-sulfur-hydroxide in KOH during given voltage potential (seen eqn (4)).19,48| M–S + OH− ⇌ M–S–OH + e− (M represents Ni or Co) | (4) |
To verify the specific capacitance values, the area in CV curve is typically analyzed to evaluate the electrochemical active surface area (ECSA), indicating a sufficient number of electroactive sites during redox reactions and an electro-absorption efficiency between active surface materials and ion/charge from electrolyte.49,50 Obviously, the introduce NCS embedded onto NS-G surface reveal the influence on the amount of charge storage as increasing in CV area characteristic due to the synergistic results of both EDLC and PC. The distinction in the current densities response for each sample electrode can be easily observed, revealing that NCS/NS-G electrode occupies the highest ECSA relating to the other electrode samples. The specific capacitance values of NS-G, NiCoCH and NCS/NS-G electrode samples are 467.1, 549.5 and 1420.2 F g−1 at 10 mV s−1, respectively. Fig. 5(b) shows the calculated specific capacitance by CV of the as-prepared electrode samples as a function with scan rate ranging from 10 to 100 mV s−1. Obviously, all sample electrodes reveal the decrease in specific capacitance with increasing scan rate due to the limitation in diffusion at high rate. Interestingly, NCS/NS-G electrode demonstrates the highest rate performance with specific capacitance of 500 F g−1 at 100 mV s−1, suggesting that the well uniform NCS nanoparticles embedded on NS-G surface can create the facile shortcut pathway maintaining such a charge/ion transport through faradaic reaction between active surface and electrolyte even at high current.
Furthermore, the comparative voltage–time curves of NS-G, NiCoCH and NS-G/NCS at 1 A g−1 are presented in Fig. 5(c). GCD curves of all the as-prepared sample electrodes exhibit a very low potential drop at the initial of the discharge process and plateau curve of discharge profile, implying a low internal resistance in electrode system and a good pseudo-capacitance behavior.51,52 Among of them, NCS/NS-G electrode demonstrates the presence of the longest plateau discharge time, confirming the highest specific capacitance values. Apparently, the impregnated NCS nanoparticles on NS-G surface can enhance the electro-absorption and pseudocapacitance behavior, attributing to the synergistic effect of the well uniform NCS embedding on NS-G surface.28 The calculated specific capacitance values from GCD results of the as-prepared electrode samples of NS-G, NiCoCH and NCS/NS-G are 385.22, 476.58 and 630.57 F g−1 at 1 A g−1, respectively, which is a good agreement with CV results. The further investigation on the rate performance of the as-prepared electrode samples at current densities ranging from 1 to 10 A g−1 is shown in Fig. 5(d). Obviously, the co-presence of NCS and NS-G can improve the capacitive rate performance, resulting from the enhancing of ion diffusion contribution participating in charge storage mechanism. Thus, this as-prepared electrode undoubtedly possesses the highest rate performance by maintaining 76.7% capacitance value from 1 to 10 A g−1, which is superior to that of the other electrodes.
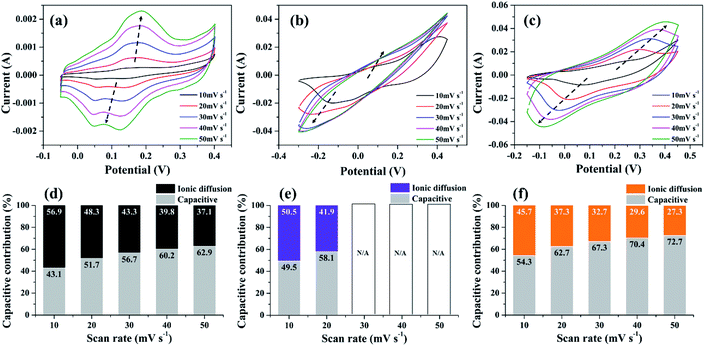
To further emphasize the influence of NS-G on charge storage mechanism of NS-G/NCS, the CV analysis of the as-prepared samples at various scan rates ranging from 10 to 50 mV s−1 is examined. As seen in Fig. 6(a)–(c), CV curve of NS-G electrode reveals the rectangular-like shape with the presence of redox region, which preserves the reversible redox reaction even at high rate. In contrast, CV curve of NiCoCH electrode exhibits the reversible redox only at low scan rate. Obviously, the current response peak at oxidation and redox reaction is disappeared at over 30 mV s−1 due to ion diffusion limitation of NiCoCH surface. In addition, the embedding NCS onto NS-G surface can enhance the reversible redox reaction of NCS as a presence of a pair redox reaction at high rate. The charge storage contribution of each electrode is analyzed using the relationship between the peak currents (i) and scan rate (ν) by plotting i/ν1/2 and ν1/2 (eqn (5)).
| i = k1ν + k2ν1/2 | (5) |
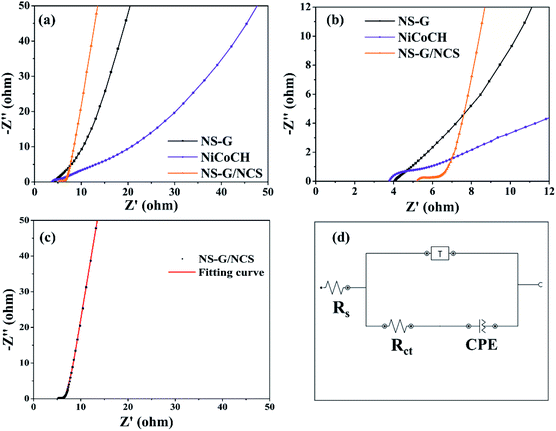
The comparative Nyquist plots of NS-G, NiCoCH and NS-G/NCS electrode samples using electrochemical impedance spectroscopic (EIS) at frequency range 0.01–10![[thin space (1/6-em)]](https://www.rsc.org/images/entities/char_2009.gif) 000 Hz in 1 M KOH are investigated as shown in Fig. 7. The solution resistance (Rs), faradaic charge transfer resistance (Rct) and the capacitive behavior of electrode materials are observed. All electrode samples expose two parts, consisting of a semicircular region at high/medium frequency and a relatively linear response at low frequency. The initial value of semicircle region at beginning plot refers to the resistance between material surface interaction between active materials, current corrector and electrolyte. The arc line intersection of semicircle corresponds with the total resistance of electrode, relating to electron-transfer-limited processes. A phase angle of relative linear region corresponds with ion/charge diffusion into porous and interlayer of materials.54,55 Among of all the as-prepared electrode samples, NS-G/NCS electrode obviously demonstrates the low electronic/ionic resistances at high frequency and the smallest semicircle of arc line intersection curve with the vertical line characteristic of capacitive behavior at medium-low frequencies, indicating the fastest ion/charge diffusion and lowest total resistance of the electrode behaviors. This result confirms the improvement of electrical conductivity and ion/charge transport of NS-G/NCS electrode, affecting form the well uniform NCS nanoparticles embedded on NS-G surface. In addition, the equivalent-circuit model is employed to simulate the EIS fitting spectra as seen in Fig. 7(d). The circuit fitting values and the calculated chi-square statistics are presented as in Table 2, confirming the lowest solution resistance (Rs) and charge transfer resistance (Rct) of NS-G/NCS electrode (chi square of 0.02).
000 Hz in 1 M KOH are investigated as shown in Fig. 7. The solution resistance (Rs), faradaic charge transfer resistance (Rct) and the capacitive behavior of electrode materials are observed. All electrode samples expose two parts, consisting of a semicircular region at high/medium frequency and a relatively linear response at low frequency. The initial value of semicircle region at beginning plot refers to the resistance between material surface interaction between active materials, current corrector and electrolyte. The arc line intersection of semicircle corresponds with the total resistance of electrode, relating to electron-transfer-limited processes. A phase angle of relative linear region corresponds with ion/charge diffusion into porous and interlayer of materials.54,55 Among of all the as-prepared electrode samples, NS-G/NCS electrode obviously demonstrates the low electronic/ionic resistances at high frequency and the smallest semicircle of arc line intersection curve with the vertical line characteristic of capacitive behavior at medium-low frequencies, indicating the fastest ion/charge diffusion and lowest total resistance of the electrode behaviors. This result confirms the improvement of electrical conductivity and ion/charge transport of NS-G/NCS electrode, affecting form the well uniform NCS nanoparticles embedded on NS-G surface. In addition, the equivalent-circuit model is employed to simulate the EIS fitting spectra as seen in Fig. 7(d). The circuit fitting values and the calculated chi-square statistics are presented as in Table 2, confirming the lowest solution resistance (Rs) and charge transfer resistance (Rct) of NS-G/NCS electrode (chi square of 0.02).
| Sample | Rs (ohm) | Rct (ohm) | Constant phase element (CPE; Q) | Tangant hyperbolic (T) | Chi square | ||
|---|---|---|---|---|---|---|---|
| Y0 (mMho sN) | N | Y0 (mMho s(1/2)) | B (s(1/2)) | ||||
| NS-G | 3.86 | 1.11 | 3.8 | 0.729 | 9.07 | 0.45 | 0.07 |
| NiCoCH | 3.80 | 5.40 | 47.8 | 0.437 | 6.85 | 3.33 | 0.16 |
| NS-G/NCS | 5.20 | 1.59 | 61.0 | 0.904 | 11.50 | 1.12 | 0.02 |
The cycle stability of samples is performed using symmetrical cell of CR2032 battery call at 0.1 A g−1, employing from 1 to 10![[thin space (1/6-em)]](https://www.rsc.org/images/entities/char_2009.gif) 000 cycles in 6 M KOH electrolyte. Fig. 8 demonstrates the comparative capacitance retention of all electrode samples from 1 to 10
000 cycles in 6 M KOH electrolyte. Fig. 8 demonstrates the comparative capacitance retention of all electrode samples from 1 to 10![[thin space (1/6-em)]](https://www.rsc.org/images/entities/char_2009.gif) 000 cycles. It is clearly seen that NS-G can preserve the constant 100% stability after 10
000 cycles. It is clearly seen that NS-G can preserve the constant 100% stability after 10![[thin space (1/6-em)]](https://www.rsc.org/images/entities/char_2009.gif) 000 cycles. Meanwhile, NiCoCH exhibits the activation of the phase-crystal-structure development during charge–discharge process, providing the retention increase to 131.2% after 10
000 cycles. Meanwhile, NiCoCH exhibits the activation of the phase-crystal-structure development during charge–discharge process, providing the retention increase to 131.2% after 10![[thin space (1/6-em)]](https://www.rsc.org/images/entities/char_2009.gif) 000 cycles. For NCS/NS-G electrode, the capacitive performance is increased at initial 2400 cycles (136.2% retention) and is slightly decreased to 110% retention after 10
000 cycles. For NCS/NS-G electrode, the capacitive performance is increased at initial 2400 cycles (136.2% retention) and is slightly decreased to 110% retention after 10![[thin space (1/6-em)]](https://www.rsc.org/images/entities/char_2009.gif) 000 cycles. The increase in % retention during the charge/discharge cycling could be explained as the development of metastable structural state of transition metal oxide into crystal structure.56,57 This result implies the phase-crystal-structure development, resulting from surface liquidation of the large amount of sulfate species during charge–discharge process.43,58
000 cycles. The increase in % retention during the charge/discharge cycling could be explained as the development of metastable structural state of transition metal oxide into crystal structure.56,57 This result implies the phase-crystal-structure development, resulting from surface liquidation of the large amount of sulfate species during charge–discharge process.43,58
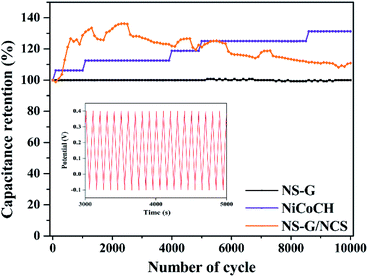 | ||
| Fig. 8 Specific capacitance retention of NS-G, NiCoCH and NS-G/NCS as a function of cycle number at 0.1 A g−1; inset shows the GCD curve of NS-G/NCS electrode. | ||
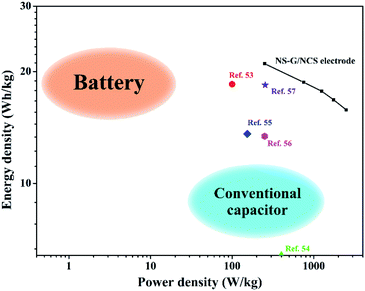
In addition, the energy-power performance of NCS/NS-G electrode is revealed as the Ragone plot in Fig. 9. The energy density and power density are calculated as following the eqn (2) and (3), respectively. NCS/NS-G electrode can reach an energy density in rang of 19.35–14.83 W h kg−1 and power density in range of 235.0–2350.0 W kg−1. The comparison of electrochemical NCS/NS-G electrode sample with other reports are also illustrated in Table 3. These results suggest a high sufficient performance of NCS/NS-G electrode and its performance outperform many previous reports of nickel/cobalt-based materials such as cobalt sulfide/graphitic carbon nitride (18.5 W h kg−1 at power density of 99.8 W kg−1),59 Co3O4 thin film (6.4 W h kg−1 at power density of 0.4 kW kg−1),60 beta phase Co(OH)2 nanowires (13.6 W h kg−1 at power density of 153 W kg−1),61 graphene/Co3O4/polypyrrole (13.4 W h kg−1 at power density of 250 W kg−1),62 and nickel cobalt sulfide nanosheets on Ni nanowire film (18.4 mW h cm−3 at power density of 254.5 mW cm−3).63
| Materials | Electrolyte | Specific capacitance | Cycling stability | References |
|---|---|---|---|---|
| Ni3S2@VO2 | 2 M KOH | 1.09C cm−2 (1 mA cm−2) | 91.7%, 1000 cycles | 64 |
| Ni3S2 films | 1 M KOH | 3.42 F cm−2 (1 mA cm−2) | 76.6%, 2000 cycles | 54 |
| S-doped ZnCo2O4 micro-spindles | 3 M KOH | 522 F g−1 (0.5 A g−1) | 78.0%, 5000 cycles | 65 |
| PANI/NiHCF/sCNT | 1 M H2SO4 | 430.8 F g−1 (2 mA cm−2) | 74.3%, 1000 cycles | 66 |
| Ni-doped CoHCF microcubes | 1 M Na2SO4 | 466 F g−1 (5 mV s−1) | 87.9%, 2000 cycles | 67 |
| Co3O4 nanotubes | 6 M KOH | 574 F g−1 (0.1 A g−1) | 95.0%, 1000 cycles | 31 |
| Co3O4 thin film | 1 M KOH | 162 F g−1 (10 mV s−1) | 98.3%, 1000 cycles | 60 |
| Nanorod nickel cobalt hydroxide | 1 M KOH | 456 F g−1 (20 mV s−1) | 91.0%, 1000 cycles | 68 |
| Graphene/Co3O4/polypyrrole | 6 M KOH | 385 F g−1 (1 A g−1) | — | 62 |
| NS-G/NCS | 6 M KOH | 1420.2 F g−1 (10 mV s−1) | 110%, 10![[thin space (1/6-em)]](https://www.rsc.org/images/entities/char_2009.gif) 000 cycles 000 cycles |
This work |
4. Conclusion
Nickel cobalt sulfide nanoparticle/nitrogen and sulfur dual doped graphene are successfully synthesized by the facile hydrothermal process. The significant development of crystal-phase-structure of sea-urchin-like NiCoCH through hydrothermal process in presence of graphene oxide and thiourea yields the well uniform nickel cobalt sulfide nanoparticles embedded on nitrogen and sulfur dual doped graphene surface. This unique structure feature offers the significantly enhanced active sites to promotes fast ion/charge transport and enhances the synergistic electrochemical performance. NCS/NS-G electrode composites can reach the high specific capacitance of 1420.2 F g−1 at 10 mV s−1 and 630.6 at 1 A g−1. In the presence of NS-G, the capacitance rate (ranging from 1 to 10 A g−1) of NCS/NS-G is improved by maintaining 76.65% initial capacitive values. NCS/NS-G symmetrical supercapacitors CR2302 cell exhibits the excellent cycling stability (110% after 10![[thin space (1/6-em)]](https://www.rsc.org/images/entities/char_2009.gif) 000 cycles). The high energy density of 19.35–14.83 W h kg−1 and high-power density of 235.0–2350.0 W kg−1 evidently confirm the potential usage of the developed materials as a candidate for high performance supercapacitors. The authors believe that the novel route with low-cost effectiveness in this study can open new avenue for scale-up process of energy storage materials.
000 cycles). The high energy density of 19.35–14.83 W h kg−1 and high-power density of 235.0–2350.0 W kg−1 evidently confirm the potential usage of the developed materials as a candidate for high performance supercapacitors. The authors believe that the novel route with low-cost effectiveness in this study can open new avenue for scale-up process of energy storage materials.
Author contributions
Nutthapong Poompiew: methodology, formal analysis, investigation, visualization, writing – original draft. Prasit Pattananuwat: conceptualization, writing – review and editing, supervision. Pranut Potiyaraj: conceptualization, writing – review and editing, project administration.Conflicts of interest
There are no conflicts to declare.Acknowledgements
This research was supported by the 90th Anniversary of Chulalongkorn University (Ratchadaphisek somphot Endowment Fund). Additionally, the authors also would like to thank Metallurgy and Materials Science Research Institute (MMRI) for XRD and electrochemical instrument and knowledge supporting.References
- B. Dunn, H. Kamath and J.-M. Tarascon, Science, 2011, 334, 928 CrossRef CAS PubMed.
- D. P. Dubal, O. Ayyad, V. Ruiz and P. Gomez-Romero, Chem. Soc. Rev., 2015, 44, 1777–1790 RSC.
- S. Najib and E. Erdem, Nanoscale Adv., 2019, 1, 2817–2827 RSC.
- L. Wu, L. Shen, T. Wang, X. Xu, Y. Sun, Y. Wang, Y. Zhao, Y. Du and W. Zhong, J. Alloys Compd., 2018, 766, 527–535 CrossRef CAS.
- M. I. Rafiq, T. Farid, J. Zhou, A. Ali, J. Tang and W. Tang, J. Alloys Compd., 2019, 811, 151858 CrossRef CAS.
- L. Li, H. Song, Q. Zhang, J. Yao and X. Chen, J. Power Sources, 2009, 187, 268–274 CrossRef CAS.
- J. Zhu, M. Chen, H. Qu, X. Zhang, H. Wei, Z. Luo, H. A. Colorado, S. Wei and Z. Guo, Polymer, 2012, 53, 5953–5964 CrossRef CAS.
- P. Pattananuwat and D. Aht-ong, Electrochim. Acta, 2017, 224, 149–160 CrossRef CAS.
- P. Pattananuwat and D. Aht-Ong, Mater. Lett., 2016, 184, 60–64 CrossRef CAS.
- Y. He, P. Zhang, H. Huang, X. Li, X. Zhai, B. Chen and Z. Guo, Electrochim. Acta, 2020, 343, 136140 CrossRef CAS.
- A. U. Ammar, I. D. Yildirim, F. Bakan and E. Erdem, Beilstein J. Nanotechnol., 2021, 12, 49–57 CrossRef CAS PubMed.
- S. Najib, F. Bakan, N. Abdullayeva, R. Bahariqushchi, S. Kasap, G. Franzo, M. Sankir, N. Demirci Sankir, S. Mirabella and E. Erdem, Nanoscale, 2020, 12, 16162–16172 RSC.
- M. Toufani, S. Kasap, A. Tufani, F. Bakan, S. Weber and E. Erdem, Nanoscale, 2020, 12, 12790–12800 RSC.
- S. Kasap, I. I. Kaya, S. Repp and E. Erdem, Nanoscale Adv., 2019, 1, 2586–2597 RSC.
- D. Pan, M. Zhang, Y. Wang, Z. Yan, J. Jing and J. Xie, Chem. Phys. Lett., 2017, 685, 457–464 CrossRef CAS.
- P. Asen, S. Shahrokhian and A. Irajizad, Int. J. Hydrogen Energy, 2017, 42, 21073–21085 CrossRef CAS.
- H. Su, T. Wang, S. Zhang, J. Song, C. Mao, H. Niu, B. Jin, J. Wu and Y. Tian, Solid State Sci., 2012, 14, 677–681 CrossRef CAS.
- Z. Zhou, N. Cai and Y. Zhou, Mater. Chem. Phys., 2005, 94, 371–375 CrossRef CAS.
- T. V. Nguyen, L. T. Son, P. M. Thao, L. T. Son, D. T. Phat, N. T. Lan, N. V. Nghia and T. V. Thu, J. Alloys Compd., 2020, 831, 154921 CrossRef CAS.
- Z. Ma, Z. Sun, H. Jiang, F. Li, Q. Wang and F. Qu, Appl. Surf. Sci., 2020, 533, 147521 CrossRef CAS.
- L. G. Beka, X. Li and W. Liu, Sci. Rep., 2017, 7, 2105 CrossRef PubMed.
- T.-F. Hung, Z.-W. Yin, S. B. Betzler, W. Zheng, J. Yang and H. Zheng, Chem. Eng. J., 2019, 367, 115–122 CrossRef CAS.
- B. Chameh, M. Moradi and S. Kaveian, Synth. Met., 2020, 260, 116262 CrossRef CAS.
- Y. Chen, C. Jing, X. Fu, M. Shen, K. Li, X. Liu, H.-C. Yao, Y. Zhang and K. X. Yao, Chem. Eng. J., 2020, 384, 123367 CrossRef CAS.
- P. Miao, J. He, Z. Sang, F. Zhang, J. Guo, D. Su, X. Yan, X. Li and H. Ji, J. Alloys Compd., 2018, 732, 613–623 CrossRef CAS.
- Y. Liu, G. Jiang, B. Yu, U. Evariste and P. Ma, J. Alloys Compd., 2020, 832, 154909 CrossRef CAS.
- P.-R. Wu, C.-L. Wu and D.-H. Chen, J. Alloys Compd., 2018, 735, 409–416 CrossRef CAS.
- F. Y. Ban, S. Jayabal, H. N. Lim, H. W. Lee and N. M. Huang, Ceram. Int., 2017, 43, 20–27 CrossRef CAS.
- N. Parveen, M. O. Ansari, S. A. Ansari and M. H. Cho, J. Mater. Chem. A, 2016, 4, 233–240 RSC.
- J. Huo, P. Zheng, X. Wang and S. Guo, Appl. Surf. Sci., 2018, 442, 575–580 CrossRef CAS.
- J. Xu, L. Gao, J. Cao, W. Wang and Z. Chen, Electrochim. Acta, 2010, 56, 732–736 CrossRef CAS.
- J. Zhang, F. Liu, J. P. Cheng and X. B. Zhang, ACS Appl. Mater. Interfaces, 2015, 7, 17630–17640 CrossRef CAS PubMed.
- P. Sivakumar, M. Jana, M. Kota, H. S. Lee and H. S. Park, J. Alloys Compd., 2019, 781, 515–523 CrossRef CAS.
- S. Li, K. Yang, P. Ye, H. Jiang, Z. Zhang, Q. Huang and L. Wang, Appl. Surf. Sci., 2019, 473, 326–333 CrossRef CAS.
- S. Wen, K. Qin, P. Liu, N. Zhao, C. Shi, L. Ma and E. Liu, J. Alloys Compd., 2019, 783, 625–632 CrossRef CAS.
- Z. Li, M. Tian, X. Sun, H. Zhao, S. Zhu and X. Zhang, J. Alloys Compd., 2019, 782, 986–994 CrossRef CAS.
- A. G. Kannan, J. Zhao, S. G. Jo, Y. S. Kang and D.-W. Kim, J. Mater. Chem. A, 2014, 2, 12232–12239 RSC.
- C. Zhao, C. Chen, F. Du and J. Wang, RSC Adv., 2015, 5, 38533–38537 RSC.
- D. Khalafallah, Q. Zou, M. Zhi and Z. Hong, Electrochim. Acta, 2020, 350, 136399 CrossRef CAS.
- H. Wang, C. M. B. Holt, Z. Li, X. Tan, B. S. Amirkhiz, Z. Xu, B. C. Olsen, T. Stephenson and D. Mitlin, Nano Res., 2012, 5, 605–617 CrossRef CAS.
- J. Cao, Y. Hu, Y. Zhu, H. Cao, M. Fan, C. Huang, K. Shu, M. He and H. C. Chen, Chem. Eng. J., 2021, 405, 126928 CrossRef CAS.
- M. Gao, L. He, Z. Y. Guo, Y. R. Yuan and W. W. Li, ACS Appl. Mater. Interfaces, 2020, 12, 443–450 CrossRef CAS PubMed.
- M. Gao, Z. Y. Guo, X. Y. Wang and W. W. Li, ChemSusChem, 2019, 12, 5291–5299 CrossRef CAS PubMed.
- Z. Wei, J. Yuan, S. Tang, D. Wu and L. Wu, J. Colloid Interface Sci., 2019, 542, 15–22 CrossRef CAS PubMed.
- C.-H. Mun, C. V. V. Muralee Gopi, R. Vinodh, S. Sambasivam, I. M. Obaidat and H.-J. Kim, J. Energy Storage Convers., 2019, 26, 100925 CrossRef.
- A. Bera, A. Maitra, A. K. Das, L. Halder, S. Paria, S. K. Si, A. De, S. Ojha and B. B. Khatua, ACS Appl. Electron. Mater., 2020, 2, 177–185 CrossRef CAS.
- X. Cao, Y. Liu, Y. Zhong, L. Cui, A. Zhang, J. M. Razal, W. Yang and J. Liu, J. Mater. Chem. A, 2020, 8, 1837–1848 RSC.
- M. Dong, Z. Wang, G. Yan, J. Wang, H. Guo and X. Li, J. Alloys Compd., 2020, 822, 153645 CrossRef CAS.
- Y. Zou, C. Cai, C. Xiang, P. Huang, H. Chu, Z. She, F. Xu, L. Sun and H.-B. Kraatz, Electrochim. Acta, 2018, 261, 537–547 CrossRef CAS.
- X. Ren, Y. Du, M. Song, Y. Chen, Y. Zhou, F. Ma and J. Wan, J. Alloys Compd., 2019, 806, 1481–1490 CrossRef CAS.
- Z. Wang, H. Wang, S. Ji, H. Wang, D. J. L. Brett and R. Wang, J. Alloys Compd., 2020, 814, 151789 CrossRef CAS.
- W. Hu, H. Wei, Y. She, X. Tang, M. Zhou, Z. Zang, J. Du, C. Gao, Y. Guo and D. Bao, J. Alloys Compd., 2017, 708, 146–153 CrossRef CAS.
- Y. Lan, H. Zhao, Y. Zong, X. Li, Y. Sun, J. Feng, Y. Wang, X. Zheng and Y. Du, Nanoscale, 2018, 10, 11775–11781 RSC.
- J. Li, S. Wang, T. Xiao, X. Tan, P. Xiang, L. Jiang, C. Deng, W. Li and M. Li, Appl. Surf. Sci., 2017, 420, 919–926 CrossRef CAS.
- D. Y. Kim, G. S. Ghodake, N. C. Maile, A. A. Kadam, D. Sung Lee, V. J. Fulari and S. K. Shinde, Sci. Rep., 2017, 7, 9764 CrossRef PubMed.
- P. R. Martins, A. L. Araújo Parussulo, S. H. Toma, M. A. Rocha, H. E. Toma and K. Araki, J. Power Sources, 2012, 218, 1–4 CrossRef CAS.
- T. Deng, W. Zhang, O. Arcelus, J. G. Kim, J. Carrasco, S. J. Yoo, W. Zheng, J. Wang, H. Tian, H. Zhang, X. Cui and T. Rojo, Nat. Commun., 2017, 8, 15194 CrossRef CAS PubMed.
- F. I. Dar, K. R. Moonoosawmy and M. Es-Souni, Nanoscale Res. Lett., 2013, 8, 363 CrossRef PubMed.
- D. Jiang, Q. Xu, S. Meng, C. Xia and M. Chen, J. Alloys Compd., 2017, 706, 41–47 CrossRef CAS.
- S. G. Kandalkar, J. L. Gunjakar and C. D. Lokhande, Appl. Surf. Sci., 2008, 254, 5540–5544 CrossRef CAS.
- Y. Tang, Y. Liu, S. Yu, S. Mu, S. Xiao, Y. Zhao and F. Gao, J. Power Sources, 2014, 256, 160–169 CrossRef CAS.
- M. Khalaj, A. Sedghi, H. N. Miankushki and S. Z. Golkhatmi, Energy, 2019, 188, 116088 CrossRef CAS.
- S. Xu, C. Su, T. Wang, Y. Ma, J. Hu, J. Hu, N. Hu, Y. Su, Y. Zhang and Z. Yang, Electrochim. Acta, 2018, 259, 617–625 CrossRef CAS.
- H. Du, F. Ding, J. Zhao, X. Zhang, Y. Li, Y. Zhang, J. Li, X. Yang, K. Li and Y. Yang, Appl. Surf. Sci., 2020, 508, 144876 CrossRef CAS.
- Y. Yang, C. Yang, K. Tao, Q. Ma and L. Han, Vacuum, 2020, 181, 109740 CrossRef CAS.
- Y. Wang, Y. Yang, X. Zhang, C. Liu and X. Hao, J. Solid State Electrochem., 2015, 19, 3157–3168 CrossRef CAS.
- Y. Qiu, Y. Lin, H. Yang and L. Wang, J. Alloys Compd., 2019, 806, 1315–1322 CrossRef CAS.
- R. R. Salunkhe, K. Jang, S.-w. Lee and H. Ahn, RSC Adv., 2012, 2, 3190 RSC.
Footnotes |
| † Electronic supplementary information (ESI) available. See DOI: 10.1039/d1ra03607f |
| ‡ These authors contributed equally to this work. |
| This journal is © The Royal Society of Chemistry 2021 |


