 Open Access Article
Selenium and sulphur reactions involved in manganese reduction from sulphate solutions
Q. L. Reyes-Moralesa,
V. E. Reyes-Cruz *a,
A. Trujillo-Estradab,
J. A. Cobos-Murciaa,
G. Urbano-Reyesa and
M. Pérez-Labraa
aUniversidad Autónoma del Estado de Hidalgo, Área Académica de Ciencias de la Tierra y Materiales, Carr. Pachuca-Tulancingo km 4.5 s/n, Mineral de la Reforma, Hidalgo, México. E-mail: reyescruz16@yahoo.com
bConsejo Nacional de Ciencia y Tecnología, Depto. de Cátedras, Av. Insurgentes Sur 1582, Col. Crédito Constructor, Deleg. Benito Juárez, Ciudad de México, CP. 03940, México
First published on 23rd July 2021
Abstract
Electrochemical reduction of ionic species during manganese deposition from sulphated aqueous solutions has been studied in an electrochemical reactor with two anionic exchange membranes. Thermodynamic analysis, voltammetries, and chronopotentiometries were used to determine the reaction mechanism of the reductions developed, with the results demonstrating that the effect of the elemental selenium on the hydrogen evolution leads to the formation of elemental sulphur by reducing the sulphate ions with both membranes. It was also evident that in the range of −25 to −50 A m−2 the electrodeposition of metallic manganese begins, with minimal interference from parasitic reactions.
1 Introduction
Electrolytic Metal Manganese (MME) is an extremely important material in the metallurgical and energetic industries because its purity reaches up to 99.9%,1 thus making it vital in the production of Advanced High-Strength Steels (AHSS) where it constitutes between 12% and 30% of the alloy.2 Additionally, in recent years there has been a growing interest in using this substance to obtain specific phases of manganese dioxide in order to manufacture more efficient lithium-ion batteries.3 Since manganese is a highly reactive metal with a tendency to form oxides easily,4 MME is obtained by electrowinning in compartment reactors separated by an ionic membrane which prevents the formation of anode products that compete with the deposition process.5 Consequently, a catholyte is required (from which the MME will be extracted) as well as an anolyte solution composed of an acid or salt, with common anions with the manganese salt used in the catholyte.6Most MME is produced from manganese sulphate solutions since they are more electrochemically stable, generate a more uniform coating, and are precursors to most industrial manganous compounds;7,8 this configuration allows the purity standards characteristic of MME to be attained. However, the energetic requirements of the process are high since manganese has the highest reduction potential of metals recoverable from aqueous solutions and the deposition process involves the evolution of hydrogen.9
Several research efforts related to obtaining MME have focused on optimising the process by altering the temperature, pH, and chemical characteristics of the catholyte; moreover, different manganese salts and stabilising species have been employed to decrease the evolution of hydrogen and to stimulate the manganese deposition.9–20 In addition to the modifications in the catholyte, electrodes of different materials have also been studied.21
Although the literature contains a large amount of data on the general characteristics of obtained metal and the related energy parameters, there is a notable absence of research examining the reduction processes involved in the formation of MME via sulphate solutions. An investigation of these processes is useful in understanding how the species present in the catholyte can influence the manganese deposition. Hence, the present work aims to delve into the reaction mechanisms related to the Mn2+ reduction from manganese sulphate solutions that have not been explored. To achieve this goal, an electrochemical membrane reactor was used with a Ti cathode and a Dimensionally Stable Anode (DSA) comprising a Ti substrate coating with RuO2 (Ti|RuO2), as well as two anionic exchange membranes.
2 Experimental
2.1 Speciation studies
For the preliminary speciation study, Pourbaix diagrams were constructed using the Hydra Medusa software. This process considered a potential range of −2.5 to 0.5 V vs. SHE (Standard Hydrogen Electrode), a standard temperature of 25 °C, and concentrations of 0.27 M for Mn2+, 1.18 M for SO42−, and 1.82 for NH4+ based on the preparation of the catholyte described below.2.2 Catholyte and anolyte preparation
For the electrochemical tests, three catholytes were used: firstly, CMn catholyte was prepared with 0.27 M of MnSO4, 0.91 M of (NH4)2SO4, and 0.54 mM of SeO2; secondly, CF catholyte was prepared with 0.91 M of (NH4)2SO4 and 0.54 mM of SeO2; thirdly CFSe catholyte was prepared with 0.27 M of MnSO4 and 0.91 M of (NH4)2SO4. In this way, the supporting electrolyte solution was 0.91 M (NH4)2SO4, while MnSO4 is the most common salt used for the manganese electrowinning process. Further, SeO2 is used to inhibit the hydrogen evolution and promote the manganese electrodeposition.20In the case of the anolyte, a 0.5 M H2SO4 solution was utilised to provide common cations with catholyte. In both cases, the most appropriate combination of reagents was used as reported in the literature.15,22 The pH of the catholyte was measured using a Thermo Scientific Orion Star A series potentiometer and an Orion 8107UWMMD pH triode.
2.3 Materials and electrode preparation
The modified Ti|RuO2 electrode was prepared using the Pechini method. Therefore, a precursor polymer solution was employed with 12 mM of citric acid and 50 mM of ethylene glycol, which were mixed and heated to 70 °C on a heating grill before the addition of 2 mM of RuCl3; at this point, the mixture was stirred until homogenisation. The ink obtained was applied as a coating on the Ti plate, which had previously been treated in a pure hydrochloric acid bath for 15 minutes to strip the surface and provide a rough texture. There was also a subsequent bath of concentrated nitric acid to clean the surface. Once coated, the plate was subjected to a sintering process with a heating ramp at 5 °C min−1 until a temperature of 500 °C was achieved; it was kept at this temperature for five hours to obtain the final RuO2 coating. On the other hand, an unmodified Ti plate was used as the cathode; before each experiment, the electrode surface was mechanically polished to a mirror finish with silicon carbide sandpaper (1200 and 1500#).2.4 Ion exchange membranes
The membranes evaluated in the present work – both anionic membranes – were Neosepta AMX and AMI 7001s. AMX has a PS/DVB structure, an ion exchange capacity of 1.4–1.7 meq g−1, a thickness of 0.12–0.18 mm and a resistivity of 20–35 Ω cm2.23,24 AMI also has a PS/DVB structure, with an ion exchange capacity of 1.3 ± 0.1 meq g−1, a thickness of 0.45 ± 0.025 mm, and a resistivity of <40 Ω cm2.24 Both membranes were activated via immersion in 5% sodium chloride solution for one day. Having been stored in this solution, they were then rinsed with deionised water for use. Although both membranes have similar properties, resistivity and thickness are different for each membrane. Both properties have the possibility of affecting the overpotential at which some reactions are carried out.2.5 Electrochemical experiments
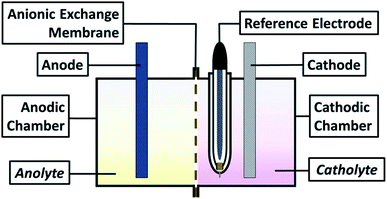
For all experiments, a typical three-electrode electrochemical cell of glass with separate compartments was employed. The Ti electrode was placed in the cathodic compartment, maintaining an electroactive area of 20 cm2 and a Saturated Calomel Electrode as reference (SCE, E = 0.242 V vs. SHE); in contrast, the modified Ti|RuO2 electrode was used on the anodic side. The solutions utilised were the catholyte and anolyte in their respective compartments (see scheme in Fig. 1).Cyclic voltammetry studies of both membranes were performed using a Princeton Applied Research 263A® potentiostat/galvanostat controlled by PowerSuite 3.0® software (in a bias potentials range of −2.00 to 0.5 V vs. SCE) with a sweep speed of 25 mV s−1. Chronopotentiometric tests of 120 seconds were conducted with the same electrochemical arrangement. The times managed in these tests were designed to identifying the electrochemical reactions developed on the electrode in contact with the solution, as well as identify the formation of perceptible metallic deposit. This because the process is controlled by the transfer of charge and not mass; an ideal condition when operating in a galvanostatic way to identify reaction processes.
2.6 Characterization of deposits and precipitates
The surface morphological characterization of the deposits obtained on the electrodes was carried out by JEOL scanning electron microscope (SEM), model 6300 at 100× and 30 kV. X-ray diffraction (XRD) was carried out on the deposits and precipitates obtained using an Equinox 2000 X-ray diffractometer (Inel), which uses a monochromatic Co Kα radiation (λ = 1.789 Å), produced at 30 kV and 20 mA, to identify the manganese, selenium and sulphur species present. The chemical composition of deposits and precipitates generated was determined by inductive couple plasma (ICP).3 Results and discussion
3.1 Thermodynamic study of Mn species
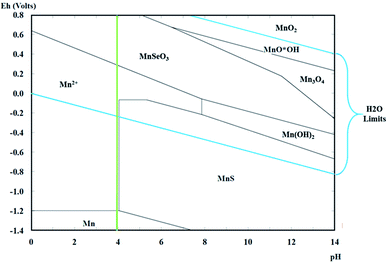
The Pourbaix diagrams in Fig. 2 demonstrate the chemical equilibrium for manganese species considering the concentrations of the ions in the synthetic catholyte (1.82 M for NH4+, 1.18 M for SO42−, and 0.27 M for Mn2+ at a standard temperature of 25 °C). The diagram has a green line that indicates the initial pH of the catholyte (pH 4).According to Fig. 2, the reduction to metallic manganese should begin at −1.2 V vs. SHE (corresponding to −1.442 V vs. SCE) at pH 4. Meanwhile, in these pH conditions, the evolution of hydrogen should start at −0.240 V vs. SHE (corresponding to −0.482 V vs. SCE); therefore, the presence of this concomitant process can be assumed during the deposition of metallic manganese.
3.2 Electrochemical study
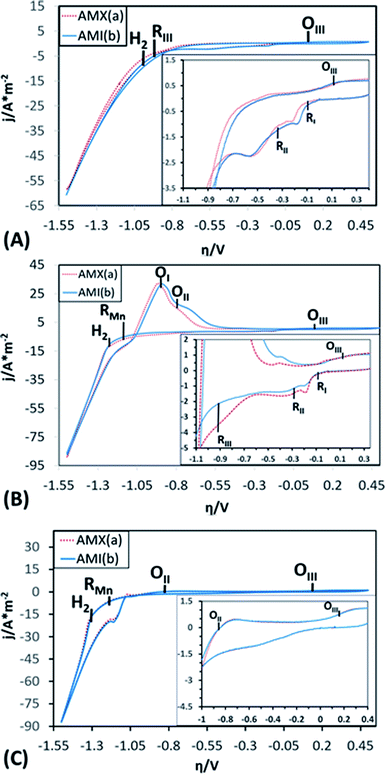
To demonstrate the electrochemical processes related to manganese deposition and the reduction of the electrolytic medium (including selenium and sulphate derived species), cyclic voltammetries were performed in a bias potentials range of 0.50 to −1.5 V vs. SCE. The potential scan was initiated in a negative direction at 25 mV s−1 using one catholyte without Mn ions (CF), one with Mn ions (CMn), and one without selenium (CFSe). All experiments took place in an electrochemical membrane reactor with a Ti cathode and a Ti|RuO2 anode. Fig. 3 shows the voltammograms produced by using the AMX (curve a) and AMI (curve b) membranes with CF (Fig. 3A), CMn (Fig. 3B) solutions, and CFSe (Fig. 3C), respectively.As shown in the voltammograms in Fig. 3A (curves a and b), there are three reduction processes (RI, RII, and RIII) before the hydrogen evolution (H2). Therefore, the massive hydrogen evolution (H2) is clearly associated with the characteristic increase in cathodic current density. Curves a and b in Fig. 3B reveal an additional reduction process (RMn) that develops before hydrogen evolution (H2). While in Fig. 3C (Curves a and b) only a reduction process (RMn) was observed before the hydrogen evolution (H2).
The three initial processes (RI, RII, and RIII) start at the same overpotentials (approximately −0.1, −0.300, and −0.900 V vs. SCE, respectively) with CF and CMn, while with solution CFSe these processes were not observed. Due to this, the initial reduction processes (RI, RII and RIII) were attributable to the reduction of selenium and sulphur species. Moreover, this fact also shows that the selenium reduction process facilitates the electrochemical reduction of sulphates to sulphur. The reduction process (RMn) observed at −1.141 V vs. SCE in Fig. 3B and C can be attributed to the manganese deposition on the cathode surface. The hydrogen evolution (H2) with CMn and CFSe solutions (Fig. 3B and C) was consequently developed at a higher reduction overpotentials (−1.228 and −1.312 V vs. SCE) in comparison to the CF solution as catholyte (−0.956 V vs. SCE), attributable to the reduction of Mn2+ ions (RMn) on the cathode.
When comparing the current density data obtained using the CF, CMn solutions, process RII achieves a lower current density with the CMn solution (2.17 A m−2 with CF vs. 1.50 A m−2 with CMn), which was attributable to a modifying effect of Mn2+ ions on the cathodic interface. However, it was also observed that for RI, RII and RIII processes the current density using the AMX (curve a) and AMI (curve b) membranes in CF is like, but that in CMn is different. This fact was attributed to the effect of the variation of Mn2+ and SO42− ions, as well as to a difference in the ion exchange capacity between both membranes and their thickness, which generate a small decrease in current when modifying the resistance of the solution. Furthermore, the hydrogen evolution (H2) and Mn2+ ions reduction (RMn) developed consecutively, resulting in a higher current density at the end of the cathodic sweep (−88 A m−2) in comparison with the CF solution (−60 A m−2), where only the hydrogen evolution occurs. In the case of CFSe solution, similar current density that CMn solution was achieved (−88 A m−2).
On the other hand, during the anodic scan a single oxidation process (OIII) can be observed at 0.15 V vs. SCE with CF solution (see inset of Fig. 3A, curves a and b). Meanwhile, with CMn solution (Fig. 3B, curves a and b), two consecutive oxidation processes are evident (OI and OII) beginning at −1.25 and −0.80 V vs. SCE, respectively. These were not observed with CF solution. In this way, these processes can be attributed to the oxidation of reduced Mn species in cathodic scanning. Likewise, whit CFSe solution the oxidation process, OII, achieves a lower current density (0.5 A m−2) in comparison with CMn solution (17 A m−2), see inset of Fig. 3A, curves a and b. Thus, this indicating that the presence of selenium in the catholyte promotes the manganese reduction and delays the hydrogen evolution.
A third, scarcely visible oxidation processes (OIII) is also evident at 0.15 V vs. SCE (see inset of Fig. 3B and C, curves a and b), which coincides with the OIII process from the CF and CFSe solutions. The presence of this process whit the three catholytes (CF, CFSe, and CMn) is attributable to the oxidation of Mn2+ or selenite (Se2−) ions to Mn3+ or selenide (SeO32−) ions, as appropriate to the composition of the catholyte.
It is important to mention that the anion exchange membranes used (AMX and AMI) do not affect greatly the electrochemical potentials of the reduction and oxidation processes developed in the CF, CMn or CFSe solution, since they begin at a similar overpotential.
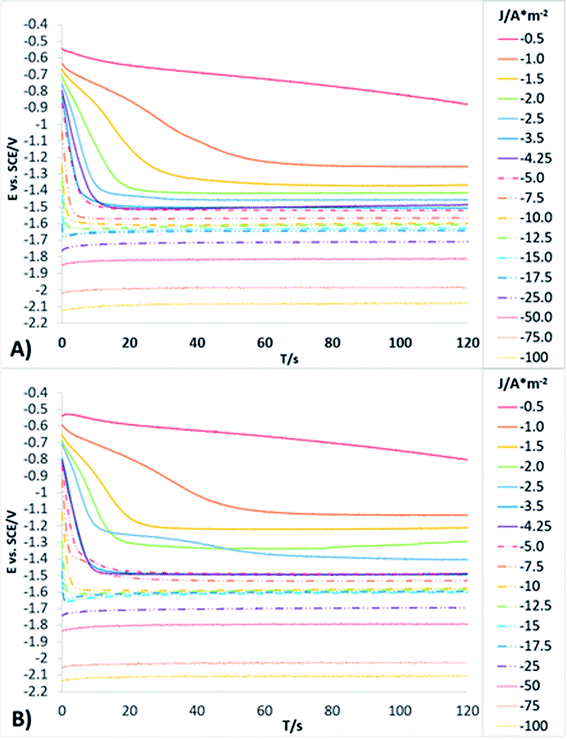
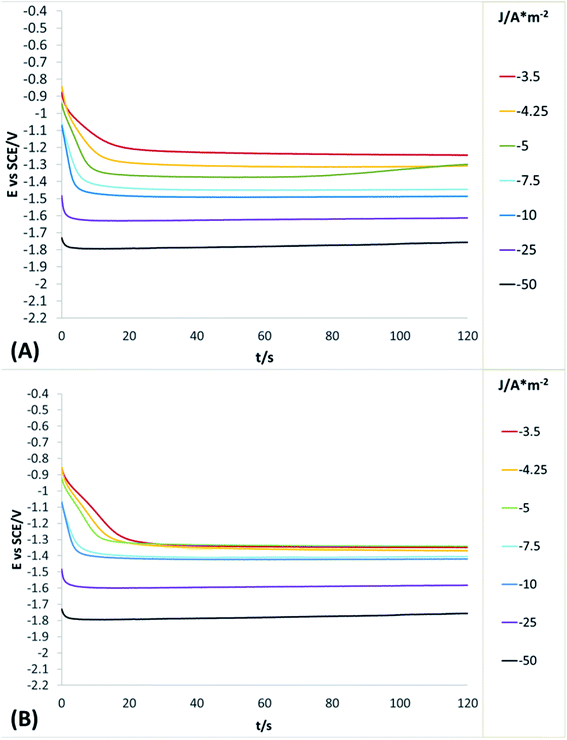
In order to obtain more detailed information about the behaviour of the reduction processes developed in manganese sulphate solutions (CMn), chronopotentiometric studies were performed in the range of −0.5 to −100 A m−2 with the two anionic membranes (Neosepta AMX and AMI 7001s) and the CMn solution. Fig. 4 shows the galvanostatic transients obtained by using the Neosepta AMX (Fig. 4A) and AMI 7001s (Fig. 4B) membranes in the CMn solution inside an electrochemical membrane reactor with a Ti cathode and a Ti|RuO2 DSA. It can be observed that by gradually increasing the cathodic current, the reduction potential also increases. Moreover, the galvanostatic transients obtained at −0.5 A m−2 have a constant slope; this indicates a single reduction process that does not generate visible changes in the solution or the surface of the electrodes.
By increasing the current density from −1 to −3.5 A m−2, galvanostatic transients have two steps: the first is a slope related to the same reduction process developed when imposing −0.5 A m−2; and the second is a plateau attributable to a cathodic reaction, which involves the formation of orange colloids around the electrode. Experimentally, more orange colloids are generated when the cathodic current density is increased. Minimal changes were observed in the potentials response from −3.5 to −5 A m−2, while the number of plateaus and their slope remain virtually identical. It is therefore evident that the colloids generated remain constant as the current densities become more cathodic.
From −5 to −12.5 A m−2, the first step has a steeper slope while the plateau of the second step reaches higher reduction potentials as the cathodic current density increases. Experimentally, the formation of colloids visually increases at higher cathodic current densities. Thus, the significant changes in the potential response are attributable to modifications on the surface of the electrode. From −12.5 to −17.5 A m−2, minimum changes in the potential response can be observed.
Nonetheless, between −25 and −50 A m−2 (Fig. 4A and B) the formation of a perceptible metallic deposit on the cathode surface can be observed; this is related to the manganese reduction and is accompanied by the absence of colloids. From −75 A m−2 there is a greater increase in the potential response, attributable to the beginning of a massive hydrogen evolution. At the same time, the amount of metallic deposit increases and no colloids are present.
Whit the porpoise of a better understand of the concomitant reduction processes developed in the solution, chronopotentiometric studies were performed in the range of −3.5 to −50 A m−2 with the two anionic membranes (Neosepta AMX and AMI 7001s) and the CF solution. Fig. 5 shows the galvanostatic transients obtained by using the Neosepta AMX (Fig. 5A) and AMI 7001s (Fig. 5B) membranes in the CF solution inside of electrochemical system used.
It can be observed (in Fig. 5A and B) that between −3.5 to −5 and −5 to −10 A m−2 the behaviour of the galvanostatic transients is like the observed at the same intervals in Fig. 4A and B; thus, indicating than the reductions processes developed (reduction of selenium or sulphur species) are not affected by the presence of Mn2+ ions on the solution. Between −25 and −50 A m−2, the massive hydrogen evolution is observed along with an increase of the colloids generated. At the same time, the galvanostatic transients obtained reveal a change in slope in the first seconds of the experiment, indicating the rapid consumption of a species and later the beginning of a continuous reaction (the evolution of hydrogen); this contrasts with the galvanostatic transients obtained when using the CMn solution (Fig. 4A and B), where only a slope is observed between the same current densities (related to the manganese reduction).
The solid products obtained during the chronopotentiometry studies on the CMn solution were characterised by SEM, XRD spectroscopy and ICP, allowing us to understand the electrochemical reduction reactions developed on the catholyte.
3.3 Characterisation of colloids and metallic deposits
Fig. 6 show the images obtained by SEM of the metallic deposit generated on electrode when imposing −50 A m−2 with the CMn solution and AMX and AMI membranes. The SEM images show a compact, flat and brittle deposit adhered on the electrode. The presence of some cracks was also observed, likely due to the evolution of hydrogen generated on the electrode surface.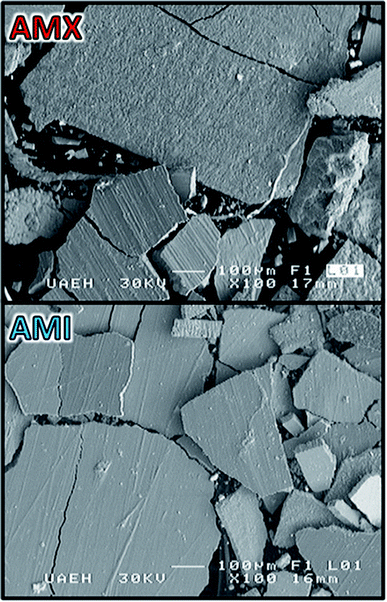 | ||
| Fig. 6 SEM images of the metallic deposition on Ti electrode surface at 100× and 30 kV, employing the AMX and AMI membranes. | ||
Fig. 7A and B shows the deconvolution of the XRD patterns obtained on the orange colloids produced at −15 A m−2 with AMI and AMX membranes, while Fig. 7C and D show the XRD patterns obtained on the metallic deposits generated at −50 A m−2 with AMI and AMX membranes. In the former, the presence of cyclooctaselenium (JCPDS card number 4319949) and β-sulphur (JCPDS card number 9009891) is evident. The results obtained by ICP indicate that the weight percentage composition of colloids is 98% selenium and 2% sulphur; thus, there is a clear reduction of these two elements from the catholyte. As demonstrated in Fig. 2, the absence of manganese species within the composition of colloids is attributable to the behaviour of the manganese ions at pH 4.
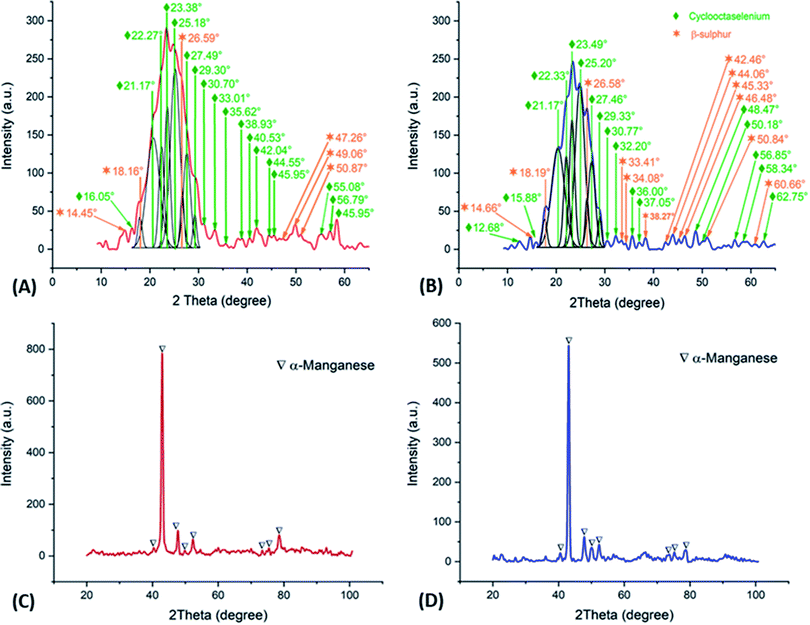 | ||
| Fig. 7 XRD patterns obtained on the orange colloids (deconvoluted) and metallic deposits, employing AMX (A, C) and AMI (B, D) membranes. | ||
In contrast, XRD patterns of Fig. 7C and D show the presence of α-manganese (JCPDS card number 9011108) on the metallic deposit, while the ICP analysis indicates a composition of 99.65% manganese, 0.175% sulphur, and 0.175% selenium. The combination and phase of the metallic deposit are associated with the selenium reduction process, as well as its promotive effect on the formation of the α-manganese.25
3.4 Reaction mechanism
The presence of selenium on the colloids is attributable to the reduction of hydrogen selenite ions (HSeO3−) to elemental selenium and a posterior partial dissolution to selenide ions (Se2−).20,24,25 Previous research has proposed that the selenium reduction from HSeO3− requires water (H2O) due to the high local pH at the cathode surface achieved by the hydrogen evolution.20,24,25 However, hydrogen evolution was not observed during the chronopotentiometric studies with AMI or AMX when current densities between −1 and −17.5 A m−2 were imposed. Thus, the proposed mechanism for hydrogen selenite reduction can be described by the following reactions:| HSeO3− + 2H+ + 4e− → Se + 3OH−, E0 = −0.084 V vs. SCE | (1) |
| Se + 2e− → Se2−, E0 = −0.841 V vs. SCE | (2) |
Consequently, reduction processes RI and RIII (as presented in Fig. 3) are related to reactions (1) and (2), respectively due to the proximity of the experimental overpotentials of the electrochemical processes with the standard potentials of the proposed reactions. Indeed, reaction (2) is also associated with the behaviour observed between −3.5 and −5 A m−2 due to the impact of the dissolution of the elemental selenium on the electrode surface.
The reduction process RII (Fig. 3A and B) is related to the electrochemical reduction of sulphate to sulphur since this process requires a reaction mechanism in which the first reaction step is the electrochemical reduction of SO42− to SO32−.26 Bancroft and Magoffin27 established the impossibility of the sulphate ions reduction from aqueous solutions because the energy level of the process is higher than the energy level of the hydrogen evolution. However, the elemental selenium inhibits the hydrogen evolution even after the reaction (2) because the remaining selenium does not react. The reduction of SO42− to S is therefore possible in CF and CMn solutions according to reactions (3) and (4). At the same time, both reactions are related to the reduction process RII due to the similarities between the experimental overpotentials and the standard potentials:
| SO42− + H+ + 2e− → SO32− + OH−, E0 = −0.348 V vs. SCE | (3) |
| SO32− + 3H+ + 4e− → S + 3OH−, E0 = −0.324 V vs. SCE | (4) |
The composition of metallic deposits confirms that the RMn process detailed within Fig. 3B is related to the manganese deposition, according to reaction (5).
| Mn2+ + 2e− → Mn, E0 = −1.424 V vs. SCE | (5) |
The massive hydrogen evolution observed above −75 A m−2 is associated with the increased manganese deposition rate.20 Based on the overpotentials of the reduction processes and the standard potentials E0 of the related electrochemical reactions, the following sequence for the reaction mechanism is proposed:
| HSeO3− + 2H+ + 4e− → Se + 3OH−, E = −0.08 V vs. SCE | (6) |
| SO42− + 4H+ + 6e− → S + 4OH−, E = −0.3 V vs. SCE | (7) |
| SO42− + H+ + 2e− → SO32− + OH− | (8) |
| SO32− + 3H+ + 4e− → S + 3OH− | (9) |
| Se + 2e− → Se2−, E = − 0.9 V vs. SCE | (10) |
| Mn2+ + 2e− → Mn, E = −1.14 V vs. SCE | (11) |
4 Conclusions
This study has demonstrated that the selenium reduction process facilitates the electrochemical reduction of sulphates to β-sulphur. Firstly, in the reaction mechanism, the selenium is reduced from hydrogen selenides (HSeO3−) at −0.08 V vs. SCE; subsequently, the effect of the elemental selenium on the hydrogen evolution enables the sulphate ions (SO42−) electrochemical reduction to sulphites (SO32−) and then to elemental sulphur at 0.3 V vs. SCE; and finally, the elemental selenium is reduced to selenide ions (Se2−) at 0.9 V vs. SCE. The same process can be observed when current densities lower than 17.5 A m−2 are applied. A further important finding is that the reduction of Mn2+ ions begins at −1.14 V vs. SCE. The reduction of Mn2+ to its metallic form from sulphated solutions, with a minimum interference of reactions or parasitic species, is carried out when currents densities of between −25 and −50 A m−2 are applied. Higher cathodic current densities than −50 A m−2 cause the incidence of hydrogen evolution as a coupled reaction in the manganese deposition. A final point worth noting is that the anion exchange membranes Neosepta AMX and AMI 7001s have no significant effect on the electrochemical behaviour of the reduction mechanism proposed.Author contributions
The Dr Victor Esteban Reyes Cruz contributed whit the project administration and methodology of the research. The Master Quink Luis Reyes Morales contributed whit the realization of the research. The Dr José Angel Cobos Murcia contributed whit the conceptualization of the research. The Dra Ariadna Trujillo Estrada contributed whit the validation of the research. The Dr Gustavo Urbano Reyes contributed whit the writing – review & editing of the research. The Dr Miguel Pérez Labra contributed whit the formal analysis of the research.Conflicts of interest
The authors declare no conflict of interest.Acknowledgements
The authors are grateful to CONACYT (México) and UAEH for the scholarship and the Cátedras program financing received.References
- S. K. Padhy, B. C. Tripathy and A. Alfantazi, Can. Metall. Q., 2016, 55(4), 429–437 CrossRef CAS.
- R. P. Ferrando, S. S. Caballero, J. E. C. Amorós and M. Á. S. Cantó, 3C Tecnología, 2012, 1(1), 1 Search PubMed.
- J. Huang, Z. Wang, M. Hou, X. Dong, Y. Liu, Y. Wang and Y. Xia, Nat. Commun., 2018, 9(1), 1 CrossRef PubMed.
- R. D. Peacoc and R. D. Kemmett, The Chemistry of Manganese, Technetium and Rhenium, New York, USA, 1st edn, 1975 Search PubMed.
- G. Agladze, N. Gogishvili, N. Koiava and I. Zaridze, Bull. Georgian Natl. Acad. Sci., 2008, 2(4), 89–90 CAS.
- J. C. Rojas-Montes, R. Pérez-Garibay and A. Uribe-Salas, J. Electroanal. Chem., 2014, 161, D67–D72 CAS.
- A. A. Baba, L. Ibrahim, F. A. Adekola, R. B. Bale, M. K. Ghosh, A. R. Sheik and I. O. Folorunsho, J. Miner. Mater. Charact. Eng., 2014, 2(3), 230 CAS.
- A. Sulcius, E. Griskonis, K. Kantminiene and N. Zmuidzinaviciene, Hydrometallurgy, 2013, 137, 33–37 CrossRef CAS.
- J. Lu, D. Dreisinger and T. Glück, Hydrometallurgy, 2016, 161, 45–53 CrossRef CAS.
- H. H. Oaks and W. E Bradt, ECS Trans., 1936, 69(1), 567–584 Search PubMed.
- D. Schlain and J. D. Prater, J. Electrochem. Soc., 1948, 94(2), 58–73 CrossRef CAS.
- P. Ilea, I. C. Popescu, M. Urdà and L. Oniciu, Hydrometallurgy, 1997, 46(1–2), 149–156 CrossRef CAS.
- P. Díaz-Arista, R. Antaño-López, Y. Meas, R. Ortega, E. Chaînet, P. Ozil and G. Trejo, Electrochim. Acta, 2006, 51(21), 4393–4404 CrossRef.
- J. K. Chang, C. H. Huang, W. T. Tsai, M. J. Deng, I. W. Sun and P. Y. Chen, Electrochim. Acta, 2008, 53(13), 4447–4453 CrossRef CAS.
- Q. Wei, X. Ren, J. Du, S. Wei and S. Hu, Miner. Eng., 2010, 23(7), 578–586 CrossRef CAS.
- L. Ding, X. Fan, J. Du, Z. Liu and C. Tao, Int. J. Miner. Process., 2013, 130, 34–41 CrossRef.
- J. Lu, D. Dreisinger and T. Glück, Hydrometallurgy, 2015, 161, 45–53 CrossRef.
- J. R. Xue, H. Zhong, S. Wang, C. X. Li and F. F. Wu, Trans. Nonferrous Met. Soc. China, 2016, 26(4), 1126–1137 CrossRef CAS.
- J. Xue, S. Wang, H. Zhong, C. Li and F. Wu, Hydrometallurgy, 2015, 160, 115–122 CrossRef.
- J. C. Rojas-Montes, R. Pérez-Garibay, A. Uribe-Salas and S. Bello-Teodoro, J. Electroanal. Chem., 2017, 803, 65–71 CrossRef CAS.
- W. Zhang and C. Y. Cheng, Hydrometallurgy, 2007, 89(3–4), 137–159 CrossRef CAS.
- K. S. Kim, W. Ryoo, M. S. Chun and G. Y. Chung, Desalination, 2013, 318, 79–87 CrossRef CAS.
- H. Jaroszek, W. Mikołajczak, M. Nowak and B. Pisarska, Desalin. Water Treat., 2017, 64, 223–227 CrossRef CAS.
- X. Fan, S. Xi, D. Sun, Z. Liu, J. Du and C. Tao, Hydrometallurgy, 2012, 127, 24–29 CrossRef.
- Y. Sun, X. Tian, B. He, C. Yang, Z. Pi, Y. Wang and S. Zhang, Electrochim. Acta, 2011, 56(24), 8305–8310 CrossRef CAS.
- B. A. Bilal and H. Tributsch, J. Appl. Electrochem., 1998, 28(10), 1073–1081 CrossRef CAS.
- W. D. Bancroft and J. E. Magoffin, J. Am. Chem. Soc., 1935, 57(12), 2561–2565 CrossRef CAS.
| This journal is © The Royal Society of Chemistry 2021 |

