 Open Access Article
Chemical synthesis of Nd2Fe14B/Fe–Co nanocomposite with high magnetic energy product†
Hieu Minh Ngo a,
Gyutae Leeb,
Syed Kamran Haidera,
Umapada Pal‡
 a,
Thomi Hawaria,
Kyung Min Kimc,
Jongryoul Kimb,
Hae-Woong Kwonc and
Young Soo Kang
 *a
*a
aDepartment of Chemistry, Sogang University, #1 Shinsu-dong, Mapo-gu, Seoul 121-742, Republic of Korea. E-mail: yskang@sogang.ac.kr
bDepartment of Materials Science & Chemical Engineering, Hanyang University, #320, 55, Hanyangdaehak-ro, Sangnok-gu, Ansan, Kyeonggi-do 426-791, Republic of Korea
cDepartment of Materials Science and Engineering, Pukyong National University, Busan, 48513, Republic of Korea
First published on 1st October 2021
Abstract
Nd2Fe14B is one of the most popular permanent magnets (PMs) possessing the best energy product (BH)max among the common PM materials. However, exchange-coupled nanocomposite magnets fabricated by embedding nanostructures of soft-phase magnetic materials into a hard-phase magnetic matrix manifest higher remanence and a higher energy product. Here we present the fabrication of exchange coupled Nd2Fe14B/Fe–Co magnetic nanocomposites using gel-combustion and diffusion–reduction processes. Pre-fabricated CoFe2O4 nanoparticles (NPs) of ∼5 nm diameter were incorporated into a Nd–Fe–B oxide matrix during its synthesis by gel-combustion. The obtained mixed oxide was further processed with oxidative annealing at 800 °C for 2 h and reductive annealing at 900 °C for 2 h to form a Nd2Fe14B/Fe–Co nanocomposite. Nanocomposites with different mol% of soft-phase were prepared and characterized by X-ray diffraction (XRD), transmission electron microscopy (TEM) and physical property measurement system (PPMS) to study their crystalline phase, morphology and magnetic behavior. Addition of 7.7 mol% of soft-phase was found to be optimum, producing a coercivity (Hc) of 5.6 kOe and remanence (Mr) of 54 emu g−1 in the nanocomposite.
Introduction
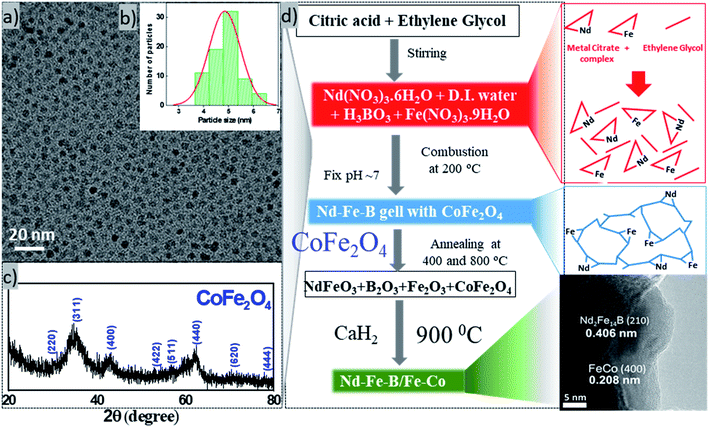
Rare-earth based permanent magnets are an indispensable part of modern life with applications spanning from actuators to motors, sensors to computer hard disk drives, to mention a few. However, the limited abundance of rare-earth elements in the earth is a hindrance to coping with the growing demand for these materials.1,2 To meet the world demand, researchers are looking for alternative methods such as recycling3 or other materials that are cheaper and capable of storing high energy to replace conventional rare-earth-based permanent magnets.4 One of the attempts is fabricating the permanent magnets with another soft magnetic material, using the exchange coupling interaction5,6 between the respective hard and soft magnetic domains. Exchange coupled magnets, which are basically the composites of hard rare-earth-based magnetic particles and rare-earth free soft magnetic particles, have been predicted to have larger energy product (BH)max as the consequence of high magnetization of the soft-magnetic particles and high coercivity of the hard-magnetic particles.6–10 For example, nanocomposite of Sm2Fe17N3 and Fe65Co35 containing only 9 vol% hard phase (Sm2Fe17N3) has been theoretically predicted to have highest (BH)max value of 137 MGOe.5 Many attempts have been made to synthesize these new type of magnetic materials using different methods during the last 12 years.11–20 Utilizing magnetron sputtering, Cui et al. fabricated Nd2Fe14B/Ta/Fe67Co33 anisotropic nanocomposite films which manifested (BH)max value as high as 60 MGOe.11 Using a chemical method, Hou et al. synthesized SmCo5/α-Fe nanocomposite with a coercivity of 6.05 kOe and magnetic remanence of 56 emu g−1.12 On the other hand, Shen et al. prepared exchange-coupled SmCo5/α-Fe magnetic nanocomposite with 13.2 kOe coercivity (Hc) and 61.5 emu g−1 remanence (Mr).13 Utilizing a reduction–diffusion process, Yu et al. fabricated exchange-coupled Nd2Fe14B/α-Fe nanocomposite by dispersing α-Fe nanoparticles (NPs) into Nd–Fe–B matrix. The magnetic nanocomposite revealed a coercivity of 12 kOe and remanence of 45 emu g−1.14 However, the same nanocomposite prepared by Zhong et al. through microwave-assisted combustion process produced Hc = 9 kOe and Mr = 110 emu g−1.16 The results presented above indicate the performance of exchange coupled magnetic nanocomposites strongly depends on their fabrication method, which controls their morphology, grain size, extent of inter-diffusion of hard- and soft-phase grains (fusion of grain boundary), and the volume fraction of the soft magnetic phase.Herein, we present the fabrication of Nd2Fe14B/Fe–Co nanocomposites through a reduction–diffusion process. The magnetic nanocomposites were prepared by dispersing different mol% of CoFe2O4 (Fe–Co oxide) nanoparticles (NPs) of ∼5 nm average size in Nd–Fe–B oxide matrix and subsequent thermal annealing in reducing atmosphere. The ratio of soft and hard phase in the composite was varied to obtain optimum coercivity (Hc) and magnetic remanence (Mr). Finally, the oxide composites were reduced by CaH2 at 900 °C to form Nd–Fe–B/Fe–Co nanocomposites. The synthesis process utilized to fabricate the exchange-coupled nanocomposites is schematically depicted in Fig. 1.
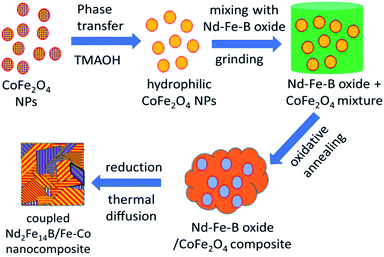 | ||
| Fig. 1 Schematic presentation of the sequential steps of fabricating Nd2Fe14B/Co–Fe exchange-coupled nanocomposite. | ||
Results and discussion
Exchange coupling across the grain boundaries between hard and soft phases leads to an enhanced remanence compared to the decoupled single-domain grains due to spin rotation in the grain boundary region. The effect was seen to increase with the decrease of grain size.2 According to the spin-exchange coupling theory,5 the size of the soft phase magnetic particles should be smaller than twice of the domain wall thickness of the hard phase particles to maximize the exchange coupling effect. As the domain wall thickness of hard phase Nd–Fe–B is about 3.5 nm,21 the ideal size of the soft phase particles should be less than 7 nm. In this work, we fabricated Fe–Co NPs of ∼5 nm average diameter to incorporate them into Nd–Fe–B matrix of hard phase. The complete flow chart of the process adopted for fabricating magnetic spin exchange-coupled magnetic nanocomposites has been presented in Fig. 2.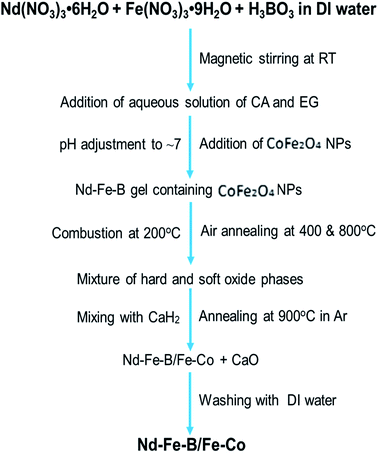 | ||
| Fig. 2 Flow chart of the processing steps used for the synthesis of exchange coupled Nd–Fe–B/Fe–Co nanocomposites. | ||
Typical TEM image, particle size distribution, and XRD pattern of the fabricated cobalt ferrite nanoparticles are presented in Fig. 3. As can be seen, the as-synthesized cobalt–ferrite nanoparticles are well dispersed, with an average size ∼4.85 nm ± 0.7 nm (Fig. 3a, b and S2†). XRD pattern of the nanostructures (Fig. 3c) corresponds well with crystalline CoFe2O4 [PDF# 22-1086] in cubic phase with space group Fd3m. However, due to small size of the particles, the diffraction bands are broad and of low intensity. Instead of Fe–Co bimetallic nanoparticles, we fabricated cobalt ferrite nanoparticles of desired size intentionally to mix them with the hard phase Nd–Fe–B, as the oxide of bimetallic Fe–Co alloy is more stable in air than the alloy itself.22 As the cobalt ferrite NPs were synthesized in organic solvent using organic surfactants, they had a hydrophobic surface. For their good dispersion in the aqueous hard phase precursor solution, they were treated with TMAOH, which is a common phase-transfer agent.23 After treating with TMAOH, the cobalt ferrite particles dispersed well in water (Fig. S2d†). Now the surface-modified cobalt ferrite particles are ready to mix with Nd–Fe–B gel in the water phase. Later, the cobalt ferrite was converted to Fe–Co alloy in the reduction–diffusion step (Fig. 3d).
Nd–Fe–B oxide particles were synthesized by gel-combustion method.24,25 This method was chosen because it is a simple, cheap, and high yield technique. In this method, nitrate salts were used as precursors. The addition of citric acid and ethylene glycol created a metal salts network, making the distribution of the elements homogeneous. Ammonia solution was added to adjust the pH of the reaction solution to 7. The added ammonia solution combined with NO3− anions in the solution forms NH4NO3, which acts as a fuel for the combustion of the precursor gel at 200 °C, producing the metal oxide.26–28
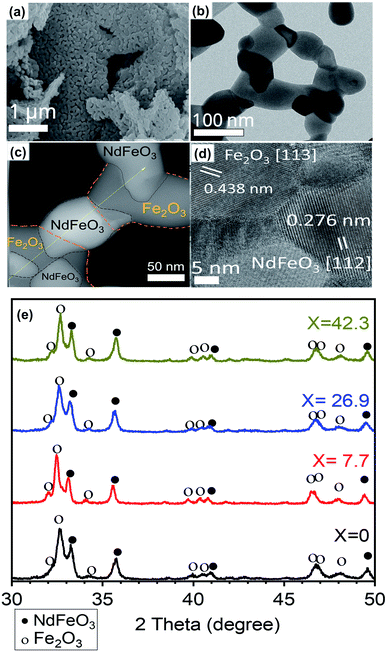
Fig. 4 shows the SEM, TEM and XRD patterns of (100 − x)% Nd–Fe–B oxide/x% Fe–Co oxide samples with increasing x values (x = 0.0–26.9 mol%) after annealing at 800 °C. The appearance of well-defined intense diffraction peaks in the diffraction patterns indicates the formation of well-crystalline grains in the samples after air-annealing at 800 °C (Fig. 4a–d). As can be noticed, XRD patterns of the nanocomposites revealed diffraction peaks of both NdFeO3 (PDF# 01-082-2421) and Fe2O3 (PDF# 01-084-0308). As the mol percentage of the soft phase in oxide composite increased, the relative intensity of the peaks corresponds to Fe2O3 increased gradually (Fig. 4e and S1, ESI†). The formation of NdFeO3 and Fe2O3 is necessary for the reduction process. While the free energy change in the reduction of Nd2O3 to Nd at 900 K is theoretically calculated to be around 94.465 kJ mol−1, reported change in free energy for the reduction of NdFeO3 to Nd + Fe by CaH2 at same temperature is around −349.3 kJ mol−1, which indicates the NdFeO3 phase is easier to be reduced in the used co-reduction process than Nd2O3 (Table S2†).26,27 As can be seen in Fig. 4b–d, the Nd–Fe–B oxide consists of single crystal domains of NdFeO3 and Fe2O3 of different sizes, connected each other to form a net matrix.29 Porous structure can be seen clearly in the SEM and TEM images (Fig. S3†). Absence of diffraction peak associated to boron in the XRD pattern of the oxide composites might be due to its amorphous form or low content, below the detectable limit of the diffractometer.
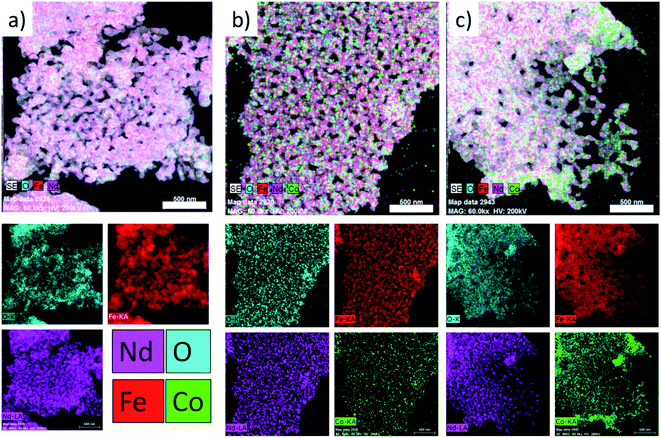
As can be seen in Fig. 5, the elements are distributed homogeneously in Nd–Fe–B oxide (containing no cobalt ferrite) (Fig. 5a). On the other hand, the non-uniform color contrast in the reconstructed images of the mixed oxide composite samples (Fig. 5(b and c)) clearly indicates their non-homogeneous element distribution. Inhomogeneous element distribution is even clearer in the Co mapping image (Fig. 5c) of the samples with higher soft-phase (Fe–Co oxide) contents. In fact, the distributions of Co and Nd are noticeably uneven, apparently segregated into specific regions of the composite containing high Fe–Co oxide content (Fig. 5c). It suggests a higher soft-phase oxide content could suppress the inter-diffusion process between two (soft and hard) magnetic phases. Such a non-homogeneous Co distribution in the hard–soft oxide composite, especially of high cobalt ferrite contents, is expected as the melting point of cobalt ferrite (>1500 °C)30 is considerably higher than the melting point of Nd–Fe–B oxide (>1000 °C)30 which suppresses the inter-diffusion of crystalline grains of the two magnetic phases.
After air-annealing, the composite oxide powders were mixed with CaH2 and compressed into a pellet for reduction–diffusion treatment. Calcium hydride was chosen as the reducing agent because of its stronger reducing character compared to NaBH4 and H2. As has been reported in the literature, the use of NaBH4 (ref. 29 and 31) or hydrogen32 as a reducing agent in the reduction–diffusion process does not yield Nd2Fe14B in high proportion as a reduction product. In fact, due to the high negative reduction potential (−2.323 eV) of Nd, it needs a strong reducing agent such as CaH2 for a complete reduction of Nd–Fe–B oxide. More detail of thermodynamical calculation for the reduction–diffusion reaction was presented in Tables S2 and S3.†26,27,33,34 On the other hand, the amount of CaH2 has a critical effect on the Nd–Fe–B oxide reduction process.26–28 While a lower CaH2 content in the reduction mixture causes an incomplete reduction of the hard-phase oxide (leaving Nd–Fe–B oxide as a by-product), use of CaH2 in excess although reduces the oxide completely, it leaves excess CaH2 as an impurity in the sample, resulting in the poor magnetic property of the final product.
During washing the product with water, while the oxidized CaH2 (i.e. CaO) gets dissolved to form Ca(OH)2, the excess CaH2 reacts with water, releasing hydrogen gas. The produced hydrogen gas molecules could be adsorbed on the surface of Nd2Fe14B and react to form its hydride (Nd2Fe14BH2x) (eqn (1) & (2)). As this hydride phase has low coercivity, it suppressed the magnetic properties of the fabricated Nd2Fe14B nanostructures adversely.26–28
| CaO + H2O = Ca(OH)2 + H2 | (1) |
| Nd2Fe14B + xH2 = Nd2Fe14BH2x | (2) |
Hence, we used a 1.05![[thin space (1/6-em)]](https://www.rsc.org/images/entities/char_2009.gif) :
:![[thin space (1/6-em)]](https://www.rsc.org/images/entities/char_2009.gif) 1 ratio of CaH2 and oxide composite sample, which was found most proper after the optimization process. The metal oxide was mixed and ground with CaH2, then shaped into a pellet under Ar atmosphere (inside a glove box). Compressed pellet samples have been seen to enhance the efficiency of the reduction process due to the intimate contact of the reducing agent (CaH2) with Nd–Fe–B oxide grains.27 After washing, the coercivity reduced a little while the remanence significantly increase, denote the effective of the reducing and washing process (Fig. S12†).
1 ratio of CaH2 and oxide composite sample, which was found most proper after the optimization process. The metal oxide was mixed and ground with CaH2, then shaped into a pellet under Ar atmosphere (inside a glove box). Compressed pellet samples have been seen to enhance the efficiency of the reduction process due to the intimate contact of the reducing agent (CaH2) with Nd–Fe–B oxide grains.27 After washing, the coercivity reduced a little while the remanence significantly increase, denote the effective of the reducing and washing process (Fig. S12†).
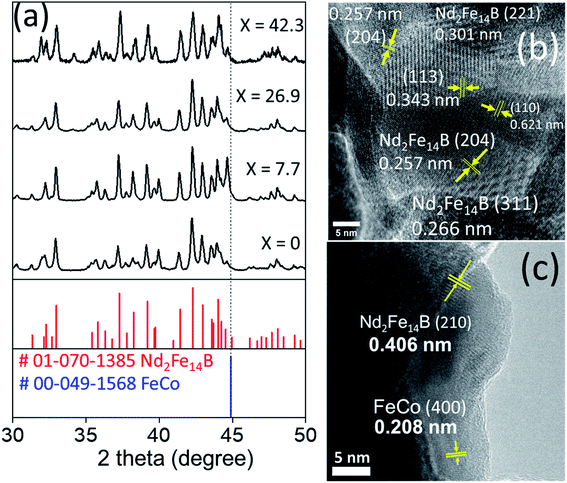
Fig. 6a shows the XRD patterns of magnetic nanocomposites prepared by reduction–diffusion treatment (at 900 °C, 2 h). The diffraction peaks revealed by the magnetic nanocomposites correspond well with the standard diffraction bands of crystalline Nd2Fe14B in the tetragonal phase (P42/mnm space group, PDF# 01-070-1385). There is no diffraction peak associated either with cobalt ferrite, Fe–Co alloy, or metallic Co in the diffraction patterns even for high concentrations (up to 26.9 mol%) of cobalt ferrite in the pelletized hard–soft oxide mixture (see Fig. S1†).
Fig. 6b showed an HRTEM image of NdFeB nanoparticles after reduction with CaH2. As can be seen clearly, the particles are well crystalline, with different crystal domains. The particle appears to be polycrystalline, with each domain represent one facet. For example, d = 0.266 nm corresponding to Nd2Fe14B (311), d = 0.257 nm corresponding to Nd2Fe14B (204) facet. The d-spacing value and facets match with the XRD reference of Nd2Fe14B (PDF#01-070-1385). A typical NdFeB grains morphology were shown in Fig. S6.†
The appearance of crystalline grains of individual components (soft and hard phases) in the HRTEM image (Fig. 6c) clearly demonstrates the presence of soft and hard phases in the composite.
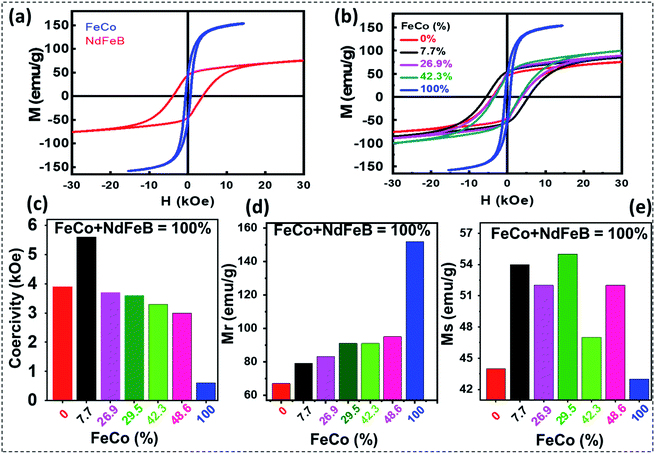
Room temperature magnetization curves of the final exchange-coupled hard–soft nanocomposites are presented in Fig. 7. As can be seen, the Fe–Co metal alloy nanostructures revealed soft magnetic behavior at room temperature, with a slightly opened magnetic loop. Room temperature coercivity (Hc), remanence magnetization (Mr), and saturation magnetization (Ms) revealed for the soft-magnetic nanostructures were 0.60 kOe, 43.0 emu g−1, and 152 emu g−1, respectively. On the other hand, the uncoupled Nd2Fe14B particles prepared by reducing the Nd–Fe–B oxide nanostructures revealed their ferromagnetic behavior at room temperature, with coercivity (Hc), remanence magnetization (Mr), and saturation magnetization (Ms) of about 3.9 kOe and 44.0 emu g−1 and 67.0 emu g−1, respectively. The various prepared nanocomposites via sol–gel synthesis displayed very smooth M–H curves. The smooth curve might come from the well coupling between the soft phase or hard phase, but there is high chance that the soft phase diffuses well into the hard phase structure. That is in consistent with XRD when only 1 phase of Nd2Fe14B were observed (Fig. 6a and S7†). The hard–soft exchange-coupled nanocomposite prepared by mixing 92.3 mol% of Nd–Fe–B and 7.7 mol% of Fe–Co revealed a coercivity of about 5.6 kOe, remanence magnetization about 54 emu g−1, and Ms of about 59.0 emu g−1. The coercivity of this sample is the highest among the fabricated nanocomposites. As can be noticed, the values of Mr and Hc of this nanocomposite are substantially higher than the values correspond to the uncoupled Nd2Fe14B particles prepared in the present study. This could suggest the existence of spin coupling at the grain interfaces of the two (soft and hard) magnetic components. Another likely reason is that when the soft nanoparticles diffuse into the hard phase structure, it increases the crystallinity to a certain degree (Fig. S7†). That might help to enhance the properties of the magnetic materials.
However, when Fe–Co mol% increases further, although the Ms value of the nanocomposite increased gradually as expected, variations in the values of Hc and Mr were not regular (Table 1). As can be noticed in Table 1, the nanocomposites prepared with 7.7 mol% of Fe–Co revealed the highest energy product among all the composites prepared in this work. Although the energy product estimated for the nanocomposite containing the optimum amount of Fe–Co is highest among all the samples, the value is lower than the literature reported energy product values of exchange-coupled nanocomposites such as Nd2(Fe,Co)14B fabricated using a similar synthetic protocol.15,16,19 Relatively lower energy product of the exchange-coupled hard–soft nanocomposites fabricated in this work might be due to the diffusion of Co atoms across the grains of the two (soft and hard) phases and low density of the nanocomposite. In Henkel plot (Fig. S11†), the δM(H) values of isotropic Nd–Fe–B/Fe–Co composite were observed to be negative, indicating that the dipole interaction between the hard and soft magnetic phases was dominant during the reversal procedure. In addition, two negative peaks were observed in the range of 15 kOe. It means that various magnetic interactions could be occurred between the hard magnetic phases, the hard and soft magnetic phases, the inter-grains, or even inter-particles in these composites.35–37
| (100 − x)%Nd–Fe–B/x%Fe–Co | 0.0 | 7.7 | 26.9 | 42.3 | 100 |
| Hc (kOe) | 3.9 | 5.6 | 3.7 | 3.3 | 0.6 |
| Mr (emu g−1) | 44.0 | 54.0 | 52.0 | 47.0 | 43.0 |
| Ms (emu g−1) | 67.0 | 79.0 | 83.0 | 91.0 | 152.0 |
| (BH)max (MGOe) | 2.35 | 4.27 | 3.87 | 2.10 | 0.61 |
Conclusions
In summary, an exchange-coupled nanocomposite magnet of Nd2Fe14B/Fe–Co with different soft phase contents could be prepared successfully utilizing sol–gel combustion and reduction–diffusion processes. While the utilization of the appropriate amount of reducing agent CaH2 in the reduction–diffusion process is critical for the complete elimination of CaO by-product and undesired hydrogenation of the hard phase, the fraction of the soft phase in the nanocomposite determines the extent of particle agglomeration and inter-grain fusion during high-temperature reduction–diffusion treatment. Incorporation of about 7.7 mol% of Fe–Co soft phase in the Nd2Fe14B hard phase is seen to be optimum for producing the highest exchange energy product (BH)max in the exchange-coupled nanocomposite. Diffusion of Co at the hard–soft interface during the high-temperature reduction–diffusion process seems to have a deteriorating effect on the performance of the exchange-coupled hard–soft nanocomposites.Author contribution
H. N. designed and conducted experiments, organize data and writing manuscript. G. L. performed and analysed Henkel plot and magnetic properties. K. H. plotted graphs and organized figures. U. P. revised, and edited manuscript writing and data. K. K. performed VSM measurement of Fe–Co. T. H. performed additional experiments. J. K., H. W., Y. K. validated the results. Y. S. Kang supervised the research project and made conclusions. All authors have read and agreed to the published version of the manuscript.Conflicts of interest
There are no conflicts to declare.Acknowledgements
This work is financially supported by the Leader Project at the Sogang University funded by the Ministry of Science and ICT through the National Research Foundation of Korea (No. 2020R1A3B3079715). U. P. expresses his sincere thanks to National Research Foundation of Korea, Republic of Korea for its support through Brain Pool Program (Grant #2019H1D3A2A01059781). We thank Sung-woo Lee at the Center for Research Facilities, Chungnam National University for PPMS measuring, Ji-Hye Kim at Research Facilities center, Sungkyunkwan University, Yoon-Hee Lee at KCAP, Sogang University for TEM measuring, Ji-Hye Yoo at Sogang LINC for SEM measuring.References
- N. Poudyal and J. P. Liu, J. Phys. D: Appl. Phys., 2013, 46, 043001 CrossRef.
- S. K. Haider, M.-C. Kang, J. Hong, Y. S. Kang, C.-W. Yang and D. Kim, Sci. Rep., 2021, 11, 6347 CrossRef CAS PubMed.
- S. K. Haider, J.-Y. Lee, D. Kim and Y. S. Kang, ACS Sustainable Chem. Eng., 2020, 8, 8156–8163 CrossRef CAS.
- S. K. Haider, H. M. Ngo, D. Kim and Y. S. Kang, Sci. Rep., 2021, 11, 10063 CrossRef CAS PubMed.
- R. Skomski and J. M. Coey, Phys. Rev. B: Condens. Matter Mater. Phys., 1993, 48, 15812–15816 CrossRef CAS PubMed.
- B. Balamurugan, D. J. Sellmyer, G. C. Hadjipanayis and R. Skomski, Scr. Mater., 2012, 67, 542–547 CrossRef CAS.
- E. F. Kneller and R. Hawig, IEEE Trans. Magn., 1991, 27, 3588–3600 CAS.
- J. M. D. Coey and R. Skomski, Phys. Scr., 1993, T49a, 315–321 CrossRef CAS.
- E. E. Fullerton, J. S. Jiang and S. D. Bader, J. Magn. Magn. Mater., 1999, 200, 392–404 CrossRef CAS.
- J. M. D. Coey, IEEE Trans. Magn., 2011, 47, 4671–4681 CAS.
- W. B. Cui, Y. K. Takahashi and K. Hono, Adv. Mater., 2012, 24, 6530–6535 CrossRef CAS PubMed.
- Y. Hou, S. Sun, C. Rong and J. P. Liu, Appl. Phys. Lett., 2007, 91, 153117 CrossRef.
- B. Shen, A. Mendoza-Garcia, S. E. Baker, S. K. McCall, C. Yu, L. Wu and S. Sun, Nano Lett., 2017, 17, 5695–5698 CrossRef CAS PubMed.
- L. Yu, C. Yang and Y. Hou, Nanoscale, 2014, 6, 10638–10642 RSC.
- Y. Zhong, V. Chaudhary, X. Tan, H. Parmar and R. V. Ramanujan, J. Alloys Compd., 2018, 747, 755–763 CrossRef CAS.
- Y. Zhong, V. Chaudhary, X. Tan, H. Parmar and R. V. Ramanujan, Nanoscale, 2017, 9, 18651–18660 RSC.
- W. B. Cui, S. J. Zheng, W. Liu, X. L. Ma, F. Yang, Q. Yao, X. G. Zhao and Z. D. Zhang, J. Appl. Phys., 2008, 104, 053903 CrossRef.
- C. B. Rong, D. Wang, V. V. Nguyen, M. Daniil, M. A. Willard, Y. Zhang, M. J. Kramer and J. P. Liu, J. Phys. D: Appl. Phys., 2013, 46, 045001 CrossRef.
- M. Yue, X. Zhang and J. P. Liu, Nanoscale, 2017, 9, 3674–3697 RSC.
- G. S. Chaubey, N. Poudyal, Y. Z. Liu, C. B. Rong and J. P. Liu, J. Alloys Compd., 2011, 509, 2132–2136 CrossRef CAS.
- D. Jiles, Introduction to Magnetism and Magnetic Materials, CRC Press, NewYork, 3rd Edition edn, 2015 Search PubMed.
- G. S. Chaubey, C. Barcena, N. Poudyal, C. Rong, J. Gao, S. Sun and J. P. Liu, J. Am. Chem. Soc., 2007, 129, 7214–7215 CrossRef CAS PubMed.
- S.-M. Verónica, L. M. Liz-Marzan and M. Farle, Langmuir, 2004, 20, 6946–6950 CrossRef PubMed.
- A. E. Danks, S. R. Hall and Z. Schnepp, Mater. Horiz., 2016, 3, 91–112 RSC.
- H. Parmar, T. Xiao, V. Chaudhary, Y. Zhong and R. V. Ramanujan, Nanoscale, 2017, 9, 13956–13966 RSC.
- P. K. Deheri, V. Swaminathan, S. D. Bhame, Z. W. Liu and R. V. Ramanujan, Chem. Mater., 2010, 22, 6509–6517 CrossRef CAS.
- H. X. Ma, C. W. Kim, D. S. Kim, J. H. Jeong, I. H. Kim and Y. S. Kang, Nanoscale, 2015, 7, 8016–8022 RSC.
- H. Rahimi, A. Ghasemi, R. Mozaffarinia and M. Tavoosi, J. Magn. Magn. Mater., 2017, 444, 111–118 CrossRef CAS.
- A. P. Jadhav, A. Hussain, J. H. Lee, Y. K. Baek, C. J. Choi and Y. S. Kang, New J. Chem., 2012, 36, 2405–2411 RSC.
- S. J. Schneider, NBS Monograph: Compilation of the Melting Points of the Metal Oxides, US National Bureau of Standards, Washington, D.C, 1963 Search PubMed.
- C. W. Km, Y. H. Km, H. G. Cha and Y. S. Kang, Phys. Scr., 2007, T129, 321–325 CrossRef CAS.
- C. W. Kim, Y. H. Kim, U. Pal and Y. S. Kang, J. Mater. Chem. C, 2013, 1, 275–281 RSC.
- J. H. Jeong, H. X. Ma, D. Kim, C. W. Kim, I. H. Kim, J. W. Ahn, D. S. Kim and Y. S. Kang, New J. Chem., 2016, 40, 10181–10186 RSC.
- X. Tan, H. Parmar, Y. Zhong, V. Chaudhary and R. V. Ramanujan, IEEE Magn. Lett., 2017, 8, 1–5 Search PubMed.
- K. W. Geng, F. Pan and R. H. Yao, J. Appl. Phys., 2008, 104, 073902 CrossRef.
- T. Maurer, F. Zighem, W. Fang, F. Ott, G. Chaboussant, Y. Soumare, K. A. Atmane, J.-Y. Piquemal and G. Viau, J. Appl. Phys., 2011, 110 Search PubMed.
- F. Wang, G. Tang, B. Bian, L. Yao, Y. Liu, Q. Zheng and J. Du, J. Rare Earths, 2020, 38, 84–89 CrossRef CAS.
Footnotes |
| † Electronic supplementary information (ESI) available: Containing details of materials and experimental methods, additional supporting data such as structural (XRD), microscopic (SEM, TEM) and composition analysis (EDS) of the nanocomposites. See DOI: 10.1039/d1ra03760a |
| ‡ On leave from Instituto of Physics, Autonomous University of Puebla, Mexico. |
| This journal is © The Royal Society of Chemistry 2021 |

