 Open Access Article
Improvement of low-temperature NH3-SCR catalytic performance over nitrogen-doped MOx–Cr2O3–La2O3/TiO2–N (M = Cu, Fe, Ce) catalysts†
Xiaoyi Sun ,
Qingjie Liu,
Shuai Liu,
Xintang Zhang
 * and
Shanshan Liu*
College of Chemical and Biological Engineering, Shandong University of Science and Technology, Qingdao 266590, PR China. E-mail: zhangxt966@126.com; skd996368@sdust.edu.cn
First published on 28th June 2021
Abstract
A series of MOx–Cr2O3–La2O3/TiO2–N (M = Cu, Fe, Ce) catalysts with nitrogen doping were prepared via the impregnation method. Comparing the low-temperature NH3-SCR activity of the catalysts, CeCrLa/Ti–N (xCeO2–yCr2O3–zLa2O3/TiO2–N) exhibited the best catalytic performance (NO conversion approaching 100% at 220–460 °C). The physico-chemical properties of the catalysts were characterized by XRD, BET, SEM, XPS, H2-TPR, NH3-TPD and in situ DRIFTS. From the XRD and SEM results, N doping affects the crystalline growth of anatase TiO2 and MOx (M = Cu, Fe, Ce, Cr, La) which were well dispersed over the support. Moreover, the doping of N promotes the increase of the Cr6+/Cr ratio and Ce3+/Ce ratio, and the surface chemical adsorption oxygen content, which suggested the improvement of the redox properties of the catalyst. And the surface acid content of the catalyst increased with the doping of N, which is related to CeCrLa/TiO2–N having the best catalytic activity at high temperature. Therefore, the CeCrLa/TiO2–N catalyst exhibited the best NH3-SCR performance and the redox performance of the catalysts is the main factor affecting their activity. Furthermore, in situ DRIFTS analysis indicates that Lewis-acid sites are the main adsorption sites for ammonia onto CeCrLa/TiO2–N and the catalyst mainly follows the L–H mechanism.
1. Introduction
Nitrogen oxides (NOx) derived from the burning of fossil fuels such as coal and oil are very harmful to human beings and the environment. As one of the main polluting gases, nitrogen oxides not only cause acid rain and photochemical pollution, but also are a major component of PM 2.5.1 Thus, it is imperative to control the emission of harmful NOx. In recent years, ammonia selective catalytic reduction (NH3-SCR) is widely used in the removal of NOx. In this process, NH3 is used as a reductant to reduce NOx in coal-fired flue gas to harmless N2 and H2O under the action of a catalyst which is the core of the NH3-SCR technology. Currently, catalysts with polymetallic oxides as active components are extensively studied.2–4 The synergistic effect between polymetallic oxides could promote NH3-SCR performance of the catalysts.It is well known that ceria is an environmentally-benign material which was widely used as catalysts for NH3-SCR due to the excellent redox ability of the Ce4+/Ce3+ reversible redox pair, rich surface oxygen vacancies and high oxygen storage capacity.5–7 It has been found that the addition of Ce can increase the high temperature activity of the catalyst.8,9 Some researchers have reported that Cr-modified Ce–Zr oxide exhibited high NO oxidation activity due to the intense interaction of ad-O2 and ad-NO accelerated by Cr, which can improve NH3-SCR performance.10–12 Furthermore, Lu et al.13 investigated Ce can promote the conversion between Cr3+ and Cr5+ and increase the proportion of lattice oxygen, which improves the activity of the catalyst. Chromium oxides (CrOx) have variability of oxidation states, especially for exposed chromium ions, and its most common valence states are Cr3+ and Cr5+.14 CrOx was found to be one of the most active metals for complete oxidation.15 Thus, the interaction between Ce and Cr can improve the redox property and accelerate the redox circle, which are beneficial to the improvement of NH3-SCR activity. Moreover, La is a rare earth element that is abundant in China and since lanthanide oxides possess excellent oxygen storage capacity and unique redox properties, lanthanide-doped catalysts have been widely investigated for SCR reaction.16,17 La3+ could partly incorporate into the ceria fluorite lattice to induce an expansion of the crystal cell dimensions, which concomitantly induces more lattice defects and improves the lattice oxygen mobility.18 Yi et al.19 studied the effects of rare earth elements (La, Ce) modification on oxidation performance and the results showed that La, Ce modification could promote the oxidation performance of adsorbents, increase the specific surface area, and reduce the pore diameter of the adsorbents. Zhang et al.20 prepared a series of MOx–V2O5–MoO3–CeO2/TiO2 (M = Mn, Cu, Sb, and La) catalysts to investigate their NH3-SCR performance, and found that La5V1Mo3Ce7/Ti exhibited the largest number of acid sites, might be suitable for use in high temperature denitrification applications. Therefore, the interaction between Ce and La can improve the redox performance and acidity of the catalyst, which is conducive to the improvement of NH3-SCR activity.
Copper has been regarded as a prospective active component on account of its low cost, high activity, and green property.21 As active component, CuO could increase the redox ability in virtue of the poly-valent properties.22 Donovan et al.23 found that titanium-supported Mn, Cr and Cu performed well at low temperature due to the increase of acid sites on the surface. Liu et al.24 prepared a series of La–Cu–Mn–O catalysts and found that La was conducive to the decrease in the size of Cu and Mn and preventing their agglomeration, enabling the enhancement in reducibility of the catalysts, which promotes the increase in exposed active sites. Furthermore, La3+ enhanced the redox couples of Mn4+ + Cu+ ↔ Mn3+ + Cu2+, leading to the formation of high-proportioned active ions (Cu2+ and Mn3+) and surface oxygen defects in abundance. Thus, the interaction between Cu and Cr or La is helpful to improve the surface acidity and redox performance of the catalyst, which favours the SCR activity of catalysts. In addition to cerium and copper, iron has been widely used in denitration catalysts because of its environmental friendliness and high activity at medium and high temperature. Ge et al.25 found that the addition of Cr greatly increased the BET surface area, the number of weak and medium–strong acid sites and the ratio of Fe3+/Fe2+ on the surface of Fe/AC catalyst, thus promoting the low temperature SCR activity of the catalyst. Hou et al.26 reported that the Brønsted acid sites of Fe–Mn/TiO2 was significantly improved after La modification. Therefore, the interaction between Fe and Cr or La helps to improve the redox capacity and the number of acid sites on the catalyst.
Furthermore, the supports are also important for the SCR reaction. A good support can disperse the active components well. Moreover, the interaction of supports and active components also has an important effect on the catalytic performance.27 Currently, anatase TiO2, Al2O3, molecular sieves, and carbon-based materials are usually used as denitrification catalyst supports. Among them, anatase TiO2 has the advantages of low price, good sulfuric resistance, and non-toxicity.28 And anatase TiO2 is favourable to the SCR reaction for the rich Lewis acid sites on the surface.29 However, anatase TiO2 often displayed decreasing NH3-SCR performance due to the crystalline transition of TiO2 with the temperature increase. In many modified supports,30–32 it was found that the doped N can inhibit the phase transition of TiO2 from anatase to rutile. Moreover, the surface acidity, oxygen vacancies, and active sites can also be improved.33 Devi et al. suggested that nitrogen has comparable atomic size with oxygen, small ionization energy, metastable centre formation and stability.34 Thus, when the N doped TiO2, the nitrogen can partially substitute oxygen over TiO2 crystalline. The substitution of nitrogen alters both the electronic properties and surface structure of TiO2, which the former property determines redox power of carriers, and the latter one control the surface transfer of charge carriers.35 The improvement of redox property is beneficial to the NH3-SCR performance improvement. In this paper, the N-doped TiO2 has been applied to denitrification and the modification indeed improved the NH3-SCR performance of the CeCrLa/Ti catalysts.
In this paper, MCrLa/TiO2–N (M = Cu, Fe, Ce), CeCrLa/Ti were prepared via an impregnation method. The NH3-SCR activity of different catalysts was investigated, and a series of characterization techniques (XRD, BET, SEM, XPS, H2-TPR and NH3-TPD) were used to explore the influence of the redox performance of TiO2 modified by N doping on the denitration performance, and compare with the effect of improving the redox performance by modifying the active component. The effect of the addition of N for the surface structure and surface acidity of catalyst were also described. Furthermore, the reasonable reaction mechanism on the CeCrLa/TiO2–N catalyst was proposed by the in situ DRIFTS.
2. Experimental
2.1 Synthesis and characterization of composite materials
Preparation of supports. N-doped TiO2 preparation, as follows: first, a certain amount of urea (CH4N2O, Keshi, China, AR) and metatitanic acid (TiO(OH)2, Xiya Reagent, China, 98%) was dissolved in ethanol (C2H5OH, Xilong Scientific, China, AR) by magnetic stirring, the slurry was placed at room temperature for 24 h. Second, the slurry was dried to complete at 100 °C and then calcined at 500 °C for 5 h in air. TiO2 preparation: TiO(OH)2 was calcined at 500 °C for 3 h in air.
Preparation of catalysts. The catalysts were prepared via an impregnation method. Take the preparation of CuCrLa/TiO2–N catalyst as an example. First, copper nitrate (Cu(NO3)2·3H2O, Kermel, China, AR), chromium nitrate (Cr(NO3)3·9H2O, Aladdin, China, AR) and lanthanum nitrate (La(NO3)3·6H2O, Macklin, China, AR) were dissolved in ethanol, the solution was stirred until all solids are dissolved, then the solution was added to the N-doped TiO2 carrier to ensure that they are evenly mixed. Second, the slurry was placed at room temperature for 24 h. Third, the slurry was dried to complete at 100 °C and then calcined at 500 °C for 5 h in air. The preparation of other catalysts is similar to CuCrLa/TiO2–N, the difference is the change of active component (Cu(NO3)2·3H2O was changed to ferric nitrate (Fe(NO3)3·9H2O, SCR, China, AR), cerium nitrate (Ce(NO3)3·6H2O, Macklin, China, AR)) and carrier (N-doped TiO2 was converted to TiO(OH)2, TiO2).
X-ray diffraction (XRD). An X-ray diffractometer (Rigaku Ultima IV) was used in determining the catalyst crystal structures using these parameters: scanning at 2θ range from 10° to 80°, radiation at 40 mA and 40 kV with Cu Kα (λ = 0.15406 nm).
Brunauer–Emmett–Teller surface area analysis (BET). Micromeritics ASAP 2460 was used to perform the test of N2 adsorption–desorption for the measurement of the textural characteristics of the catalysts at liquid nitrogen temperature −196 °C. To remove physically adsorbed species, the catalysts were pre-degassed for 10 h at 200 °C before each analysis. The pore size distribution and specific surface area of the catalysts were calculated using the Barrett–Joyner–Halenda (BJH) method and the Brunauer–Emmett–Teller (BET) equation.
Scanning electron microscopy (SEM). FEI Apreo was used to examine the morphology of the catalysts. The sample was dispersed on the conductive adhesive, and then sprayed gold to observe.
X-ray photoelectron spectroscopy (XPS). Escalab 250Xi with a monochromatic Al-Kα target (hν = 1486.6 eV) was used to obtain X-ray photoelectron spectroscopy (XPS) of the samples. Before the test, the samples were outgassed in a UHV chamber (<10−7 Pa). The calibration of binding energies of N 1s, O 1s, Ti 2p, Cr 2p, Ce 3d was obtained by using C 1s peak (284.8 eV). Peak fitting is done using XPSPEAK 4.1 with a Shirley background.
Hydrogen temperature programmed reduction (H2-TPR). A chemisorption apparatus (Micromeritics ChemiSorb 2720) with 0.2 g catalyst was used to collect H2-TPR profiles. Before that, the samples were pretreated in pure Ar atmosphere for 1 h at 300 °C and then cooled down to 50 °C for half an hour to mix the gas 10% H2/Ar. The TPR profiles of the catalysts were collected when the baseline remained unchanged by heating the samples from 50 to 800 °C at a rate of 10 °C min−1, with aggregation rate of 25 mL min−1 with 10% H2/Ar. Thermal conductivity detectors were taken in continuously monitoring H2 consumption.
Ammonia temperature programmed desorption (NH3-TPD). A chemisorption apparatus (Micromeritics Auto Chem II 2920) with 0.2 g catalyst was used to collect NH3-TPD profiles. Before that, the catalysts were preheated for 1 h at 300 °C in a helium flow and then cooled down to 100 °C for 5% NH3/He 1 h. The physically adsorbed NH3 was removed by purging He for another 1 h. When the samples were heated at a rate of 10°C min−1 from 100 to 500 °C, with aggregation rate of 50 mL min−1 with He, the profiles of the catalysts were recorded.
In situ diffuse reflectance infrared Fourier transform spectroscopy (in situ DRIFTS). A Bruker VERTEX 70 spectrometer with a highly sensitive MCT detector set to a resolution of 4 cm−1 with a scan count of 64 was used to carry out in situ DRIFTS experiments. And the samples were prepared by the KBr tableting method.
2.2 Catalytic performance measurement
In this work, a fixed-bed flow reactor containing 3 mL catalyst of 40–60 mesh was taken for testing SCR activities. The reaction condition was controlled as follows: 1000 ppm NO, 1000 ppm NH3, 5% O2, and the balance gas is N2. The gas hourly space velocity (GHSV) was approximately 20![[thin space (1/6-em)]](https://www.rsc.org/images/entities/char_2009.gif) 000 h−1, with a sum rate of 1000 mL min−1 of the feed gas. The NO concentration was measured with a signal NOx analyser (KM945, KANE, UK), reaction temperatures were recorded at an interval of at least 30 min in each test. The following equation was used to calculate NO conversion:
000 h−1, with a sum rate of 1000 mL min−1 of the feed gas. The NO concentration was measured with a signal NOx analyser (KM945, KANE, UK), reaction temperatures were recorded at an interval of at least 30 min in each test. The following equation was used to calculate NO conversion:
 | (1) |
3. Results and discussion
3.1 Catalytic properties of composite materials
NH3-SCR performance of CuCrLa/TiO2–N, FeCrLa/TiO2–N, CeCrLa/TiO2–N, CeCrLa/TiO(OH)2 and CeCrLa/TiO2 catalysts were evaluated as a function of temperature, and the results are illustrated in Fig. 1. From Fig. 1, compared with CuCrLa/TiO2–N and FeCrLa/TiO2–N, NO conversion of CeCrLa/TiO2–N increased with temperature from 140 °C to 300 °C, and it was stable at over 96% between 220–460 °C, which indicates that the synergistic effect of Ce, Cr, La plays a more important role in improving the catalytic activity, or CeCrLa/TiO2–N has the best synergistic effect between oxidation reducibility and acidity. Furthermore, CeCrLa/TiO2–N showed higher activity than CeCrLa/TiO(OH)2 and CeCrLa/TiO2 in the whole temperature range, which might be due to the addition of N promoting the redox performance, especially at low temperatures (<340 °C). Moreover, NO conversion of the CeCrLa/TiO2–N catalyst was stable at over 96% between 220–460 °C, compared with catalysts prepared in other studies,8,15,20 the temperature window is wider and the low-temperature performance is better.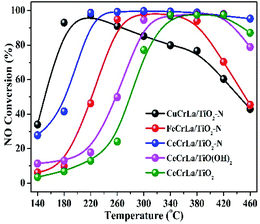 | ||
Fig. 1 NO conversion of the catalysts. Reaction conditions: [NO] = [NH3] = 1000 ppm, [O2] = 5%, N2 balance, GHSV = 20![[thin space (1/6-em)]](https://www.rsc.org/images/entities/char_2009.gif) 000 h−1. 000 h−1. | ||
3.2 Structural characterizations of catalysts
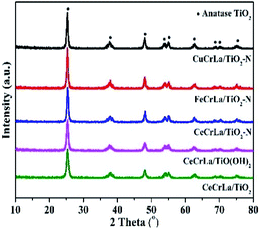
The XRD patterns of the catalysts are shown in Fig. 2. As seen, all samples display diffraction peaks at 25.3°, 37.8°, 48.1°, 53.9°, 55.1°, 62.8°, 68.7°, 70.4° and 75.1°, which correspond to anatase TiO2 phase peaks [PDF-JCPDS 21-1272]. No independent diffraction peaks related to CuOx, FeOx, CeOx, CrOx and LaOx were observed in all samples. This indicates that the supported metal oxides were in a highly dispersed state. The good dispersion facilitated good contact of the active components with each other, and led to strong interactions between Ti and other metal oxides.36 Moreover, good dispersion can increase the effective area, which improves the activity of the catalyst. According to the Debye–Scherrer's formula, the crystalline size was calculated and listed in Table 1. The crystal size increased in the following sequence: CeCrLa/TiO(OH)2 < CeCrLa/TiO2 < CeCrLa/TiO2–N < FeCrLa/TiO2–N < CuCrLa/TiO2–N. The different crystal size shows that N doping promotes the crystalline growth of anatase TiO2,37 Fe, Cu and Ti oxide had interaction, and that the crystallite size increased in different extent.| Samples | Crystal size (nm) | BET surface area (m2 g−1) | Pore volume (cm3 g−1) | Average pore diameter (nm) |
|---|---|---|---|---|
| CuCrLa/TiO2–N | 19 | 74 | 0.21 | 14 |
| FeCrLa/TiO2–N | 18 | 78 | 0.22 | 14 |
| CeCrLa/TiO2–N | 15 | 80 | 0.21 | 14 |
| CeCrLa/TiO(OH)2 | 13 | 90 | 0.24 | 14 |
| CeCrLa/TiO2 | 14 | 82 | 0.20 | 9 |
The N2 adsorption–desorption isotherms of the catalysts are presented in Fig. S1.† The BET surface areas, total pore volumes and average pore diameters of all samples are summarized in Table 1. As shown in Fig. S1(a),† the samples showed isotherms of type III, which exhibited hysteresis loops mostly of type H3, indicating that these samples contained mesopores (2–50 nm). Larger surface area and smaller average pore size contribute to the higher physisorption ability of catalyst. CeCrLa/TiO(OH)2 and CeCrLa/TiO2 with the stronger physical adsorption capacity compared with MCrLa/Ti–N (M = Cu, Fe, Ce) catalysts has the lower catalytic activity at low temperature, indicating that the addition of N has little effect on the BET surface area and pore size distribution. Based on these results, it appears that the textural parameters did not play an important role in this catalytic reaction system.
SEM test was carried out to observe the morphology of all samples. It can be observed in Fig. 3 that there is no significant difference in the morphology of the five catalysts. The catalysts are in the form of particles and they have aggregated.
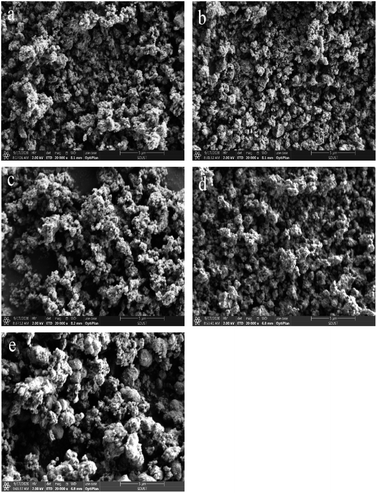 | ||
| Fig. 3 SEM images obtained for: (a) CuCrLa/TiO2–N, (b) FeCrLa/TiO2–N, (c) CeCrLa/TiO2–N, (d) CeCrLa/TiO(OH)2, (e) CeCrLa/TiO2. | ||
3.3 XPS analysis
To characterize the elemental state at the surface of the catalysts, a series of XPS studies were carried out in this paper, as shown in Fig. 4, and the surface element concentrations were listed in Table 2.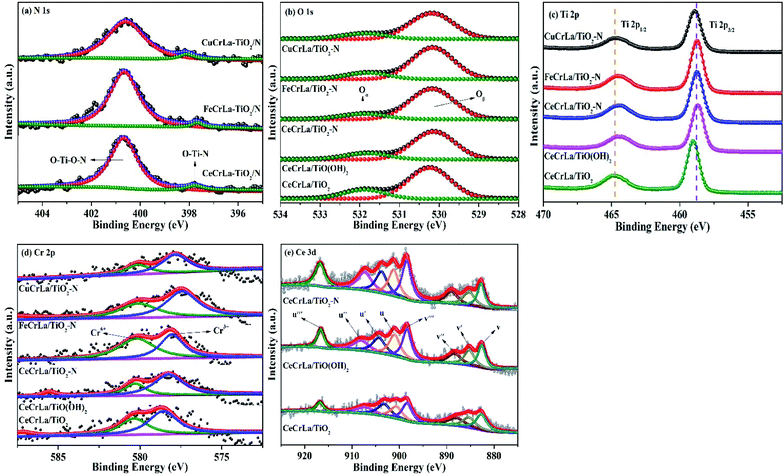 | ||
| Fig. 4 (a) N 1s, (b) O 1s, (c) Ti 2p, (d) Cr 2p XPS spectra of all samples, (e) Ce 3d XPS spectra of the CeCrLa/Ti catalysts. | ||
| Samples | H2 consumptiona (10−5 mmol g−1) | Total H2 consumptionb (10−5 mmol g−1) | Surface atomic contentc (%) | Percent of valence stated (%) | |||||||||||
|---|---|---|---|---|---|---|---|---|---|---|---|---|---|---|---|
| Peak 1 | Peak 2 | Peak 3 | Peak 4 | Peak 5 | Ce | Cr | Ti | O | N | Ns/Ne | Ce3+/Ce | Cr6+/Cr | Oα/O | ||
| a The H2 consumption over catalysts.b The total H2 consumption over catalysts.c The content of various elements determined by XPS.d The percent of valence state on the surface of catalysts.e The substituted N. | |||||||||||||||
| CuCrLa/TiO2–N | 10.2 | 7.5 | 8.6 | 1.4 | 1.0 | 28.7 | — | 0.8 | 36.5 | 59.0 | 2.5 | 4.3 | — | 12.2 | 9.0 |
| FeCrLa/TiO2–N | 3.3 | 3.7 | 11.8 | 2.6 | 3.8 | 25.2 | — | 0.7 | 37.8 | 58.2 | 2.9 | 2.8 | — | 30.6 | 10.6 |
| CeCrLa/TiO2–N | 4.2 | 5.4 | 12.1 | 5.8 | 3.6 | 31.1 | 0.1 | 0.8 | 37.8 | 58.4 | 2.8 | 4.6 | 22.1 | 35.4 | 11.1 |
| CeCrLa/TiO(OH)2 | 2.3 | 3.2 | 9.0 | 10.4 | — | 24.9 | 0.1 | 0.7 | 39.1 | 60.1 | — | — | 18.7 | 13.6 | 13.0 |
| CeCrLa/TiO2 | 2.5 | 3.3 | 7.6 | 9.8 | — | 23.2 | 0.1 | 0.7 | 36.6 | 62.4 | — | — | 15.5 | 25.2 | 18.0 |
The N 1s spectra as shown in Fig. 4(a) was deconvoluted into two component peaks located in the range of 397.8–398.1 eV and 400.6–400.9 eV. The characteristic peak at around 397.9 eV is attributed to O–Ti–N structures generated upon the replacement of O atoms in the TiO2 network.38 Furthermore, the peak at 400.8 eV can be assigned to O–Ti–O–N bonds, indicating that N atoms doped in the TiO2 lattice in the interstitial sites.39 From the XPS results, the existence of compounds O–Ti–N and O–Ti–O–N confirms that nitrogen atoms have been doped into the lattice of TiO2. It was reported that the nitrogen atoms replaced the oxygen atoms in the lattice of TiO2; which led to the production of a large number of oxygen vacancies.40 And the substitution of nitrogen alters the electronic properties of TiO2, which can improve the redox power of carriers.34 This is in agreement with CeCrLa/TiO2–N exhibiting the best NH3-SCR performance among the CeCrLa/Ti catalysts.
The O 1s XPS spectra of all catalysts are shown in Fig. 4(b). Based on the results reported in previous studies,41,42 the O 1s XPS spectra could be spilt into two peaks: lattice oxygen (B.E. = 530.0–530.4 eV, denoted as Oβ), chemisorbed oxygen (B.E. = 531.6–532.2 eV, denoted as Oα). The content of surface adsorbed oxygen over these catalysts is calculated as Oα/(Oα + Oβ) and listed in Table 2. The mobility of the surface chemisorbed oxygen is stronger than the lattice oxygen, thus it is easier to participate in the NH3-SCR reaction.43–45 In general, the high Oα/(Oα + Oβ) relative concentration ratio on the catalyst surface could be related to high SCR activity.46 It could be distinctly seen in Table 2 that the ratio of Oα on the CeCrLa/Ti catalysts were higher than that on CuCrLa/TiO2–N and FeCrLa/TiO2–N, indicating that Ce is more conducive to the production of chemisorbed oxygen adsorption site on the catalyst surface. Moreover, the ratio of Oα on CeCrLa/TiO(OH)2 and CeCrLa/TiO2 were higher than that on CeCrLa/TiO2–N, this might be because N replaced the adsorbed oxygen or N inhibited the oxygen mobility,47 and this indicate that moderate surface chemisorbed oxygen content is more conducive to high SCR activity and chemisorbed oxygen may not play an important role in this catalytic reaction system.
The XPS of Ti 2p can be fitted into two peaks. The peaks located at around 458.9 and 464.7 eV could be the result of the orbitals of Ti 2p1/2 and Ti 2p3/2, respectively. This indicated that Ti existed in Ti4+ oxidation state.48,49 It is observed that the binding energy of MCrLa/TiO2–N (M = Cu, Fe, Ce) shift to lower values compared with that of CeCrLa/TiO2, which means that Ti4+ partially reduces to Ti3+ due to the nitrogen species in TiO2 changing the electron density distribution of Ti atoms.50 That will increase the amount of defective active site and will be more beneficial to the adsorption of NH3 and NOx species, thereby promoting to the SCR reaction.36
The XPS spectra for Cr 2p of all samples are given in Fig. 4(d) and show that two distinct peaks corresponding to Cr3+ (577.6–578.8 eV), and Cr6+ (579.8–581.0 eV).10,14 It has been reported that Cr addition could facilitate the SCR performance by the valence change between Cr6+ and lower oxidized states (Cr5+, Cr3+ and Cr2+).51 From Fig. 5(d), it was obvious that the binding energy of Cr in CeCrLa/Ti catalysts shifted to the high field compared with CuCrLa/TiO2–N and FeCrLa/TiO2–N, indicating that the Cr undergone oxidation reaction, and the binding energy was shifted toward the high energy direction. The addition of Ce promotes the conversion between Cr3+ and Cr6+, improving the redox performance of the catalyst.11 As seen in Table 2, the ratio of Cr6+/Cr on CeCrLa/TiO2–N is the largest, which corresponds to the high NH3-SCR activity of CeCrLa/TiO2–N.
The Ce 3d XPS spectra of CeCrLa/Ti catalysts are presented in Fig. 4(e). According to previous studies,5,49,52 the Ce 3d XPS spectra could be separated into 8 peaks and “u” and “v” were attributed to Ce 3d3/2 and Ce 3d5/2, respectively. The two peaks labelled u′ and v′ could be assigned to Ce3+, with the remaining peaks of u, u′′, u′′′, v, v′′ and v′′′ belonging to Ce4+.53,54 The ratio of Ce3+/Ce for the CeCrLa/Ti samples could be calculated from the results of XPS analysis and the results are listed in Table 2. Obviously, the ratio of Ce3+/Ce over CeCrLa/TiO2–N is higher than that of CeCrLa/TiO(OH)2 and CeCrLa/TiO2. This indicates that the introduction of N has promoted the conversion of Ce4+ to Ce3+. It can be speculated that N can provide electrons to promote the conversion of Ce4+ to Ce3+, which directly leads to the highest Ce3+/Ce ratio of CeCrLa/TiO2–N among the CeCrLa/Ti catalysts.
3.4 H2-TPR analysis
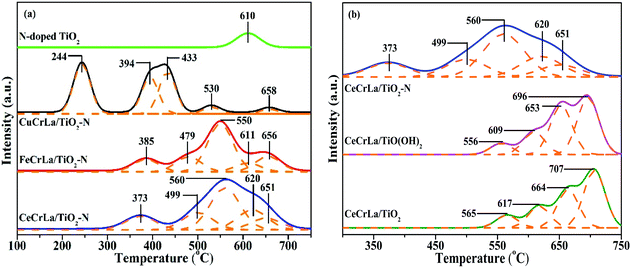
The redox property of the samples was determined by H2-TPR analysis, and the results are shown in Fig. 5. It is apparent that there is one reduction peak in the profile of N-doped TiO2, and it could be attributed to Ti4+ → Ti3+.55 From Fig. 5(a), there are five peaks appear from 200 to 700 °C in the H2-TPR profile of MCrLa/TiO2–N (M = Cu, Fe, Ce). It has been reported that CuOx species have a great degree of reduction capacity at lower temperatures.56 Thus, the first peak of CuCrLa/TiO2–N appeared at 244 °C can be assigned to Cu2+ → Cu+, which is lower than that of FeCrLa/TiO2–N and CeCrLa/TiO2–N and as for the excellent redox property at lower temperatures, CuCrLa/TiO2–N displayed the best low-temperature performance (NO conversion >90% at 180–220 °C). Furthermore, the reduction peak temperature sequence of the samples is consistent with the order of their low-temperature (<220 °C) activity, which is CuCrLa/TiO2–N > CeCrLa/TiO2–N > FeCrLa/TiO2–N > CeCrLa/TiO(OH)2 > CeCrLa/TiO2. As listed in Table 2, total H2 consumption of CeCrLa/TiO2–N was the highest among MCrLa/TiO2–N (M = Cu, Fe, Ce), which indicates that the synergistic effect between Ce, Cr and La was more conducive to promoting the high-temperature SCR activity.For CeCrLa/TiO(OH)2 and CeCrLa/TiO2, four obvious reduction peaks can be seen, and the first peaks could be attributed to Cr6+ → Cr3+, the second peaks might be assigned as Cr3+ → Cr0, the third peaks might due to Ce4+ → Ce3+, the fourth peaks could be considered as co-reduction of Ce3+ → Ce0 and Ti4+ → Ti3+. It can be clearly seen from Fig. 5(b) that the reduction peaks of CeCrLa/TiO2–N moves toward lower temperatures compared with CeCrLa/TiO(OH)2 and CeCrLa/TiO2, suggesting that the reducibility increased with the changes in the surface chemical environment after N-doping. As listed in Table 2, the reducibility among catalysts doped with N enhanced at low temperatures, thus MCrLa/TiO2–N (M = Cu, Fe, Ce) exhibited higher NO conversion at low temperatures.
3.5 NH3-TPD analysis
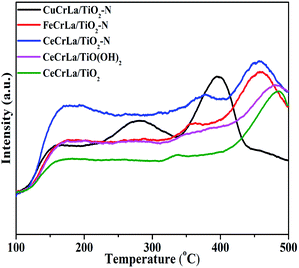
NH3-TPD tests were performed and the results are shown in Fig. 6. From Fig. 6, three peaks appear from 100 to 500 °C in the NH3-TPD profile of each catalyst. The peaks at the range of 150–200 °C, 250–370 °C and 400–500 °C refer to weak acid, medium-strength acid, and high-strength acid, respectively.57–59 According to literature,60 the medium-strength and high-strength acid sites are effective for NO reduction at moderate to high temperature. As seen from Fig. 6, compared with CuCrLa/TiO2–N and FeCrLa/TiO2–N, the desorption peaks of CeCrLa/TiO2–N shifts to a higher temperature range, suggesting that the strength of the acid sites on CeCrLa/TiO2–N is stronger. Furthermore, the peak area of CeCrLa/TiO2–N increased with the introduction of N by comparing the NH3-TPD results of the CeCrLa/Ti samples. This indicates that the doping of nitrogen promotes the increase of acid sites on the surface of CeCrLa/TiO2–N. The CeCrLa/TiO2–N presents the largest NH3 adsorption capacity, which is helpful to promote the NH3-SCR reaction over it. However, it can be clearly seen that the peak area of medium-strength acid of CuCrLa/TiO2–N is the widest, which does not conform to its activity. It might be related to the formation of copper ammonium complex ions.613.6 Investigation of reaction mechanism
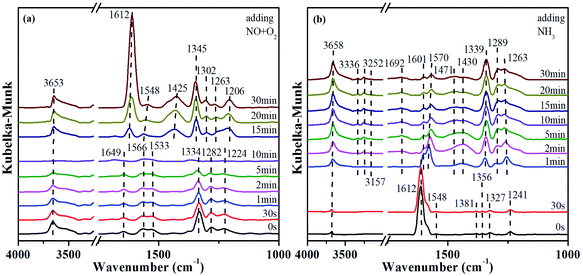
In order to explore the activation ability of the catalyst, the formation and transformation of surface species, the sample with the best catalytic activity, CeCrLa/TiO2–N, was selected for in situ DRIFTS characterization (NH3 pre-adsorption and then NO + O2, NO + O2 pre-adsorption and then NH3).
 | (2) |
 | (3) |
 | (4) |
| O2(g) + □ → 2O(a) | (5) |
| NO(a) + O(a) → monodentate, bidentate, and bridging nitrates, monodentate nitrites | (6) |
| NH3(a)/–NH2/NH4+(a) + monodentate/bidentate/bridging nitrates, monodentate nitrites → N2 + H2O | (7) |
4. Conclusions
In the present work, a series of MCrLa/Ti–N (M = Cu, Fe, Ce) and CeCrLa/Ti catalysts were prepared. The main purpose was to investigate how the physico-chemical properties and NH3-SCR performance of the catalysts was influenced as a function of the support modified by N. Some interesting conclusions can be drawn from the characterization results as follows: N doping affects the crystalline growth of anatase TiO2. Moreover, the doping of N promotes the increase of Cr6+/Cr ratio, Ce3+/Ce ratio, and the surface chemical adsorption oxygen content, which is reflected in the improvement of the oxidation-reduction capacity. And the surface acid content of the catalyst increased with the doping of N, which related to the best catalytic activity of CeCrLa/TiO2–N at high temperature. Therefore, CeCrLa/TiO2–N exhibited the highest catalytic activity among these catalysts. From the above discussion, the conclusion can be reached that the N-doped TiO2 as catalyst support is indeed beneficial to the improvement of NH3-SCR performance of catalysts. And in situ DRIFTS analysis indicates that the reaction between NH3 adsorption species and ad-NOx species mainly occurred on the catalyst followed L–H mechanism.Author contributions
Xiaoyi Sun: writing-original draft, data curation, investigation, formal analysis. Qingjie Liu: investigation. Shuai Liu: validation. Xintang Zhang: conceptualization, resources, supervision. Shanshan Liu: writing-review & editing, formal analysis, project administration.Conflicts of interest
There are no conflicts to declare.Acknowledgements
Thanks are due to Professor Zhang for advice on experimental design. I wish to thank the timely help from Dr Liu in analyzing the large number of samples and the article writing. Additional thanks are due to Qingjie Liu and Shuai Liu for help on experimental operation. This research did not receive any specific grant from funding agencies in the public, commercial, or not-for-profit sectors.References
- S. Ren, F. Q. Guo, J. Yang, L. Yao, Q. Zhao and M. Kong, Chem. Eng. Res. Des., 2017, 126, 278–285 CrossRef CAS.
- B. Thirupathi and P. G. Smirniotis, Appl. Catal., B, 2011, 110, 195–206 CrossRef CAS.
- M. Saeidi and M. Hamidzadeh, Res. Chem. Intermed., 2016, 43, 2143–2157 CrossRef.
- L. L. Guo, L. Liu, X. L. Zhu, Q. Zhang and C. Y. Li, J. Fuel Chem. Technol., 2017, 45, 723–730 CrossRef CAS.
- L. Chen, Q. L. Wang, X. X. Wang, Q. L. Cong, H. Y. Ma, T. J. Guo, S. J. Li and W. Li, Chem. Eng. J., 2020, 390, 124251 CrossRef CAS.
- C. Liu, L. Chen, J. Li, L. Ma, H. Arandiyan, Y. Du, J. Xu and J. Hao, Environ. Sci. Technol., 2012, 46, 6182–6189 CrossRef CAS PubMed.
- R. H. Gao, D. S. Zhang, P. Maitarad, L. Y. Shi, T. Rungrotmongkol, H. R. Li, J. P. Zhang and W. G. Cao, J. Phys. Chem. C, 2013, 117, 10502–10511 CrossRef CAS.
- P. Sun, R. T. Guo, S. M. Liu, S. X. Wang, W. G. Pan, M. Y. Li, S. W. Liu, J. Liu and X. Sun, Mol. Catal., 2017, 433, 224–234 CrossRef CAS.
- L. Chen, J. H. Li, M. F. Ge, L. Ma and H. Z. Chang, Chin. J. Catal., 2011, 32, 836–841 CrossRef CAS.
- Z. Y. Wang, R. T. Guo, Z. Z. Guan, X. Shi, W. G. Pan, Z. G. Fu, H. Qin and X. Y. Liu, Appl. Surf. Sci., 2019, 485, 133–140 CrossRef CAS.
- W. Cai, Q. Zhong, S. L. Zhang and J. X. Zhang, RSC Adv., 2013, 3, 7009–7015 RSC.
- W. Cai, Q. Zhong, Y. Yu and S. Dai, Chem. Eng. J., 2016, 288, 238–245 CrossRef CAS.
- M. Lu, H. L. Hou, C. Y. Wei, X. H. Guan, W. Wei and G. S. Wang, Catalysts, 2020, 10, 140 CrossRef CAS.
- J. Su, W. Y. Yao, Y. Liu and Z. B. Wu, Appl. Surf. Sci., 2017, 396, 1026–1033 CrossRef CAS.
- J. X. Zhang, S. L. Zhang, W. Cai and Q. Zhong, Appl. Surf. Sci., 2013, 268, 535–540 CrossRef CAS.
- F. Bin, X. L. Wei, B. Li and K. S. Hui, Appl. Catal., B, 2015, 162, 282–288 CrossRef CAS.
- Q. Gao, S. Han, Q. Ye, S. Y. Cheng, T. F. Kang and H. X. Dai, Catalysts, 2020, 10, 336 CrossRef CAS.
- P. Lu, C. T. Li, G. M. Zeng, L. J. He, D. L. Peng, H. F. Cui, S. H. Li and Y. B. Zhai, Appl. Catal., B, 2010, 96, 157–161 CrossRef CAS.
- H. H. Yi, K. Yang, X. L. Tang, S. Z. Zhao, F. Y. Gao, Y. H. Huang, Y. R. Shi, X. Z. Xie and R. C. Zhang, Ind. Eng. Chem. Res., 2019, 58, 5423–5431 CrossRef CAS.
- D. J. Zhang, Z. R. Ma, B. D. Wang, Q. Sun, W. Q. Xu and T. Zhu, J. Rare Earths, 2020, 38, 157–166 CrossRef CAS.
- Z. C. Si, D. Weng, X. D. Wu, J. Li and G. Li, J. Catal., 2010, 271, 43–51 CrossRef CAS.
- C. M. Chen, Y. Cao, S. T. Liu, J. M. Chen and W. B. Jia, Appl. Surf. Sci., 2019, 480, 537–547 CrossRef CAS.
- A. P. Donovan, S. U. Balu and G. S. Panagiotis, J. Catal., 2004, 221(2), 421–431 CrossRef.
- T. K. Liu, L. Q. Wei, Y. Y. Yao, L. H. Dong and B. Li, Appl. Surf. Sci., 2021, 546, 148971 CrossRef CAS.
- T. T. Ge, B. Z. Zhu, Y. L. Sun, W. Y. Song, Q. L. Fang and Y. X. Zhong, Environ. Sci. Pollut. Res. Int., 2019, 26, 33067–33075 CrossRef CAS PubMed.
- X. X. Hou, H. P. Chen, Y. H. Liang, Y. L. Wei and Z. Q. Li, Catal. Surv. Asia, 2020, 291–299 CrossRef CAS.
- J. B. Tong, Y. Lin, S. L. Liu, J. T. Wen and Y. Y. Liu, Chem. Ind. Eng. Prog., 2014, 33, 1170–1179 CAS.
- X. Y. Liu, P. Zhang, Y. Y. Jia, Z. H. Tang, G. L. Liu and S. F. Wu, Environ. Prot. Chem. Ind., 2020, 40, 26–31 Search PubMed.
- Y. Ganjkhanlou, T. V. W. Janssens, P. N. R. Vennestrøm, L. Mino, M. C. Paganini, M. Signorile, S. Bordiga and G. Berlier, Appl. Catal., B, 2020, 278, 119337 CrossRef CAS.
- N. Kaur, S. K. Shahi, J. S. Shahi, S. Sandhu, R. Sharma and V. Singh, Vacuum, 2020, 178, 109429 CrossRef CAS.
- S. M. Reda, M. Khairy and M. A. Mousa, Arabian J. Chem., 2020, 13, 86–95 CrossRef CAS.
- W. J. Bao, H. X. Chen, H. Wang, R. D. Zhang, Y. Wei and L. R. Zheng, ACS Appl. Nano Mater., 2020, 3, 2614–2624 CrossRef CAS.
- C. M. Chen, Y. Cao, S. T. Liu, J. M. Chen and W. B. Jia, Chin. J. Catal., 2018, 39, 1347–1365 CrossRef CAS.
- L. G. Devi and R. Kavitha, Appl. Catal., B, 2013, 140, 559–587 CrossRef.
- F. Veisi, M. A. Zazouli, J. Y. Charati, M. A. Ebrahimzadeh and A. S. Dezfoli, Environ. Sci. Pollut. Res., 2016, 23, 21846–21860 CrossRef CAS PubMed.
- S. Z. Xie, L. L. Li, L. J. Jin, Y. H. Wu, H. Liu, Q. J. Qin, X. L. Wei, J. X. Liu, L. H. Dong and B. Li, Appl. Surf. Sci., 2020, 515, 146014 CrossRef CAS.
- P. S. Jadhav, T. Jadhav, M. Bhosale, C. H. Jadhav and V. C. Pawar, Mater. Today: Proc., 2020, 43, 2763–2767 Search PubMed.
- S. P. Kunde, K. G. Kanade, B. K. Karale, H. N. Akolkar, S. S. Arbuj, P. V. Randhavane, S. T. Shinde, M. H. Shaikh and A. K. Kulkarni, RSC Adv., 2020, 10, 26997–27005 RSC.
- C. Zhao, Z. H. Wang, X. Chen, H. Y. Chu, H. F. Fu and C. C. Wang, Chin. J. Catal., 2020, 41, 1186–1197 CrossRef CAS.
- K. Choi, J. Bang, I. Moon, K. Kim and J. Oh, J. Alloys Compd., 2020, 843, 155973 CrossRef CAS.
- S. H. Wang, C. Fan, Z. Q. Zhao, Q. Liu, G. Xu, M. H. Wu, J. J. Chen and J. H. Li, Appl. Catal., A, 2020, 597, 117554 CrossRef CAS.
- E. H. Gao, G. J. Sun, W. Zhang, M. T. Bernards, Y. He, H. Pan and Y. Shi, Chem. Eng. J., 2020, 380, 122397 CrossRef CAS.
- S. H. Li, B. C. Huang and C. L. Yu, Catal. Commun., 2017, 98, 47–51 CrossRef CAS.
- X. J. Yao, K. L. Ma, W. X. Zou, S. G. He, J. B. An, F. M. Yang and L. Dong, Chin. J. Catal., 2017, 38, 146–159 CrossRef CAS.
- X. J. Yao, T. T. Kong, S. H. Yu, L. L. Li, F. M. Yang and L. Dong, Appl. Surf. Sci., 2017, 402, 208–217 CrossRef CAS.
- Y. Peng, K. Z. Li and J. H. Li, Appl. Catal., B, 2013, 140–141, 483–492 CrossRef CAS.
- F. Zhou, H. B. Song, H. Q. Wang, S. Komarneni and C. J. Yan, Appl. Clay Sci., 2018, 166, 9–17 CrossRef CAS.
- K. J. Lee, P. A. Kumar, M. S. Maqbool, K. N. Rao, K. H. Song and H. P. Ha, Appl. Catal., B, 2013, 142–143, 705–717 CrossRef CAS.
- S. S. Liu, H. Wang, Y. Wei and R. D. Zhang, Mol. Catal., 2020, 485, 110822 CrossRef CAS.
- Y.-H. Lin, T.-C. Chiu, H.-T. Hsueh and H. Chu, Appl. Surf. Sci., 2011, 258, 1581–1586 CrossRef CAS.
- Q. Yu, R. Manfred, L. D. Li, F. X. Kong, G. J. Wu and N. J. Guan, Catal. Commun., 2010, 11, 955–959 CrossRef CAS.
- M. Romeo, K. Bak, J. E. Fallah, F. L. Normand and L. Hilaire, Surf. Interface Anal., 1993, 20, 508–512 CrossRef CAS.
- J. Cheng, L. Y. Song, R. Wu, S. N. Li, Y. M. Sun, H. T. Zhu, W. G. Qiu and H. He, J. Rare Earths, 2020, 38, 59–69 CrossRef CAS.
- Q. L. Wang, J. J. Zhou, J. C. Zhang, H. Zhu, Y. H. Feng and J. Jin, Aerosol Air Qual. Res., 2020, 20, 477–488 CAS.
- R. Sounak, B. Viswanath, M. S. Hegde and M. Giridhar, J. Phys. Chem. C, 2008, 112, 6002–6012 CrossRef.
- S. Ali, L. Q. Chen, Z. B. Li, T. R. Zhang, R. Li, S. H. Bakhtiar, X. S. Leng, F. L. Yuan, X. Y. Niu and Y. J. Zhu, Appl. Catal., B, 2018, 236, 25–35 CrossRef CAS.
- S. Roy, B. Viswanath, M. S. Hegde and G. Madras, J. Phys. Chem. C, 2008, 112, 6002–6012 CrossRef CAS.
- S. C. Li, W. J. Huang, H. M. Xu, T. J. Chen, Y. Ke, Z. Qu and N. Q. Yan, Appl. Catal., B, 2020, 270, 118872 CrossRef CAS.
- H. D. Xu, Y. Wang, Y. Cao, Z. T. Fang, T. Lin, M. C. Gong and Y. Q. Chen, Chem. Eng. J., 2014, 240, 62–73 CrossRef CAS.
- H. Chitsazi, R. Wu, N. Q. Zhang, J. D. He, G. Z. Zhang and H. He, Catal. Lett., 2020, 150, 2688–2694 CrossRef CAS.
- X. X. Wang, Y. Shi, S. J. Li and W. Li, Appl. Catal., B, 2018, 220, 234–250 CrossRef CAS.
- K. I. Hadjiivanov, Catal. Rev.: Sci. Eng., 2000, 42, 71–144 CrossRef CAS.
- X. J. Yao, R. D. Zhao, L. Chen, J. Du, C. Y. Tao, F. M. Yang and L. Dong, Appl. Catal., B, 2017, 208, 82–93 CrossRef CAS.
- K. I. Hadjiivanov, Catal. Rev., 2000, 42, 71–144 CrossRef CAS.
- L. Chen, Z. Si, X. Wu and D. Weng, ACS Appl. Mater. Interfaces, 2014, 6, 8134–8145 CrossRef CAS PubMed.
- E. H. Gao, B. Huang, Z. L. Zhao, H. Pan, W. Zhang, Y. N. Li, M. T. Bernards, Y. He and Y. Shi, Catal. Sci. Technol., 2020, 10, 4752–4765 RSC.
- J. Yang, S. Ren, Y. H. Zhou, Z. H. Su, L. Yao, J. Cao, L. J. Jiang, G. Hu, M. Kong, J. Yang and Q. C. Liu, Chem. Eng. J., 2020, 397, 125446 CrossRef CAS.
Footnote |
| † Electronic supplementary information (ESI) available. See DOI: 10.1039/d1ra03845a |
| This journal is © The Royal Society of Chemistry 2021 |

