 Open Access Article
Structure-flexible DNA origami translocation through a solid-state nanopore†
Jing Yang*ab,
Nan Zhao‡
a,
Yuan Liang‡a,
Zuhong Lu*c and
Cheng Zhang *b
*b
aSchool of Control and Computer Engineering, North China Electric Power University, Beijing 102206, China. E-mail: yjzcdd_2000@ncepu.edu.cn
bSchool of Electronics Engineering and Computer Science, Peking University, Beijing 100871, China. E-mail: zhangcheng369@pku.edu.cn
cThe State Key Laboratory of Bioelectronics, Southeast University, Nanjing, 211189, China
First published on 2nd July 2021
Abstract
Nanopore detection is a label-free detection method designed to analyze single molecules by comparing specific translocation events with high signal-to-noise ratios. However, it is still challenging to understand the influences of structural flexibility of 100 nm DNA origami on nanopore translocations. Here, we used solid-state nanopores to characterize the translocation of “nunchaku” origami structures, the flexibility of which can be regulated by introducing specific DNA strands and streptavidin protein. The structural changes can result in significant variations in the translocation signals and distributions. It is anticipated that such a method of the flexible DNA origami translocation through a solid-state nanopore will find further applications in molecular detection as well as biosensing.
Introduction
DNA origami is a versatile assembly method to construct various programmable and addressable nanostructures. It has attracted significant research interest with applications in molecular engineering, diagnostics, biosensing, molecular sensors,1,2 drug delivery,3–8 and enzyme cascade reactions.9–13 In particular, origami enables an accurate control of nanostructure conformations via DNA base-pairing.14–20Nanopore-based devices are ultra-sensitive with regard to conformational changes and label-free modifications at the single-molecule level.21–24 Nanopore detection extracts characteristics of target molecules by monitoring changes in current signals as the target moves through the pore. Compared with biological nanopores, solid-state (SS) nanopores have controllable shapes and sizes, enabling the detection of various molecules,25–35 such as nucleotides,25–29 proteins,30–32 and reaction products.33–35 DNA origami translocation through a SS-nanopore has been well-developed by using simple, linear, double DNA duplexes and nanostructures with fixed geometries.36–38 Although DNA origamis are detected adequately with SS-nanopores, the focus has been on monitoring the translocation of fixed geometries. It is still a challenge to analyze the flexibility of origami structures via translocation through a SS-nanopore. Ideally, it would be advantageous to monitor small nanostructural changes via nanopore detections.
In this study, we designed a 100 nm three-dimensional DNA origami with a “nunchaku” structure resembling two sticks connected at one end by a short chain, and examined translocation through 20 nm-diameter silicon-nitride nanopores. Moreover, the flexibility of the origami structures can be regulated by DNA hybridization and streptavidin (SA) protein binding. Here, various kinds of origami structures are detected using the SS-nanopores to produce different nanopore signals and distributions. The experimental results demonstrated that SS-nanopores can monitor the origami flexibility induced by the binding of DNA and protein. This method has potential applications in biomolecular detection and biosensing.
Result and discussion
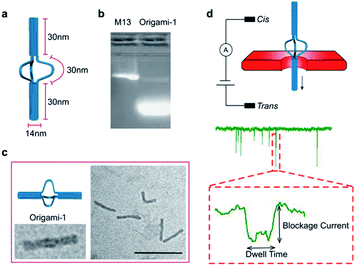
A DNA origami structure (origami-1) was designed as a nunchaku with a total length of 90 nm (Fig. 1a), assembled with a m13mp18 scaffold and 145 short staples (Table S1†).39 The origami-1 structures can be flexibly and dynamically controlled, and are divided into three parts. The two ends are nano-cylinders with 30 nm lengths and 14 nm diameters. A group of connectors consisting of six single-stranded (ss) DNAs form a 30 nm link between the two nano-cylinders. Control of the origami conformation was established by introducing specific DNA helper strands to pull the cylinders ends closer to each other (Fig. S1†).The nunchaku origamis were assembled via one-step annealing and characterized with agarose gel electrophoresis and transmission electron microscopy (TEM). As shown in Fig. 1b, a sharp gel band was observed in the gel lanes indicating the target products. In the TEM images in Fig. 1c, various origami-1 structures were observed as straight and bent shapes, possibly due to the softness in the middle section. In the TEM results, most of the origami-1 structures were formed as designed. In the nanopore experiments, origami-1 was detected with 20 nm-diameter SS-nanopores fabricated in 30 nm thick SiNx membranes (Fig. 1d). To avoid misfolded products, the assembled DNA origami structures were first purified by electrophoresis, and then detected with the SS-nanopore in buffer of 1 M KCl. Accordingly, the specific nanopore signals representing the target origami translocation can be obtained as shown in Fig. 1d.
In the design, the origami structures can be regulated by adding DNA helper strands (H1⋯H6) that specifically complement the six ssDNA connectors. Origami-1 is constructed without adding DNA helper strands, thus with flexible structures of straight and bent shapes as indicated in Fig. 2 and S8.† By selectively adding specific DNA helper strands, two other structures of origami-2 and -3 can be constructed. When only one pair of helper strands (H1 and H2) are introduced, the origami-2 is designed to form with a bent structure (Fig. 2a and S1b†). In this state, only one point of the cylindrical cross section was tightly connected, while two other points freely swayed. TEM images indicated that most of the origami-2 structures were bent with a statistical range of angles over 100–180 degrees (Fig. S9†). Interestingly, when all three pairs of helper strands (H1⋯H6) were introduced to produce origami-3, the cross-sections of the two origami cylinders were tightly connected, the structures were designed to become straight with a relative compact state. The TEM images indicated most of the origami-3 structures were straight with angles of 180 degrees (Fig. 2a and S10†). Meanwhile, the gel electrophoresis results verified that three distinct origami structures were assembled before the purifications (Fig. 2b). However, there were no significant differences can be found in the gel migration speeds of the three origami product bands.
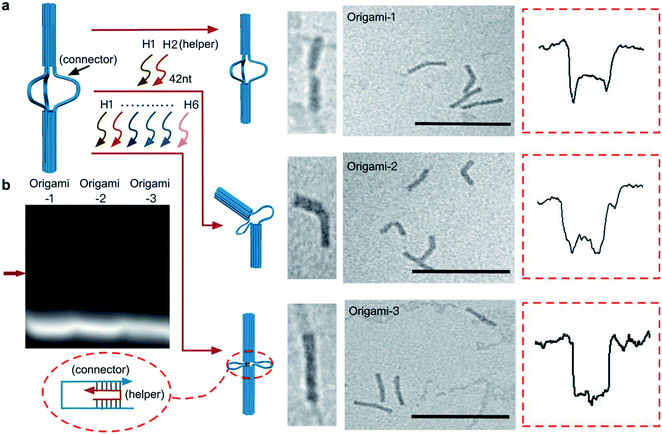 | ||
| Fig. 2 Dynamic control of origami structures. (a) Schematic of structural changes in origami-1, TEM images and characteristic nanopore signals (more signals are shown in Fig. S4–S6†) when only one pair of the complementary strands (H1, H2) was introduced to produce origami-2. When three pairs of the complementary strands (H1⋯H6) were introduced, origami-1 became origami-3. Scale bar: 200 nm. (b) 1% agarose gel results for the three origamis. The red arrow is the origami structures that was formed. | ||
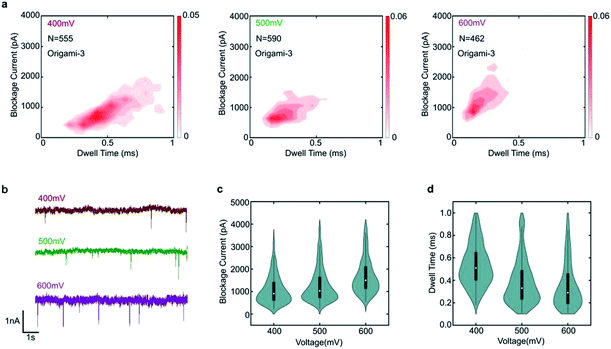
To demonstrate the nanopore signals are indeed induced by the translocations of DNA origami, the varied voltages of 400 mV, 500 mV and 600 mV were applied. The specific translocation events of origami-3 can be observed under the different voltages in Fig. 3a. The nanopore results indicated that the frequency of translocation events increased when higher bias voltages were applied in Fig. 3b and S2.† For origami-3, the mean blockage currents were about 896 pA, 1126 pA, 1568 pA for applied biases of 400 mV, 500 mV, and 600 mV, respectively (Fig. 3c). The statistical results demonstrated that the maximum blockage current increased with applied bias. In addition, the mean dwell time (0.53 ms, 0.38 ms, and 0.35 ms) decreased with increasing biases (400 mV, 500 mV, and 600 mV, respectively). These results were consistent with previous reports on assembled DNA complex (e.g., tetrahedra DNA) translocation through SS-nanopores.40
The results for translocations of origami-1 structure (Fig. 2) at applied positive biases of 300 mV, 400 mV, and 500 mV were similar to those for origami-3 (Fig. S3†). The number of translocation events of origami-1 was significantly reduced at +300 mV, possibly due to an insufficient force to pull the structures through the channel (Fig. S3†).
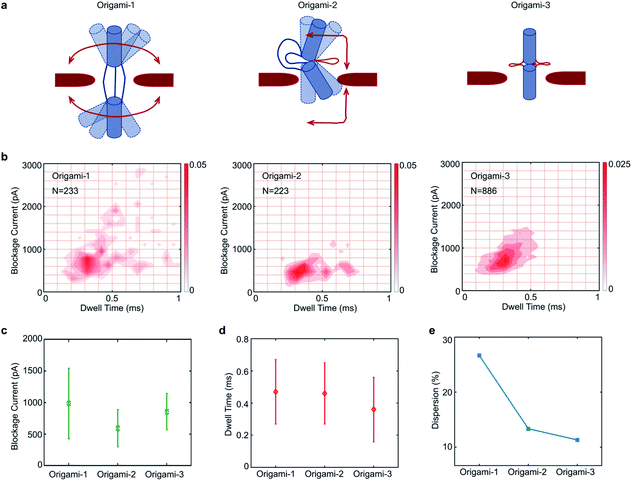
Because the flexible origami cylinder structures collided with nanopore edges during the translocation, the flexibility of origami structures would have an influence on the nanopore signals. Here, three origami structures have different conformational flexibilities as indicated in Fig. 4a. Clearly, the structure of origami-1 has a maximum flexibility for its softness in the middle section (Fig. S7†). While the flexibility of origami-2 become less, it is because one point of the cylindrical cross section was tightly connected Fig. 4a. Nevertheless, the structure of origami-3 almost lost the flexibility due to the tight connection between the cross-sections of the two origami cylinders Fig. 4a.
The feasibility of using nanopores to characterize DNA origami with different structural flexibilities was examined by individually translocating the origami-1, origami-2, and origami-3 structures through the 20 nm-diameter SS-nanopore. All the experiments were performed in 1 M KCl at a +500 mV bias, and the origami samples were added to the cis reservoir at a final concentration of 1 nM. To compare differences in the translocation signals of the three samples, statistical analyses of the translocation events were focused on current blockage and dwell time. Fig. 4b plots the distributions of the translocation event signals from the three origami samples.
The mean values in blockage current of origami-1, origami-2, and origami-3 were 1 nA, 0.59 nA, and 0.86 nA, respectively (Fig. 4c). Origami-3 translocations induced much higher mean current blockages than those of origami-2, possibly because of the protruding loop structures in the middle section created by the extensive hybridization of the three helper strands. However, origami-3 had the fastest mean translocation time at 0.37 ms (Fig. 4d). But the mean translocation time for origami-1 and origami-2 is 0.47 ms and 0.46 ms, respectively. This can be understood in terms of the rigid and compact origami-3 structure relative to those of origami-2 and origami-1. Therefore, the results indicate the flexibilities of origami structures do affect translocation through the nanopore.
It was observed in Fig. 4e that the signal distributions for origami-1 had the largest dispersion in translocation events, with much larger current blockages and longer translocation (dwell) time (details of the calculations for the signal distributions are in the Fig. S12b†). In contrast, the origami-2 and origami-3 signal distributions exhibited much less scattering (Fig. 4e and S11†). A possible reason is that the free state of origami-1 has more flexible structures, which may greatly increase collisions with the nanopore channel during translocations, thus inducing larger blockages and longer translocations. The relatively rigid structures of origami-2 and origami-3 reduced the chances for collisions with the nanopore, and thus had fewer interactions during translocation. To verify whether the signal distributions were affected by structural flexibility, origami-4 was designed with 15 nm-long link connectors in the middle of the origami structure, instead of the 30 nm-long link connectors used for origami-1 (Fig. S13a†). Accordingly, there was less scattering in the signal distribution for origami-4 relative to that of origami-1, as the shorter link connector in origami-4 allows less structural flexibility (Fig. S13b–d†).
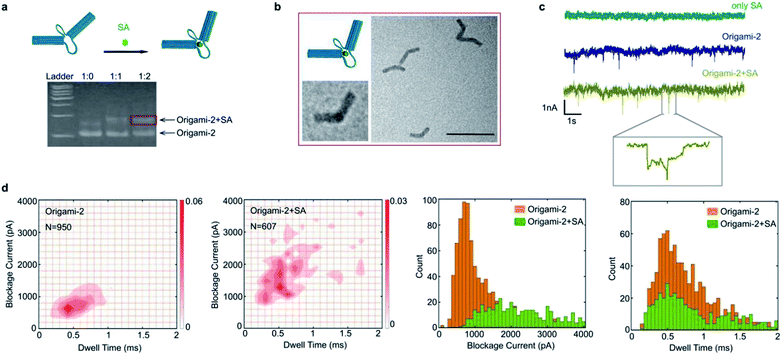
Taking advantages of molecular interactions influencing the origami conformational flexibility, the streptavidin (SA) binding method was used to regulate the origami nanopore translocations. As shown in Fig. 5a, two biotin molecules were designed to attach on the opposite cross sections of the two cylinders in origami-2. Because one SA protein has four biotin connection sites, origami-2 can form an origami/SA complex. After the SA/biotin binding, the structure of origami-2/SA became more rigid because the binding limited the swaying flexibility of the two cylinders. In agarose gel results, a slower migrating band in the gel was observed upon introducing SA to the biotin-labelled origami-2 (Fig. 5a). The best origami-2/SA yield was obtained at an origami-2 to SA concentration ratio of 1![[thin space (1/6-em)]](https://www.rsc.org/images/entities/char_2009.gif) :
:![[thin space (1/6-em)]](https://www.rsc.org/images/entities/char_2009.gif) 2. The SA binding-induced origami-2 conformational change was confirmed by TEM images, where most of the origami structures were bent (Fig. 5b). By statistical analysis, the origami-2 angle distribution becomes narrow after SA binding, indicating an effective regulation on the origami structures (Fig. S14†).
2. The SA binding-induced origami-2 conformational change was confirmed by TEM images, where most of the origami structures were bent (Fig. 5b). By statistical analysis, the origami-2 angle distribution becomes narrow after SA binding, indicating an effective regulation on the origami structures (Fig. S14†).
In the SA-origami binding influenced nanopore experiments, three kinds of samples were used to produce nanopore translocation signals: SA protein, origami-2, and the origami-2/SA complex (Fig. 5c). The origami-2/SA complex was purified by agarose electrophoresis. No translocation signal was generated when only the SA protein was present. While significant translocation signals were generated by origami-2 and the complex, using the same SS-nanopore (Fig. 5c). Interestingly, the signal distribution range of the SA/origami complex was much wider, with relative larger current blockages and longer times, than that of origami-2 only. Thus, the results indicate the SA binding induced origami-2 conformational changes affected translocation. The mean value of the current blockages for the complex was about 2000 pA, almost twice that of origami-2 (Fig. 5d), whereas the mean dwell time were almost the same for origami-2 and the complex. The nanopore results demonstrates that protein-binding-induced conformational changes have more impacts on the current blockage than the dwell time.
Conclusions
In this work, we reported a method that used translocation through nanopores to characterize the flexible DNA origami structures with 100 nm dimensions. The flexibility of the origami structures was designed to be controlled via DNA strand hybridizations and protein interactions. The experimental results revealed that small conformational changes in the structures, as verified by TEM, resulted in significant variations of the translocation signals and their distributions. Hence, a SS-nanopore is able to monitor conformational changes in DNA origami structures and could be used for broader applications. Overall, this approach provides a label-free and rapid tool for conformational characterization of DNA origami, as well as nanopore diagnostics and biosensing.Author contributions
C. Z., J. Y. and N. Z. designed the DNA structures and performed the experiments. C. Z. and Z. H. L. analysed the data. C. Z., J. Y. wrote the paper. C. Z., J. Y, N. Z. and Y. L. discussed the design and results of the experiments. All authors commented on the manuscript.Conflicts of interest
There are no conflicts to declare.Acknowledgements
This work was supported by the National Key R&D Program of China (2017YFE0130600 and 2016YFA0501603), National Natural Science Foundation of China (62073133, 61872007), Beijing Natural Science Foundation (Z201100008320002). We thank Alan Burns, PhD, from the Liwen Bianji, Edanz Group China (http://www.liwenbianji.cn/ac), for editing the English text of a draft of this manuscript.References
- D. Ye, L. Li, Z. Li, Y. Zhang, M. Li, J. Shi, L. Wang, C. Fan, J. Yu and X. Zuo, Nano Lett., 2019, 19, 369–374 CrossRef CAS PubMed.
- A. Kuzuya, R. Watanabe, Y. Yamanaka, T. Tamaki, M. Kaino and Y. Ohya, Sensors, 2014, 14, 19329–19335 CrossRef CAS PubMed.
- A. Kuzuya, M. Kaino, M. Hashizume, K. Matsumoto, T. Uehara, Y. Matsuo, H. Mitomo, K. Niikura, K. Ijiro and Y. Ohya, Polym. J., 2015, 47, 177–182 CrossRef CAS.
- R. Getts and S. Muro, Curr. Pharm. Des., 2016, 22, 1245 CrossRef CAS PubMed.
- Q. Jiang, S. Liu, J. Liu, Z.-G. Wang and B. Ding, Adv. Mater., 2019, 31, 1804785 CrossRef CAS PubMed.
- M. Cao, Y. Sun, M. Xiao, L. Li, X. Liu, H. Jin and H. Pei, Chem. Res. Chin. Univ., 2020, 36, 254–260 CrossRef CAS.
- X. Lu, J. Liu, X. Wu and B. Ding, Chem.–Asian J., 2019, 14, 2193 CrossRef CAS PubMed.
- Q. Zhang, Q. Jiang, N. Li, L. Dai, Q. Liu, L. Song, J. Wang, Y. Li, J. Tian, B. Ding and Y. Du, ACS Nano, 2014, 8, 6633–6643 CrossRef CAS PubMed.
- V. Linko, M. Eerikainen and M. A. Kostiainen, Chem. Commun., 2015, 51, 5351 RSC.
- Z. Ge, J. Fu, M. Liu, S. Jiang, A. Andreoni, X. Zuo, Y. Liu, H. Yan and C. Fan, ACS Appl. Mater. Interfaces, 2019, 11, 13881–13887 CrossRef CAS PubMed.
- L. Sun, Y. Gao, Y. Xu, J. Chao, H. Liu, L. Wang, D. Li and C. Fan, J. Am. Chem. Soc., 2017, 139, 17525–17532 CrossRef CAS PubMed.
- V. Linko, S. Nummelin, L. Aarnos, K. Tapio, J. J. Toppari and M. A. Kostiainen, Nanomaterials, 2016, 6, 139 CrossRef PubMed.
- A. Rajendran, E. Nakata, S. Nakano and T. Morii, ChemBioChem, 2017, 18, 696 CrossRef CAS PubMed.
- F. Zhang, J. Nangreave, Y. Liu and H. Yan, J. Am. Chem. Soc., 2014, 136, 11198–11211 CrossRef CAS PubMed.
- D. Han, S. Pal, Y. Liu and H. Yan, Nat. Nanotechnol., 2010, 5, 712–717 CrossRef CAS PubMed.
- K. Lund, A. Manzo, N. Dabby, N. Michelotti, A. Johnson-Buck, J. Nangreave, S. Taylor, R. Pei, M. N. Stojanovic, N. G. Walter, E. Winfree and H. Yan, Nature, 2010, 465, 206–210 CrossRef CAS PubMed.
- Y. Ke, L. L. Ong, W. Sun, J. Song, M. Dong, W. M. Shih and P. Yin, Nat. Chem., 2014, 6, 994–1002 CrossRef CAS PubMed.
- H. Shen, X. Lan, X. Lu, T. A. Meyer, W. Ni, Y. Ke and O. Wang, J. Am. Chem. Soc., 2016, 138, 1764–1767 CrossRef PubMed.
- Y. Ke, T. Meyer, W. M. Shih and G. Bellot, Nat. Commun., 2016, 7, 10935 CrossRef CAS PubMed.
- G. Tikhomirov, P. Petersen and L. Qian, Nature, 2017, 552, 67–71 CrossRef CAS PubMed.
- B. D. Cox, P. H. Woodworth, P. D. Wilkerson, M. F. Bertino and J. E. Reiner, J. Am. Chem. Soc., 2019, 141, 3792–3796 CrossRef CAS PubMed.
- K. Liu, C. Pan, A. Kuhn, A. P. Nievergelt, G. E. Fantner, O. Milenkovic and A. Radenovic, Nat. Commun., 2019, 10, 3 CrossRef CAS PubMed.
- E. Spruijt, S. E. Tusk and H. Bayley, Nat. Nanotechnol., 2018, 13, 739–745 CrossRef CAS PubMed.
- A. Suma and C. Micheletti, Proc. Natl. Acad. Sci. U. S. A., 2017, 114, E2991–E2997 CrossRef CAS PubMed.
- R. K. Sharma, I. Agrawal, L. Dai, P. S. Doyle and S. Garaj, Nat. Commun., 2019, 10, 4473 CrossRef PubMed.
- E. Krueger, J. Shim, A. Fathizadeh, A. N. Chang, B. Subei, K. M Yocham, P. H Davis, E. Graugnard, F. Khalili-Araghi, R. Bashir, D. Estrada and D. Fologea, ACS Nano, 2016, 10, 8910–8917 CrossRef CAS PubMed.
- S. W. Kowalczyk, M. W. Tuijtel, S. P. Donkers and C. Dekker, Nano Lett., 2010, 10, 1414–1420 CrossRef CAS PubMed.
- C. Plesa, N. Loo, P. Ketterer, H. Dietz and C. Dekker, Nano Lett., 2015, 15, 732–737 CrossRef CAS PubMed.
- K. Chen, M. Juhasz, F. Gularek, E. Weinhold, Y. Tian, U. F. Keyser and N. A. W. Bell, Nano Lett., 2017, 17, 5199–5205 CrossRef CAS PubMed.
- S. W. Kowalczyk, A. R. Hall and C. Dekker, Nano Lett., 2010, 10, 324–328 CrossRef CAS PubMed.
- J. S. Yu, M. C. Lim, D. T. N. Huynh, H. J. Kim, H. M. Kim, Y. R. Kim and K. B. Kim, ACS Nano, 2015, 9, 5289–5298 CrossRef CAS PubMed.
- J. Kong, N. A. W. Bell and U. F. Keyser, Nano Lett., 2016, 16, 3557–3562 CrossRef CAS PubMed.
- Z. Zhu, Y. Zhou, X. Xu, R. Wu, Y. Jin and B. Li, Anal. Chem., 2018, 90, 814–820 CrossRef CAS PubMed.
- R. Wu, Z. Zhu, X. Xu, C. Yu and B. Li, Nanoscale, 2019, 11, 10339 RSC.
- Z. Zhu, R. Wu and B. Li, Chem. Sci., 2019, 10, 1953 RSC.
- K. Chen, M. Juhasz, F. Gularek, E. Weinhold, Y. Tian, U. F. Keyser and N. A. W. Bell, Nano Lett., 2017, 17, 5199–5205 CrossRef CAS PubMed.
- N. A. W. Bell and U. F. Keyser, Nat. Nanotechnol., 2016, 11, 645–651 CrossRef CAS PubMed.
- V. Wang, N. Ermann and U. F. Keyser, Nano Lett., 2019, 19, 5661–5666 CrossRef CAS PubMed.
- M. W. Hudoba, Y. Luo, A. Zacharias, M. G. Poirier and C. E. Castro, ACS Nano, 2017, 11, 6566–6573 CrossRef CAS PubMed.
- L. Zhu, Y. Xu, I. Ali, L. Liu, H. Wu, Z. Lu and Q. Liu, ACS Appl. Mater. Interfaces, 2018, 10, 26555–26565 CrossRef CAS PubMed.
Footnotes |
| † Electronic supplementary information (ESI) available. See DOI: 10.1039/d1ra04267j |
| ‡ These authors contributed equally to the first author. |
| This journal is © The Royal Society of Chemistry 2021 |

