DOI:
10.1039/D1RA04441A
(Paper)
RSC Adv., 2021,
11, 28521-28529
Green route for ammonium nitrate synthesis: fertilizer for plant growth enhancement†
Received
8th June 2021
, Accepted 11th August 2021
First published on 23rd August 2021
Abstract
Soil fertility management is of great importance for farmers. The use of synthetic nitrogen (N)-fertilizer increased by 20 fold in the last 50 years to feed the increasingly hungry population. This study aims to enrich the plant soil with nitrogen content (NH4NO3 fertilizer in soil) using the low-temperature and low-pressure plasma [without H2 and catalyst]. Subsequently, we used plasma N-enriched soil for plant (radish and tomato) growth. We investigated the germination percentage, seedling growth, seedling weight, phytohormones and antioxidant activity of radish and tomato plants after treatment with plasma N-enriched soil and compared with control soil and soil + commercial N-fertilizer. The plasma N-enriched soil treatment results in significant growth enhancement for both radish and tomato plants. Further, substantial changes in phytohormone and antioxidant levels were observed for the plants grown in plasma N-enriched soil compared to control soil and soil + commercial N-fertilizer. The energy consumption (EC) for total N-fixation was 12 MJ mol−1. EC for ammonia and nitrate fixation was 17 and 41 MJ mol−1, respectively, without H2 gas. Further to understand the plasma chemistry, we performed 1D simulation using COMSOL Multiphysics® software. This study showed that direct N-fixation in the soil by plasma could be used as fertilizer for the plants and open a new window for future decentralized N-fertilizer production at the farm site.
Introduction
The hungry population's proportion significantly decreased in the last few years due to the increased food production rate.1 The world's population will reach 9.8 billion in 2050; under this scenario feeding the world's population requires a significant increase in agriculture production.2,3 Nitrogen fertilizer (N-fertilizer) consumption increased by 6.9 fold and phosphorus fertilizer by 3.5 fold to double agriculture products.4 Nitrogen is a primary component of plant cells, and if plants don't get the proper nitrogen, they cannot produce proteins.5 Nitrate (NO3−) is an important N source for all plants. At the micromolar concentration range, most plant species' roots prefer ammonium ion (NH4+) uptake over NO3−.6 Plants absorb the nitrogen from the soil, which creates an inadequate amount of nitrogen, and N-fertilizer replaces the used amount of nitrogen from the soil. Therefore, state-of-the-art agriculture technology is required as an efficient method for fertilization production, as current fertilizer production methods are the primary source of environmental damage.4,7 Currently, Haber–Bosch and Ostwald process is used to synthesize of ammonia (NH3) and nitric acid (HNO3), respectively.8 1–2% of the world's total energy production and ∼3–5% of the total natural gas output used for the Haber–Bosch process and release a high amount of CO2 into the atmosphere (1.5 kg CO2 per kg NH3).9–11 Thus, sustainable technology is required to synthesize the N-fertilizer.
The NH4+ and NO3− synthesis can be achieved by plasma technology.10 Plasma produces reactive species that can assist the N-fixation using renewable electricity.12 NH3 production using plasma driven by N2 with H2 (ref. 13) or H2O.14 Plasma-catalytic15 and plasma-electrochemical16 processes are used to produce the NH3, typically used N2/H2 gas, and pressure varies from low to atmospheric.13 For many years, a radiofrequency (RF) plasma reactor was used for N-fixation.17 Ben Yaala et al. used N2/H2 RF plasma at low-pressure for NH3 formation with and without tungsten or stainless steel surface.18 Shah et al. showed the production of NH3 using RF plasma at low-pressure with N2/H2 in the presence of catalyst.19 Later, the same group introduced the furnace to the RF plasma rector to control the gas temperature at 400 °C for NH3 production with catalyst, as plasma doesn't produce much heating at low-pressure (34 Pa).20 In the low-pressure RF plasma, the N2 splitting was mainly through dissociative adsorption of electronically excited N2 molecules and by direct electron dissociation reaction rather than vibrational excited N2 molecules, as reported in earlier study.21 Additionally, low-pressure assists the NH3 production as it maintains the low-temperature.21 Hence, low-pressure RF plasma is beneficial for NH4+ production. Therefore, in the present study, we used the low-pressure RF plasma to generate the NH4+ and NO3− or ammonium nitrate (NH4NO3) in the dead plant-soil (simply called “soil”) without the use of H2 and catalyst. Later, we used this plasma-treated dead plant soil (from hereafter, “plasma N-enriched soil”) to grow the radish and tomato plants. We compared shoots' germination percentage, growth, and weight with the control soil (without plasma treatment) and soil + commercial ammonium fertilizer. Additionally, we evaluated the changes in phytohormone, antioxidant (γ-tocopherol), and antioxidant activity in both plants after cultivation at different conditions. Finally, we explore the concentration and energy consumption (EC) for NH4+ and NO3− fixation in soil.
Results
Germination rate, seedling growth and weight of radish sprouts
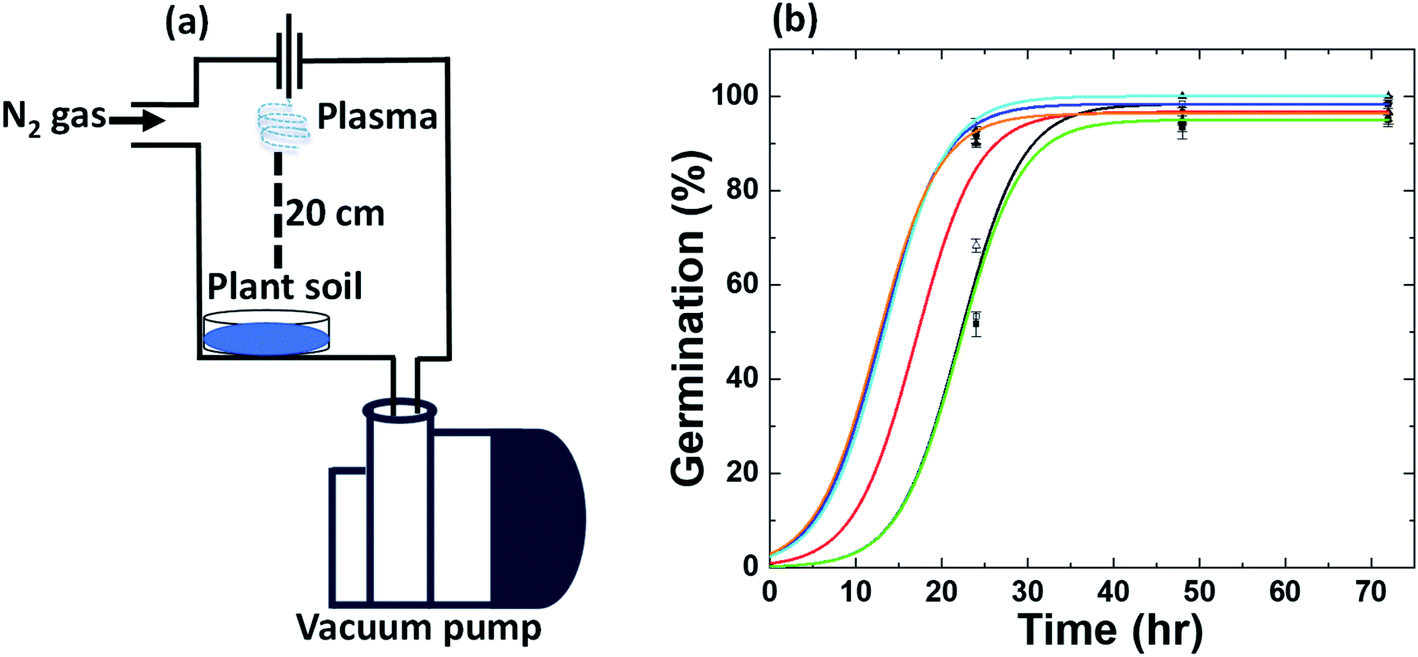
In the Material and methods section, we described RF plasma generation at low-pressure and soil treatment conditions. Briefly, 50 g of soil in a container without plant seeds were placed at a distance of 20 mm apart from the coil used to generate plasma, as shown in Fig. 1a. We recently reported that radish seeds were separated into two colors, brown and grey seeds; among them, brown seeds revealed 100% germination.22 We used brown radish seeds harvested in 2018, and the experiment was performed in 2020, to detect the optimal treatment time for N-fertilizer production. For this, we treated soil with plasma for 1, 3 and 5 min and harvest the radish seeds. We also used the commercial ammonia fertilizer (0.5 and 1 g) as positive control added to the 50 g soil for the comparison. Fig. 1b shows the germination kinetics, and maximal germination percentage for the radish seeds after incubation in control soil, plasma N-enriched soil, and commercial N-fertilizer treated soil. Fig. 1b shows the maximal germination percentage of 98% for radish seeds in control and 1 min plasma-treated soil. Whereas, maximal germination percentage of 97% was achieved for radish seeds in 0.5 g of commercial N-fertilizer treated soil and 5 min plasma-treated soil. On the other hand, 1 g of commercial N-fertilizer treated soil showed 95% germination, and 100% germination was attained in 3 min plasma-treated soil. 50% of radish seeds germinated in 13 h after imbibition in 3 min plasma-treated soil and 17 h in 0.5 g commercial N-fertilizer treated soil (see Fig. 1b). While 23 h was required for 50%, radish seed germination in 1 g commercial N-fertilizer treated soil and control soil (Fig. 1b).
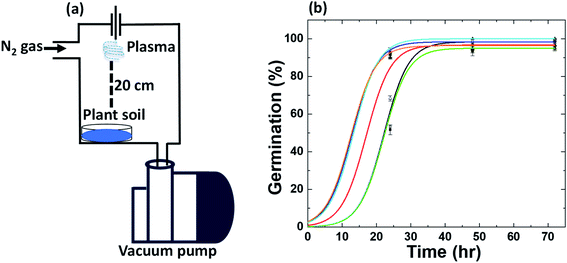 |
| | Fig. 1 (a) Schematic depiction of the plasma device and (b) germination kinetics of radish seeds. Control plant soil (black line), commercial fertilizer 0.5 g (red line) and 1 g (green line), and plasma-treated soil for 1 min (blue line), 3 min (cyan line) and 5 min (orange line). | |
Fig. 2a shows the changes in the shoot mean length of radish sprouts in different soil conditions. Plasma treated soil (1, 3 and 5 min) showed an improvement in the shoot growth. Mean shoot length was enhanced by 20% increase in plasma-treated soil (3 min) than control (p < 0.05). While the incubation of radish seeds in 1 and 5 min plasma-treated soil increased the mean shoot length by 2 and 12% than control, but they are statistically insignificant. Although, shoot length was reduced by 25% after incubation in 1 g of commercial N-fertilizer treated soil (p < 0.05). In contrast, shoot length increased by 12% for 0.5 g of commercial N-fertilizer treated soil (not statistically significant).
Later, we investigated the shoot mean weight of radish sprouts after different treatments (see Fig. 2b). No significant change was noticed for radish shoot mean weight for 1 min plasma-treated soil and control soil. Although, weight was increased significantly by 13% for 3 min plasma-treated soil (p < 0.05), and 4% increase for 5 min plasma-treated soil (statistically insignificant) than control. While a significant decrease in shoot weight of radish sprouts was observed for 1 g of commercial N-fertilizer treated soil (24%) than control (p < 0.0001). At the same time, 0.5 g of commercial N-fertilizer treated soil increased the shoot weight by 2.2%. These studies reflected that 3 min plasma-treated soil showed statistical improvement in radish sprouts germination and yield, while statistically decreases for 1 g of commercial N-fertilizer treated soil. Although the improvement in radish sprouts germination and yield was obtained for 0.5 g of commercial N-fertilizer treated soil. Therefore, we consider 3 min plasma and 0.5 g of commercial N-fertilizer treatments for further phytohormone and antioxidant experiments.
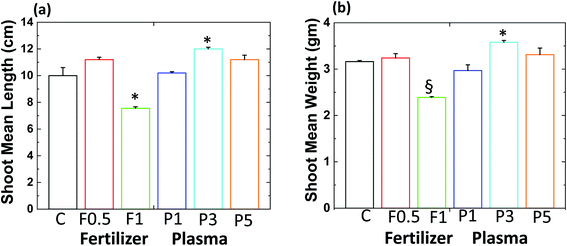 |
| | Fig. 2 (a) Average length and (b) average weight of radish shoots. Germinated in control soil (C), commercial fertilizer 0.5 g (F0.5), commercial fertilizer 1 g (F1), plasma-treated 1 min (P1), plasma-treated 3 min (P3) and, plasma-treated 5 min (P5) radish seeds. Results are presented as means ± SEM (n = 40).*Significantly different from the control group (p < 0.05). §Significantly different from the control group (p < 0.0001). | |
Phytohormones and antioxidant level, and antioxidant activity in the radish sprouts
We measured the amounts of thee phytohormones gibberellin A20 (GA20), gibberellin A3 (GA3), abscisic acid (ABA) (main phytohormones involved in seed germination23) and antioxidant γ-tocopherol (main form of vitamin E24) in the radish shoot. The results showed the ABA amount changes in all the systems, while GA20 and GA3 were not detected. A significant decrease (p < 0.0001) in the amount of ABA obtained for the 3 min plasma-treated soil around (25%) than in the control samples. A 15% decrease in ABA amount was obtained for 0.5 g of commercial N-fertilizer treated soil compared to control. Since ABA is a germination inhibitor,23 the observed stimulation of germination in 3 min plasma-treated soil [Fig. 3a] is in good agreement with changes in the amounts of phytohormones. Earlier studies mentioned that their correlation between decreases in ABA concentration increases in seed germination.22,25
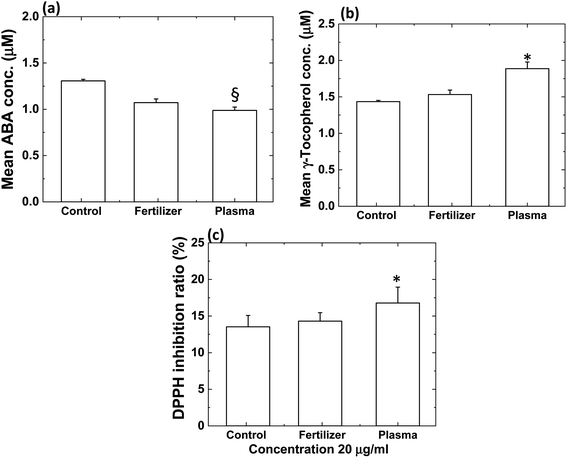 |
| | Fig. 3 (a) The amount of ABA, (b) amount of γ-tocopherol and (c) DPPH inhibition ratio (%) for radish sprout. Results are presented as means ± SEM (n = 40).*Significantly different from the control group (p < 0.05). §Significantly different from the control group (p < 0.0001). | |
The amount of γ-tocopherol in radish sprouts was higher than ABA amount [Fig. 3b]. The γ-tocopherol amount was approximately 7% higher in radish shoot for 0.5 g of commercial N-fertilizer treated soil than control [Fig. 3b]. However, the γ-tocopherol amount increased by 36% for 3 min plasma-treated soil with respect to control (p < 0.05). Thus, antioxidant γ-tocopherol concentration increases when radish seeds were grown in plasma-treated soil.
The high antioxidant level can relate to the high antioxidant activity, so we performed the DPPH (2,2-diphenyl-1-picryl-hydrazyl-hydrate) activity for all studied systems, as shown in Fig. 3c. We obtained a significant increase in DPPH activity by 24% for 3 min plasma-treated soil than control (p < 0.05). Whereas 6% increase in DPPH activity was obtained for 0.5 g of commercial N-fertilizer treated soil compared to control. These results reveal that both γ-tocopherol and antioxidant activity were higher for the plasma-treated system than the control and commercial N-fertilizer treated system.
To explore whether the effect of plasma-treated soil is not limited to the radish seeds, we studied the impact on tomato seeds.
Germination rate, seedling growth and weight of tomato plants
The experiment was performed in 2020; however, tomato seeds were stored at 277.15 K for one year (harvested in 2019). We used control plant soil, 3 min plasma-treated soil, and a 0.5 g commercial N-fertilizer treated soil for tomato experiments, as the above study showed positive responses for these conditions. The 100% maximal germination percentage for tomato seeds by control soil and 3 min plasma-treated soil was obtained, as shown in Fig. 4a. On the other hand, 93% maximal germination percentage showed for 0.5 g commercial N-fertilizer treated soil. Additionally, 50% seeds germinated in 33 h after imbibition in control soil and 54 h for 0.5 g commercial N-fertilizer treated soil. At the same time, 50% of seeds were grown in 31 h for 3 min plasma-treated soil (Fig. 4a). The seeds germinated faster for plasma N-enriched soil and least for commercial N-fertilizer treated soil; this trend is similar to radish seeds germination. We also observed the percentage of leaf expansion on tomato seedlings after 72 h in Fig. 4b. There was a significant 35% increase and 48% decrease in leaf expansion for tomato seeds after incubation in plasma N-enriched soil and commercial N-fertilizer treated soil compared to control after 72 h (p < 0.05).
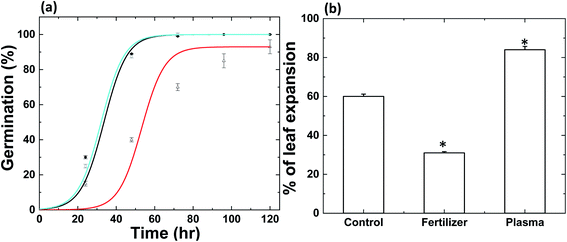 |
| | Fig. 4 (a) Germination kinetics and (b) percentage of leaf expansion on tomato plants after 72 h inhibition. Control plant soil (black line), commercial fertilizer 0.5 g (red line) and 3 min plasma-treated soil (cyan line). Results are presented as means ± SEM (n = 40).*Significantly different from the control group (p < 0.05). | |
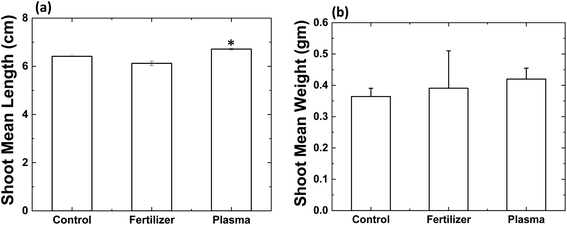
Fig. 5a shows the change in the shoot mean length after incubation plasma N-enriched soil and commercial N-fertilizer soil compared to control soil. Plasma N-enriched soil revealed improved tomato shoot growth by 5% (p < 0.05), and 0.5 g of commercial N-fertilizer treated soil showed decreased shoot length by 4% compared to control. Later, we investigated the shoot mean weight of tomato plants grown in the different treatment conditions (Fig. 5b). Shoot weight was increased significantly by 17% for 3 min plasma-treated soil and 8% for 0.5 g of commercial N-fertilizer treated soil than control soil. However, these increases in the mean shoot weight of tomato with plasma N-enriched soil and commercial N-fertilizer soil were not statistically significant than control soil. Later, we performed phytohormone and antioxidant analyses on the tomato plants.
 |
| | Fig. 5 (a) Average length and (b) average weight of tomato shoots. Results are presented as means ± SEM (n = 40).*Significantly different from the control group (p < 0.05). | |
Phytohormones and antioxidant level, and antioxidant activity of the tomato plants
The obtained results showed the change in the amount of ABA in tomato shoot, while GA20 and GA3 were not detected, similar to the radish shoot, see Fig. 6a. A significant increase in ABA amount was obtained for the 3 min plasma-treated soil, around 252% more than control and 400% higher than commercial N-fertilizer treated soil (p < 0.0001) [Fig. 6a]. Although, 29% decrease in ABA amount was obtained for 0.5 g of commercial N-fertilizer treated soil compared to control. Thompson et al. reported that the overproduction of ABA in tomatoes influences leaf expansion.26 That's maybe the reason for earlier leaf expansion in tomato plants for plasma N-enriched soil than other treated systems (as discussed above).
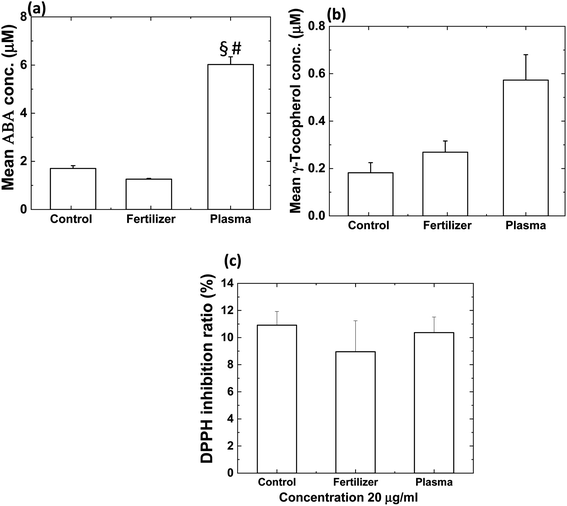 |
| | Fig. 6 (a) The amount of ABA, (b) amount of γ-tocopherol and (c) DPPH inhibition ratio (%) for tomato. Results are presented as means ± SEM (n = 40).*Significantly different from the control group (p < 0.05). §Significantly different from the control group (p < 0.0001). | |
The γ-tocopherol amount was approximately 280% and 119% higher in tomato shoot for 3 min plasma-treated soil than control and commercial N-fertilizer treated soil, respectively [Fig. 6b]. However, the γ-tocopherol amount increased by 44% for 0.5 g of commercial N-fertilizer treated soil compared to control. In contrast, DPPH activity results were not statistically significant between control and treated samples (commercial N-fertilizer and plasma N-enriched soil) [Fig. 6c]. For tomato shoot, change in antioxidant level (γ-tocopherol) and antioxidant activity was insignificant for commercial N-fertilizer and plasma N-enriched soil than control.
Discussion
The enrichment of plant soil by N-species (NH4+, NO2− and NO3−) using commercial fertilizer and plasma treatment, and later use this N-enriched soil for the growth of radish and tomato plants were investigated in the present study. We obtained that radish sprouts are grown in 3 min plasma-treated soil showed enhanced germination kinetics, germination percentage and weight of shoot than in control soil and commercial N-fertilizer treated soil. On the other hand, decrease in germination kinetics and the percentage for tomato seeds incubated in 0.5 g of commercial N-fertilizer treated soil than control and plasma-treated soil. The improved germination kinetics and mean shoot length were obtained for tomato seeds incubation in plasma-treated soil (3 min) than control soil. A significant change in ABA concentration was obtained for both plants when plant seeds were incubated in plasma N-enriched soil than control and commercial N-fertilizer. The antioxidant concentration (γ-tocopherol) and antioxidant activity were higher for plasma N-enriched soil than control soil and soil + commercial N-fertilizer for both plants.
Overall performance for both plants was better when seeds were incubated in plasma N-enriched soil than soil + commercial N-fertilizer. The question arises why plasma N-enriched treated soil was better than commercial N-fertilizer treated soil. To answer this question, we extracted the N-species from the soil treated with plasma and commercial N-fertilizer, as shown in Table 1. The NH4+ mass was increased by 0.0094 g in plasma-treated soil and 0.0156 g in commercial N-fertilizer than control (see Table 1). The NO3− mass was increased by 0.0136 g in plasma-treated soil and 0.0004 in commercial N-fertilizer than control (see Table 1). NO2− mass was increased by 0.0009 g in plasma-treated soil than control soil, as shown in Table 1. Although no increase in NO2− mass was not detected for soil + commercial N-fertilizer. Note that we have used the CaSO4 method to extract nitrogen species from the soil as described in the Material and methods section. This is a standard method to extract NO3− from the soil, as reported earlier.27 Therefore, the concentration of NH4+ and NO2− might be higher than we detected in this study. Some of the possible reaction results in the formation of NH4+, NO− and NO3− are given below, other reactions are shown in Table S1†
| | |
OH + H2O2 → H2O + HO2
| (4) |
| | |
NO2 + NO2− → NO3− + NO
| (10) |
| | |
NH3 + e → NH2+ + H + 2e
| (14) |
| | |
NH3 + NH2+ → NH + NH4+
| (15) |
Table 1 Change in the mass of reactive species in the plant soil after different treatment conditions
| |
Control soil |
Plasma N-enriched soil |
Soil + commercial fertilizer |
| NO2− (g) |
0.0001 |
0.0010 |
0.0001 |
| NO3− (g) |
0.0088 |
0.0224 |
0.0092 |
| NH4+ (g) |
0.0017 |
0.0111 |
0.0173 |
Further, we checked the possibility for CO2 production by reaction between the plasma and organic material of soil. Despite the fact that we didn't observe any increase in CO2 concentration during and after plasma treatment (might be concentration of CO2 is below the detection limit), but we are not omitting the possibility of CO2 emission. Hence, we will focus on this in future studies.
The excess NH4+ concentration in the commercial N-fertilizer treatment causes toxicity to plants, resulting in reduced germination kinetics and germination percentage compared to plasma N-enriched soil. According to the previous published work, the excess of NH4+ can cause intracellular pH disturbance, unidirectional ammonium flux, carbon imbalance, etc. to the plants.28 Conversely, plasma N-enriched soil provides the perfect ratio of NH4+, NO2− and NO3− required for plant growth.
To understand the change in the reactive species concentration generated in a plasma reactor, we developed 1D numerical model and performed the calculations using COMSOL Multiphysics®5.4 multipurpose simulation software. As shown in Fig. 1a and 7, the RF plasma was generated using a Cu-coil of length 5 cm, and then reactive species were diffused into the soil at a distance of 20 cm from the end of the plasma coil. In our 1D model, electron exit in the plasma coil region at a constant number density of 1013 m−3; therefore, electron impact dissociation, attachment, and electron impact neutralization are limited up to coil length (see Fig. 7). The reactive species are transported to the soil using a diffusion process along with some ion-molecule reactions, as shown in Fig. 7. We used one kind of nitrogen atom labelled N for simplification, irrespective of its initial electronic state. As our low-pressure plasma reactor worked at low power, we assumed 1 eV electron temperature, and 300 K gas temperature.
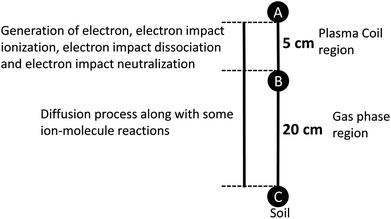 |
| | Fig. 7 1D-model for simulation. | |
In the simulation, we identified the concentration of N, OH, H, O, NO2, NO3, NO, NO3−, NO2−, NH3, NH4+, and H2O2. We have divided the concentration of reactive species into 6 categories like N, H, O, NOx, NHx and H2O2. NOx contains NO, NO2, NO3, NO2− and NO3−, NHx contains NH, NH3 and NH4+ species and H2O2. Table 2 shows the concentration of these reactive species at point C of Fig. 7 after 1000 s. Simulation results suggested that a high amount of N reacted to the soil surface compared to other studied species. Among all the NHx species, NH species showed the highest concentration and the least amount of NH3 (shown in Table S2†). In earlier work, it was reported that NH3 production was taking place by successive hydrogenation of absorbed N and N2 containing radicals are mainly occurred at the surface and wall of plasma reactor.21,29 The production of NH3 is the key species for NH4+ generation, as shown in Table S1.† The simulation results reveal that the formation of NH4+ is higher than NO3−, which supports the experimental results (Table S2†). Although the concentration of NH4+, NO2− and NO3− doesn't match the experimental data, that might be due to the absence of diffusion coefficient at low-pressure or other reasons (like, electron temperature, number density, etc.). The diffusion coefficient used in the simulation is in the air at 300 K, as reported in the previous reported work.30 Later, we measured the optical emission spectra to detect the reactive species generated in the gas phase. Fig. S1,† shows the N2 2nd positive system (C3Πu → B3Πg), N2 1st negative system (B2∑+u–X2∑+g), N2 1st positive system (B3Πg → A3∑+u), and atomic N (2p23p → 2p23s). Additionally, spectra show the peaks for γNO, OH, N, NH and Hα peaks. Simulation results also supports the production of NO, NH, N, H and OH reactive species.
Table 2 Concentration of reactive species at point C of 1D model (Fig. 7) after 1000 s simulation
| Reactive species |
Relative concentration (mol m−3) |
| N |
0.03 |
| H |
4.85 × 10⁻¹⁵ |
| O |
7.89 × 10⁻¹⁷ |
| NOx |
4.31 × 10⁻⁷ |
| NHx |
3.51 × 10⁻¹⁰ |
| H2O2 |
5.99 × 10⁻¹⁴ |
The experimental EC for total N-fixation (NH4+ + NO3−) was 12 MJ mol−1 (increase in NO2− concentration is negligible to contribute towards EC) with an input power of 50 W, and the calculation details were described in the ESI.† The EC for NH4+ and NO3− fixation was 17 and 41 MJ mol−1, respectively, without using H2 gas and catalyst for 3 min plasma treatment on 50 g plant soil with input power of 50 W (see ESI† for details). However, the total power consumed in operation (RF power supply + vacuum pump) was 600 W, resulting in EC for NH4+, NO3− and total N-fixation of 208, 419 and 145 MJ mol−1, respectively. We measured total power consumed in the system by watt monitor (TAP-TST8N, Sanwa Supply); Kuwahata et al.31 used a similar method to measure power.
Hachiya et al. reported that mixtures of NH4+ and NO3− are beneficial to plant growth compared to NH4+ or NO3− alone.32 Nevertheless, EC for ammonia production using a catalyst with N2 and H2 gases varies from 2–600 MJ mol−1,12,33 and NOx EC with and without catalyst ranges 0.3–1600 MJ mol−1.34 Kim et al. synthesized the NOx (NO and NO2) using N2–O2 mixture using microwave plasma. The maximum NO produced at equilibrium was 0.66 × 10¹⁶ NO molecules per J and 15.36 × 10¹⁶ NO2 molecules per J.35 Mutel et al. synthesized the NO using N2–O2 gas mixture through microwave plasma at 6600 Pa in the presence of the catalyst, and the energy cost of this system was 0.084 MJ mol−1 NO.36 In another study, NO was produced with microwave plasma at reduced pressure in a magnetic field, and the energy cost was 0.30 MJ mol−1 NO.37 Our system's EC value for total N-fixation in the soil was 145 MJ mol−1 without H2 gases and catalyst; nevertheless, EC value for commercial NH4NO3 is around 20.76 GJ mt−1.38 Even though the EC value of our reactor is higher than the commercially available methods, but our process is more environment friendly than current technology.
Conclusion
This study concluded that the plasma generated NH4NO3 fertilizer in soil accelerates the radish and tomato germination process by changes in plants' biochemical components. On the other hand, commercial N-fertilizer treatment decreases the germination kinetics of plants and, in some cases, germination percentage. Additionally, we observed that plasma-treated soil strongly influenced the ABA phytohormone and γ-tocopherol antioxidant, resulting in high antioxidant activity for plants grown on plasma-treated soil. Our system's EC value for total N-fixation in the soil was 145 MJ mol−1 without H2 gas and catalyst. This study showed the direct N-fixation in the plant soil by plasma, opening a new window for decentralizing fertilizer production at the farm site.
Material and methods
Experimental setup
Low-pressure RF plasma was installed in the glass chamber, as shown in Fig. 1a. The diameter and height of the glass chamber were 37 and 25 cm, respectively. The plasma was ignited using an RF power supply of frequency 145 MHz and DC power source. 3-pairs of Cu rings as RF-coils connected to the power supply. The typical reaction pressure was 200 Pa. The EC calculations were performed based on the published articles,39,40 the input power was 50 W, and total power consumed by our reactor (RF power supply + vacuum pump) was 600 W. The detailed calculation was shown in the ESI.† The total power consumed in the system was evaluated using a watt monitor (TAP-TST8N, Sanwa Supply). The purity of N2 gas was 99.996%, and it contains O2 and H2O ≤5%. Before the plasma ignition, N2 gas flows into the chamber for 10 min at a rate of 4 SLM, while during plasma ignition, 0.10 SLM gas inflowing to the system.
Plant soil treatment and germination
We used a low-pressure RF plasma device to treat dead plant soil (simply called soil) that contains 1.1 wt% nitrogen, 0.3 wt% phosphoric acid, 0.2 wt% potassium, and 63.8 wt% moisture purchased from Green-Kita-Kyu Co., Japan. The radish (Raphanus sativus L.) sprout seeds (harvest year 2018) were bought from Nakahara Seed Co., Japan and tomato seeds (Solanum lycopersicum L.) (harvest year 2019) were purchased from Sakata Seed Co., Japan. The commercial N-fertilizer brought from Sun and Hope Co., Japan, contains 8.0 wt% ammonia, water-soluble phosphoric acid (6.5 wt%), and potassium (8.0 wt%). For control soil, plasma N-enriched soil and soil + commercial N-fertilizer (commercial N-fertilizer treated soil) (6 replicates × 6 conditions × 40 seeds = 1440 seeds in total) were used for experiments. 50 g of soil were treated in a container at 20 cm from the plasma source for the different time intervals. After treatment, the seeds (radish and tomato) were placed on the soil container for germination, as shown in Fig. S2 and S3.† The commercial N-fertilizer was spread on the container, as shown in Fig. S2 and S3.† The container with seeds were kept in the light incubator for 84 h (radish seeds) and 132 h (tomato seeds) at 298 K. The number of germinated radish seeds was counted 4 times (24, 48, 60, and 72 h after imbibition), and 6 times counted for tomato seeds (24, 48, 60, 72, 96, 120 and 132 h after imbibition). The morphometric analysis of radish and tomato was performed, measuring the shoots' length for all experimental groups (roots are completely mixed with the soil, so it was hard to count and separate). The statistical analysis was performed using Student's t-test.
Sample preparation for mass spectrometry and antioxidant activity
Equal weight of dry shoots was added in the 2 mL round bottom tube with a stainless bead and pulverized at 2600 rpm for 3 min. Further, add the methanol (99.9%) to the 2 mL round bottom tube and kept for 24 h at 277.15 K, and the obtained suspension was centrifuged (Eppendorf centrifuge 5430 R) at 3000 rpm at 277.15 K for 5 min. The supernatant was transferred into the tube, filtered using 0.22 μm filter, and centrifuged again at 277.15 K for 5 min. The obtained supernatant was used for mass spectrometry analysis and antioxidant activity.
Mass spectrometry
Mass spectrometry measurement was performed with LC (Agilent; G7116A) and triple quadrupole mass spectrometer (Agilent; G6470A). A 4.6 × 100 mm i.d. Zorbax column (Agilent; XFB-C18) was used at a 1 mL min−1 flow rate. The LC gradient was methanol in 5 mM ammonia acetate/H2O as follows: 20 to 100% in 5 min. Conditions for MS/MS analysis of each LC peak included a capillary voltage of 4000 V, nozzle voltage of 500 V, a nebulizing pressure of 45 psi, and the sheath gas temperature at 648 K with 11 L min−1 of low rate.
DPPH antioxidant activity
Using the supernatant as described in the sample preparation method, we analyzed the DPPH inhibition ratio (%) as per protocol provided in the assay kit (purchased from Dojindo laboratories Japan).
N-extraction from plant soil and CO2 detection
Calcium sulphate was used to extract nitrogen from the soil, as described previously.27 Briefly, mix the 7 g of CaSO4 with 2 L of DI water at 293.15 K for 2 h. Add 200 mL of CaSO4 solution to the bottle containing 50 g of dried soil, and shake it for 15 min at 298.15 K. Later, filter it and measure the reactive species using filtrate. This method mainly extracts NO3−-nitrogen from the soil; however, we measured NH4+ and NO2− from the same CaSO4 solution. We used NO2/NO3 assay kit from Dojindo laboratories Japan and NH4+ from the ammonia assay kit-modified Berthelot from Abcam company. The standard curve of NH4+, NO2− and NO2− + NO3− is shown in Fig. S4.† To detect the CO2 in the plasma reactor, we used the Gastec gas detection tubes.
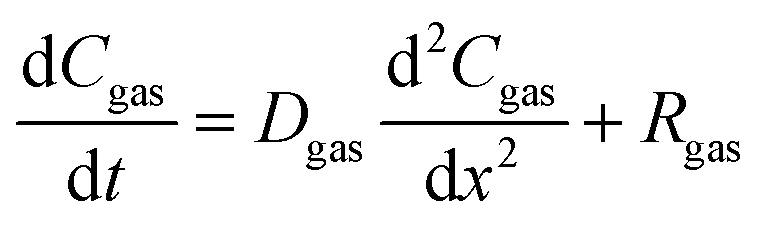
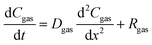
1D model
The 1D model was illustrated in Fig. 7, electron exit in the plasma coil region at a constant number density of 1013 m−3. We consider the particle distribution only in the x-direction, normal to the surface of the process soil. The time variation of the particle concentration Cgas in the gas phase can be represented as follows:| |
 | (16) |
where Dgas is the diffusion coefficient of the gas-phase particles. We assumed the electron temperature 1 eV and gas temperature 300 K based on previous work.29,41,42 0.10 and 0.05 fractions of H2O (humidity in the soil and gas impurity) and O2 (impurity), respectively used as an impurity in the simulation. The coefficient value of 10−5 m2 s−1 for the species not mentioned in the earlier article,30 a typical value for all particles. Rgas is a generation or extinction (recombination) term depending on the gas-phase reaction in Table S1.† The simulation is performed for 1000 s, as diffusion in the simulation is independent of the low-pressure. The reaction pathways and rate constants were compiled from the literature as described in Table S1.†
Conflicts of interest
The authors declare no conflict of interest.
Acknowledgements
This work is supported by Adaptable and Seamless Technology transfer Program through Target-driven R&D (A-STEP) from Japan Science and Technology Agency (JST) Grant Number JPMJTR20RU and R3QR Program (Qdai-jump Research Program) 01257. Additionally, partly supported by JSPS-KAKENHI grant numbers 20K14454, 20H01893, and 19H05462, Plasma Bio Consortium, Center for Low-temperature Plasma Sciences, Nagoya University, and the Naito Science & Engineering Foundation.
References
- H. C. J. Godfray, J. R. Beddington, I. R. Crute, L. Haddad, D. Lawrence, J. F. Muir, J. Pretty, S. Robinson, S. M. Thomas and C. Toulmin, Science, 2010, 327, 812–818 CrossRef CAS PubMed.
- K. Hasler, H.-W. Olfs, O. Omta and S. Bröring, Sustainability, 2017, 9, 2216 CrossRef.
- P. Hazell and S. Wood, Philos. Trans. R. Soc., B, 2008, 363, 495–515 CrossRef PubMed.
- K. M. A. Rahman and D. Zhang, Sustainability, 2018, 10, 759 CrossRef.
- C. P. Chanway, R. Anand and H. Yang, in Advances in Biology and Ecology of Nitrogen Fixation, InTech, 2014 Search PubMed.
- S. Gazzarrini, L. Lejay, A. Gojon, O. Ninnemann, W. B. Frommer and N. von Wiren, Plant Cell, 1999, 11, 937 CrossRef CAS PubMed.
- D. Tilman, K. G. Cassman, P. A. Matson, R. Naylor and S. Polasky, Nature, 2002, 418, 671–677 CrossRef CAS PubMed.
- G. J. Leigh, in Catalysts for Nitrogen Fixation, Springer Netherlands, Dordrecht, 2004, pp. 33–54 Search PubMed.
- R. R. Schrock, Proc. Natl. Acad. Sci., 2006, 103, 17087 CrossRef CAS PubMed.
- B. S. Patil, Q. Wang, V. Hessel and J. Lang, Catal. Today, 2015, 256, 49–66 CrossRef CAS.
- P. H. Pfromm, J. Renewable Sustainable Energy, 2017, 9, 034702 CrossRef.
- A. Bogaerts and E. C. Neyts, ACS Energy Lett., 2018, 3, 1013–1027 CrossRef CAS.
- P. Peng, P. Chen, C. Schiappacasse, N. Zhou, E. Anderson, D. Chen, J. Liu, Y. Cheng, R. Hatzenbeller, M. Addy, Y. Zhang, Y. Liu and R. Ruan, J. Cleaner Prod., 2018, 177, 597–609 CrossRef CAS.
- T. Sakakura, N. Murakami, Y. Takatsuji, M. Morimoto and T. Haruyama, ChemPhysChem, 2019, 20, 1467–1474 CAS.
- M. L. Carreon, J. Phys. D: Appl. Phys., 2019, 52, 483001 CrossRef CAS.
- J. Sun, D. Alam, R. Daiyan, H. Masood, T. Zhang, R. Zhou, P. J. Cullen, E. C. Lovell, A. Jalili and R. Amal, Energy Environ. Sci., 2021, 14, 865–872 RSC.
- K. H. R. Rouwenhorst, Y. Engelmann, K. van 't Veer, R. S. Postma, A. Bogaerts and L. Lefferts, Green Chem., 2020, 22, 6258–6287 RSC.
- M. Ben Yaala, D.-F. Scherrer, A. Saeedi, L. Moser, K. Soni, R. Steiner, G. De Temmerman, M. Oberkofler, L. Marot and E. Meyer, Nucl. Fusion, 2020, 60, 016026 CrossRef CAS.
- J. Shah, T. Wu, J. Lucero, M. A. Carreon and M. L. Carreon, ACS Sustainable Chem. Eng., 2019, 7, 377–383 CrossRef CAS.
- J. Shah, F. Gorky, P. Psarras, B. Seong, D. A. Gómez-Gualdrón and M. L. Carreon, ChemCatChem, 2020, 12, 1200–1211 CrossRef CAS.
- J. Shah, W. Wang, A. Bogaerts and M. L. Carreon, ACS Appl. Energy Mater., 2018, 1, 4824–4839 CrossRef CAS.
- P. Attri, K. Ishikawa, T. Okumura, K. Koga, M. Shiratani and V. Mildaziene, Sci. Rep., 2021, 11, 2539 CrossRef CAS PubMed.
- K. Shu, X. D. Liu, Q. Xie and Z. H. He, Mol. Plant, 2016, 9, 34–45 CrossRef CAS PubMed.
- S. E. Sattler, L. U. Gilliland, M. Magallanes-Lundback, M. Pollard and D. DellaPenna, Plant Cell, 2004, 16, 1419–1432 CrossRef CAS PubMed.
- L. Degutytė-Fomins, G. Paužaitė, R. Žūkienė, V. Mildažienė, K. Koga and M. Shiratani, Jpn. J. Appl. Phys., 2020, 59, SH1001 CrossRef.
- A. J. Thompson, J. Andrews, B. J. Mulholland, J. M. T. McKee, H. W. Hilton, J. S. Horridge, G. D. Farquhar, R. C. Smeeton, I. R. A. Smillie, C. R. Black and I. B. Taylor, Plant Physiol., 2007, 143, 1905–1917 CrossRef CAS PubMed.
- Soil and Plant Analysis Council., Soil Analysis Handbook of Reference Methods, St. Lucie Press, 2018 Search PubMed.
- Y. Liu, N. Lai, K. Gao, F. Chen, L. Yuan and G. Mi, PLoS One, 2013, 8, e61031 CrossRef CAS PubMed.
- E. Carrasco, M. Jiménez-Redondo, I. Tanarro and V. J. Herrero, Phys. Chem. Chem. Phys., 2011, 13, 19561 RSC.
- Y. Sakiyama, D. B. Graves, H. W. Chang, T. Shimizu and G. E. Morfill, J. Phys. D: Appl. Phys., 2012, 45, 425201 CrossRef.
- H. Kuwahata, D. Sato, Y. Kezuka and Y. Oda, Jpn. J. Appl. Phys., 2020, 59, SAAB06 CrossRef CAS.
- T. Hachiya and H. Sakakibara, J. Exp. Bot., 2017, 68, 2501–2512 CAS.
- H.-H. Kim, Y. Teramoto, A. Ogata, H. Takagi and T. Nanba, Plasma Process. Polym., 2017, 14, 1600157 CrossRef.
- L. Hollevoet, F. Jardali, Y. Gorbanev, J. Creel, A. Bogaerts and J. A. Martens, Angew. Chem., Int. Ed., 2020, 59, 23825–23829 CrossRef CAS PubMed.
- T. Kim, S. Song, J. Kim and R. Iwasaki, Jpn. J. Appl. Phys., 2010, 49, 126201 CrossRef.
- B. Mutel, O. Dessaux and P. Goudmand, Rev. Phys. Appl., 1984, 19, 461–464 CrossRef CAS.
- A. Asisov, R. I. Givotov, V. K. Rusanov and V. D. Fridman, Sov. Phys., 1980, 14, 366 Search PubMed.
- Energy in synthetic fertilizers and pesticides: Revisited, final project report, technical report, OSTI.GOV, https://www.osti.gov/biblio/10120269, accessed 26 February 2021 Search PubMed.
- Y. Gorbanev, E. Vervloessem, A. Nikiforov and A. Bogaerts, ACS Sustainable Chem. Eng., 2020, 8, 2996–3004 CrossRef CAS.
- E. Vervloessem, M. Aghaei, F. Jardali, N. Hafezkhiabani and A. Bogaerts, ACS Sustainable Chem. Eng., 2020, 8, 9711–9720 CrossRef CAS.
- I. S. Abdullin, V. S. Zheltukhin and N. F. Kashapov, Kazan Fed. Univ., Kazan, Russ, 2007.
- A. Chatain, M. Jimenez-Redondo, L. Vettier, O. Guaitella, N. Carrasco, L. L. Alves, L. Marques and G. Cernogora, Plasma Sources Sci. Technol., 2020, 29, 085019 CrossRef CAS.
Footnote |
| † Electronic supplementary information (ESI) available. See DOI: 10.1039/d1ra04441a |
|
| This journal is © The Royal Society of Chemistry 2021 |
Click here to see how this site uses Cookies. View our privacy policy here. 
 Open Access Article
 This Open Access Article is licensed under a Creative Commons Attribution-Non Commercial 3.0 Unported Licence
 *ab,
Kazunori Koga
*ab,
Kazunori Koga