 Open Access Article
Creative Commons Attribution 3.0 Unported Licence
Catechin or quercetin guests in an intrinsically microporous polyamine (PIM-EA-TB) host: accumulation, reactivity, and release
Lina Wanga,
Richard Malpass-Evansb,
Mariolino Carta c,
Neil B. McKeown
 b,
Shaun B. Reekstingd and
Frank Marken
 *a
*a
aDepartment of Chemistry, University of Bath, Claverton Down, Bath BA2 7AY, UK. E-mail: f.marken@bath.ac.uk
bEaStCHEM, School of Chemistry, University of Edinburgh, Joseph Black Building, David Brewster Road, Edinburgh, Scotland EH9 3JF, UK
cDepartment of Chemistry, Swansea University, College of Science, Grove Building, Singleton Park, Swansea SA2 8PP, UK
dUniversity of Bath, Materials & Chemical Characterisation Facility, MC2, Bath BA2 7AY, UK
First published on 12th August 2021
Abstract
Microporous polymer materials based on molecularly “stiff” structures provide intrinsic microporosity, typical micropore sizes of 0.5 nm to 1.5 nm, and the ability to bind guest species. The polyamine PIM-EA-TB contains abundant tertiary amine sites to interact via hydrogen bonding to guest species in micropores. Here, quercetin and catechin are demonstrated to bind and accumulate into PIM-EA-TB. Voltammetric data suggest apparent Langmuirian binding constants for catechin of 550 (±50) × 103 M−1 in acidic solution at pH 2 (PIM-EA-TB is protonated) and 130 (±13) × 103 M−1 in neutral solution at pH 6 (PIM-EA-TB is not protonated). The binding capacity is typically 1![[thin space (1/6-em)]](https://www.rsc.org/images/entities/char_2009.gif) :
:![[thin space (1/6-em)]](https://www.rsc.org/images/entities/char_2009.gif) 1 (guest
1 (guest![[thin space (1/6-em)]](https://www.rsc.org/images/entities/char_2009.gif) :
:![[thin space (1/6-em)]](https://www.rsc.org/images/entities/char_2009.gif) host polymer repeat unit), but higher loadings are readily achieved by host/guest co-deposition from tetrahydrofuran solution. In the rigid polymer environment, bound ortho-quinol guest species exhibit 2-electron 2-proton redox transformation to the corresponding quinones, but only in a thin mono-layer film close to the electrode surface. Release of guest molecules occurs depending on the level of loading and on the type of guest either spontaneously or with electrochemical stimuli.
host polymer repeat unit), but higher loadings are readily achieved by host/guest co-deposition from tetrahydrofuran solution. In the rigid polymer environment, bound ortho-quinol guest species exhibit 2-electron 2-proton redox transformation to the corresponding quinones, but only in a thin mono-layer film close to the electrode surface. Release of guest molecules occurs depending on the level of loading and on the type of guest either spontaneously or with electrochemical stimuli.
1. Introduction
Binding and release of guest species in microporous environments are important in selective recovery of valuable species from waste or the environment,1 in analysis/chromatography or in mass spectroscopy,2 but also for selective binding and release of drugs in medical applications.3 The effects of hydrogen bonding of a guest to a microporous host play an important role in modifying host–guest interactions and in pH-modulated accumulation and release processes.4 Here, polyamines of intrinsic microporosity are considered as hosts with rigid nanochannels to allow spontaneous accumulation and release of herbal drugs with high efficiency.Polymers of Intrinsic Microporosity (or PIMs) have emerged as a new class of processable microporous materials5–7 with molecular-sized voids and binding sites controlled by a rigid and contorted molecular backbone. Microporous film deposits are readily formed by solution casting. Applications of PIMs have emerged for example in the separation of gaseous species,8 in gas sensing,9 but also in condensed phase systems, for example in electrochemistry10,11 A prototypical PIM is the polyamine PIM-EA-TB (see molecular structure in Fig. 1) with a highly contorted and rigid backbone without any rotational freedom in single bonds, a typical molecular weight of 70 kDa, and poor packing in the solid state resulting in good solubility and processability. The internal surface area is typically 1000 m2 g−1 (based on Brunauer–Emmett–Teller analysis of nitrogen adsorption measurements12) and dominant pore sizes are typically in the range from 0.5 nm to 1.5 nm.
 | ||
| Fig. 1 Molecular structures for PIM-EA-TB (monomeric unit m.w. 286 g mol−1), for the flavanol catechin (m.w. 290 g mol−1), and for the flavonol quercetin (m.w. 304 g mol−1). | ||
The presence of the tertiary amine functional groups in the Tröger's base (TB) structural units of PIM-EA-TB provides sites for protonation, which occurs at approximately pH 4 in aqueous environments.13 At solution pH values higher than 4, hydrogen bonding to these amine functional groups has been observed previously for Fe(CN)63− and Fe(CN)64− guest species14 and for caffeic acid.15 For many weakly acidic guest species, hydrogen bonding to the tertiary amine in the polymer backbone is likely to contribute to the strength of host–guest interactions and thereby likely to contribute to the rate of transport processes within PIM-EA-TB.
The binding and release of catechin and quercetin, two natural ortho-quinols, into/from PIM-EA-TB is investigated. Catechin is a natural flavanol and a component in herbal teas16,17 and in wine.18 For both herbal catechin19 and quercetin20 urease inhibitor effectiveness have been reported for medical applications. The electrochemistry of catechin has been carefully studied21 and shown to be linked to anti-oxidant characteristics22 and superoxide radical quenching.23 The formation of electrocatalytically active catechin films on glassy carbon (by electro-polymerisation) has been observed.24 The first deprotonation of catechin has been reported to occur at pKa = 8.7.25 Quercetin appears to be slightly more acidic with an approximate pKa = 7.1,26 less soluble in aqueous media, but redox-chemically very closely related to catechin. Both are ortho-quinols. Electrochemical properties of quercetin have been reported27,28 and the electrochemical detection of quercetin on carbon electrodes modified with nano-materials.29 Quercetin exhibits anti-oxidant properties with links to medicinal applications,30 and has been bound into microporous metal–organic framework ZIF-90 (ref. 31) and into chitosan32 or β-cyclodextrins.33 The release of quercetin from natural hydrogels has been studied for medicinal uses.34 Both catechin and quercetin contain ortho-quinol moieties and have been shown to form quinol-based metal complexes.35
In this report, voltammetric experiments are employed to explore the accumulation and reactivity of catechin and quercetin in PIM-EA-TB. The uptake of catechin or quercetin from aqueous solution is demonstrated to reach a limit close to that expected for one catechin binding to each PIM-EA-TB monomer repeat unit. Simply mixing in tetrahydrofuran (THF) solution and codeposition onto glassy carbon electrodes is demonstrated to yield the same type of deposits with the option to make films with a much higher loading. Effects of guest loading and of pH on binding and on release are reported.
2. Experimental
2.1. Chemical reagents
Catechin (≥98%, HPLC), quercetin (≥95%, HPLC), chloroform (≥99.8%), carbon (glassy, spherical powder, 2–12 μm, 99.5% trace metals basis) and phosphoric acid (85 wt%) were purchased form Sigma Aldrich. Sodium hydroxide (≥97%) and tetrahydrofuran (THF, ≥99.8%) were products of Fisher Chemical. PIM-EA-TB was synthesised following the literature method.12 Ultra-pure water (resistivity 18.2 MΩ cm at 20 °C) from a Thermo Scientific water purification apparatus was used to make aqueous solutions.2.2. Instrumentation
Electrochemical tests were carried out with a potentiostat (Metrohm μAutolab II). Three-electrode measurements have been employed in which glassy carbon disk electrode (Ø 3 mm), Pt wire, and KCl-saturated calomel electrode (SCE, Radiometer REF 401) acted as the working electrode, counter electrode, and reference electrode, respectively. Phosphoric acid solution and solid sodium hydroxide were introduced to make phosphate buffer solutions with different pH values monitored with a pH meter (Jenway 3505). Qualitative and quantitative analysis of the catechin and quercetin release experiments was accomplished with liquid chromatography-mass spectroscopy (LC-MS) technique employing an Agilent 6545 Accurate-Mass Q-TOF LC/MS system. Scanning electron microscopy (SEM) images were captured with JEOL JSM-6301F FESEM equipment.2.3. Procedures
![[thin space (1/6-em)]](https://www.rsc.org/images/entities/char_2009.gif) :
:![[thin space (1/6-em)]](https://www.rsc.org/images/entities/char_2009.gif) 1. Then 4 μL of the mixture solution was coated on a 3 mm diameter glassy carbon disk electrode, evaporated under natural condition, and ready for electrochemical performance evaluation in 0.1 M phosphate buffer solution. To enhance the surface area and currents for catechin immobilised in PIM-EA-TB, in some experiments carbon microspheres were introduced. A solution of 7.5 mg mL−1 PIM-EA-TB and 180 mg mL−1 carbon spheres in THF was prepared. Then an amount of 2 μL of the solution was deposited onto a glassy carbon electrode. The electrode was immersed into 5 μM catechin in 0.1 M PBS (pH 2) buffer overnight. For comparison, the same procedure was carried out without carbon spheres.
1. Then 4 μL of the mixture solution was coated on a 3 mm diameter glassy carbon disk electrode, evaporated under natural condition, and ready for electrochemical performance evaluation in 0.1 M phosphate buffer solution. To enhance the surface area and currents for catechin immobilised in PIM-EA-TB, in some experiments carbon microspheres were introduced. A solution of 7.5 mg mL−1 PIM-EA-TB and 180 mg mL−1 carbon spheres in THF was prepared. Then an amount of 2 μL of the solution was deposited onto a glassy carbon electrode. The electrode was immersed into 5 μM catechin in 0.1 M PBS (pH 2) buffer overnight. For comparison, the same procedure was carried out without carbon spheres.3. Results and discussion
3.1. Catechin immobilisation by absorption into PIM-EA-TB
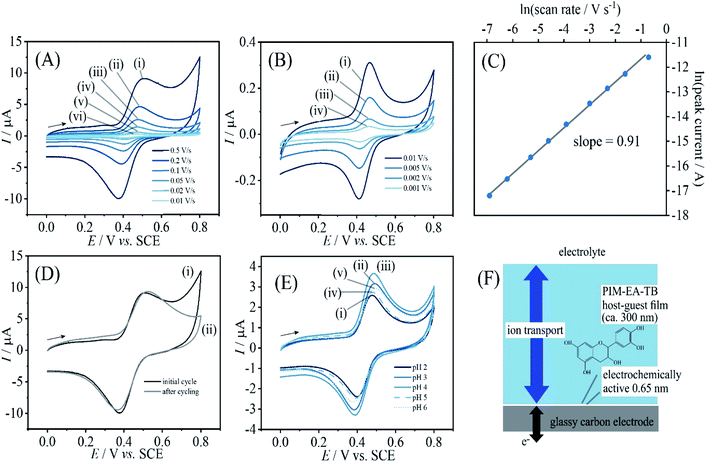
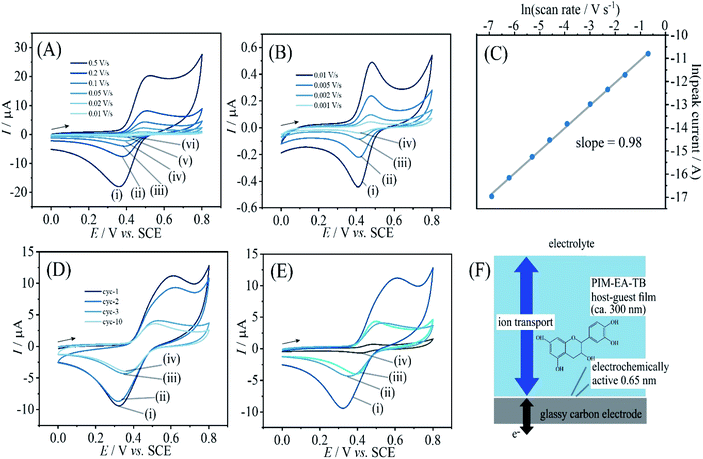
When coating a 3 mm diameter glassy carbon disk electrode with 2 μL of a solution of 1 mg mL−1 PIM-EA-TB, an amount of 2 μg or an in average 0.3 μm thick polymer film (assuming a density of approx. 1 g cm−3) was deposited. This coated electrode was then immersed into 0.1 mM catechin in 0.1 M phosphate buffer at pH 2 and left overnight (approx. 12 h) in a fridge. After rinsing with water, the electrode is employed in voltammetry experiments in 0.1 M phosphate buffer solution at pH 2. Fig. 2A and B show data from cyclic voltammetry experiments with varying potential scan rates. A well-defined oxidation–back-reduction process is observed with a midpoint potential Emid = ½(Ep,ox + Ep,red) = 0.46 V vs. SCE. This is consistent with literature reports for the ortho-quinol to ortho-quinone 2-electron 2-proton process for catechin21 (eqn (1)).
 | (1) |
Fig. 2D demonstrates that this redox process is detected as a stable signal even after a prolonged sequence of voltammetry experiments. When varying the potential scan rate, the peak currents scale approximately linearly with scan rate (see Fig. 2C) indicative of an immobilised redox system without significant effects from diffusion on the peak shape.
Given that the peak current remains linearly related to the scan rate, it is interesting to evaluate the charge under the oxidation peak, which is here close to Qp = 3 μC. This amount of charge corresponds to a number of 1013 catechin molecules or correspondingly 1013 PIM-EA-TB monomer units (assuming one-to-one hydrogen bonding interactions). Assuming an approximate PIM-EA-TB film density of 1 g cm−3, this amounts to a volume of 4.5 × 10⁻⁹ cm3 or an average thickness over the 3 mm diameter disk electrode of only 0.65 nm. This is evidence for only a monolayer of catechin molecules (within tunnel distance to the electrode; Fig. 2F) undergoing oxidation and reduction without significant propagation of charges into the bulk PIM-EA-TB film. The microporous polymer structure is too rigid to allow molecular transport/exchange for catechin on the time scale of the cyclic voltammetry experiment. Hydrogen bonds to the tertiary amine are likely to stay intact during oxidation and back-reduction of catechin although significant pH changes locally in the micropores are likely.
In order to explore effects from pH during the catechin immobilisation process, voltammetric data were obtained at pH 2 but for catechin immobilisation at pH 2, 3, 4, 5, 6, and 7 (see Fig. 2E). Perhaps surprisingly, the variation in voltammetric behaviour is very minor. A slight increase in peak current at pH 4 could be linked to higher mobility of catechin in the micropore channels of the partially protonated PIM-EA-TB host, but this is only a tentative conclusion. In order to formally express the processes during immobilisation of catechin as a function of pH equations can be suggested. The protonation of PIM-EA-TB for example in the presence of aqueous phosphate buffer is shown in eqn (2). The equilibrium constant KA ≈ 10![[thin space (1/6-em)]](https://www.rsc.org/images/entities/char_2009.gif) 000 M−1 is associated with an approximate pKa of 4 under these conditions.36
000 M−1 is associated with an approximate pKa of 4 under these conditions.36
 | (2) |
In a solution with pH > 4, the tertiary amine functional groups in PIM-EA-TB are predominantly neutral and able to bind to protons from weakly acidic guests. Catechin has a pKa of approximately 8.7 (ref. 25) and will therefore bind via hydrogen bond as shown in eqn (3).
 | (3) |
In a solution with pH < 4, the tertiary amine functional groups of PIM-EA-TB are predominantly protonated and the catechin binding process is more appropriately described as an exchange reaction in which the aqueous acid is liberated (see eqn (4)).
 | (4) |
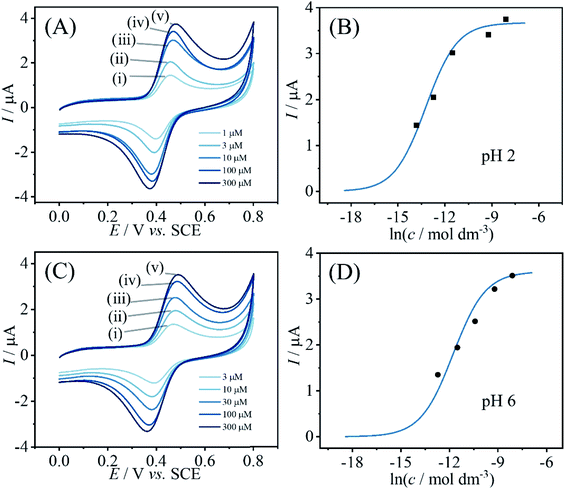
Information about the apparent binding constant for catechin can be extracted from binding curves based on catechin content immobilised in PIM-EA-TB as a function of catechin concentration in solution during the immobilisation process. Fig. 3 shows data for the effect of catechin concentration on binding into PIM-EA-TB at pH = 2 (protonated PIM-EA-TB) and at pH = 6 (neutral PIM-EA-TB). Estimates for binding constants are obtained here from voltammetric peak currents plotted and fitted with a Langmuirian model (Fig. 3). The binding constant at pH 2, 550 (±50) × 103 M−1, appears slightly higher compared to that at pH 6, 130 (±13) × 103 M−1, but both are likely to be dominated by the hydrogen bonding interaction.
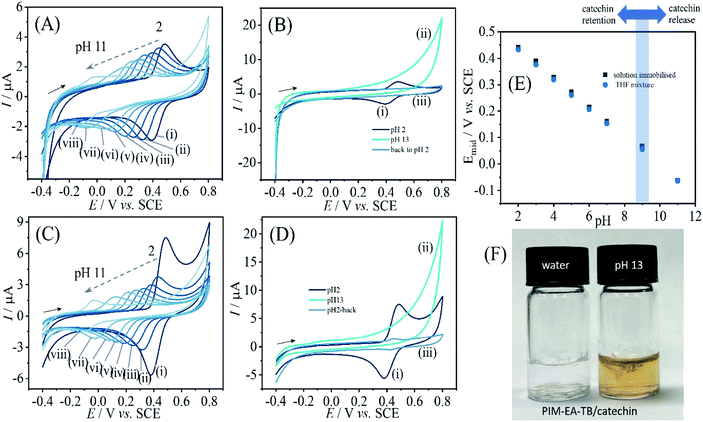
When varying the solution pH during cyclic voltammetry, well-defined Nernstian shift is observed (Fig. 4) and a gradual loss of catechin signal with every pH value. A more dramatic loss of signal occurs for pH > 9. Fig. 4B contrasts the behaviours when going from pH 2 to pH 13 and then back to pH 2. Clearly, all of the catechin has been removed under alkaline conditions. At this pH the catechin in solution can undergo deprotonation and therefore binding into the PIM-EA-TB is suppressed. Fig. 4F shows photographs for PIM-EA-TB with catechin deposited into a glass vial contrasting the behaviour under water and in pH 13 buffer solution. The colour change at pH 13 is consistent with the reported colour of catechin in alkaline solution37 and qualitative evidence for the release reaction (vide infra).
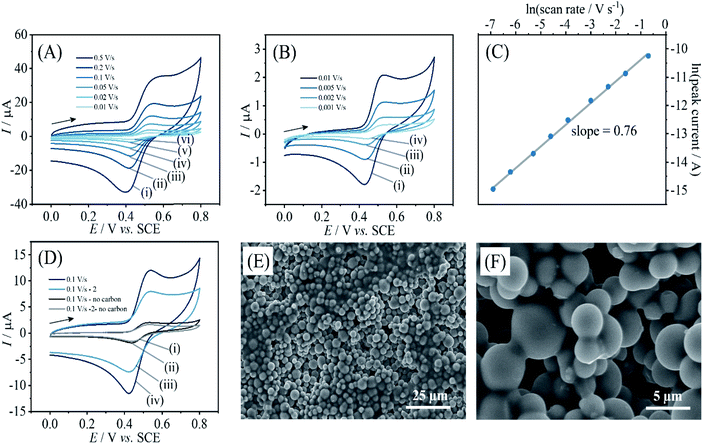
Due to these electrochemical processes occurring only in a very thin layer close to the electrode surface, currents remain low. It is possible to enhance currents by introducing a higher surface area. Carbon microspheres of typically 2 to 12 μm diameter (see Fig. 5E and F) can be employed and directly co-deposited with PIM-EA-TB. Here, 360 μg carbon were deposited together with 15 μg PIM-EA-TB. This is consistent with the same amount of PIM-EA-TB, but an approx. 24 times increase in total carbon surface area (assuming 6 μm diameter spheres). Fig. 5 shows data for oxidation of catechin (after binding from a 5 μM catechin solution). The peak current for catechin oxidation is approx. 2 μA at 0.01 V s−1 scan rate. For comparison, a current of 0.2 μA was observed for the same amount of PIM-EA-TB on a flat surface after immersion in 100 μM catechin (Fig. 2B). Therefore, the observed currents with carbon microspheres are substantially higher. A corresponding increase in capacitive background current is consistent with carbon microspheres increasing the surface area (see Fig. 5D).
3.2. Catechin immobilisation by codeposition with PIM-EA-TB
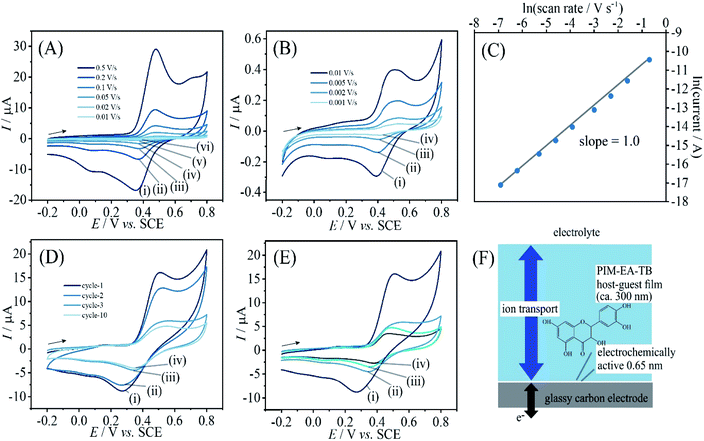
PIM-EA-TB is a highly processable polymer and dissolves into tetrahydrofuran (THF) at low concentrations. Solutions of PIM-EA-TB and catechin in THF can be combined and deposited directly onto the glassy carbon electrode. Fig. 6 shows cyclic voltammetry data for 2 μg catechin codeposited with 2 μg PIM-EA-TB. Given the molecular weights of the PIM-EA-TB repeat unit and of catechin, this corresponds approximately to a 1![[thin space (1/6-em)]](https://www.rsc.org/images/entities/char_2009.gif) :
:![[thin space (1/6-em)]](https://www.rsc.org/images/entities/char_2009.gif) 1 molecular ratio and should lead to effective hydrogen binding. Data in Fig. 6A and B are very similar to data in Fig. 2A and B. This confirms that 1
1 molecular ratio and should lead to effective hydrogen binding. Data in Fig. 6A and B are very similar to data in Fig. 2A and B. This confirms that 1![[thin space (1/6-em)]](https://www.rsc.org/images/entities/char_2009.gif) :
:![[thin space (1/6-em)]](https://www.rsc.org/images/entities/char_2009.gif) 1 polymer host repeat unit
1 polymer host repeat unit![[thin space (1/6-em)]](https://www.rsc.org/images/entities/char_2009.gif) :
:![[thin space (1/6-em)]](https://www.rsc.org/images/entities/char_2009.gif) guest complexes are formed during catechin absorption, but it also confirms that the codeposition method is viable. Fig. 6C demonstrates that again a linear increase in peak current with scan rate is observed. Only a very thin layer at the electrode surface is electrochemically active (Fig. 6F).
guest complexes are formed during catechin absorption, but it also confirms that the codeposition method is viable. Fig. 6C demonstrates that again a linear increase in peak current with scan rate is observed. Only a very thin layer at the electrode surface is electrochemically active (Fig. 6F).
Fig. 6D shows voltammetry data for the case of 1![[thin space (1/6-em)]](https://www.rsc.org/images/entities/char_2009.gif) :
:![[thin space (1/6-em)]](https://www.rsc.org/images/entities/char_2009.gif) 10 polymer repeat unit
10 polymer repeat unit![[thin space (1/6-em)]](https://www.rsc.org/images/entities/char_2009.gif) :
:![[thin space (1/6-em)]](https://www.rsc.org/images/entities/char_2009.gif) catechin ratio. The catechin oxidation peak current seems higher, but very rapidly drops to the value observed for 1
catechin ratio. The catechin oxidation peak current seems higher, but very rapidly drops to the value observed for 1![[thin space (1/6-em)]](https://www.rsc.org/images/entities/char_2009.gif) :
:![[thin space (1/6-em)]](https://www.rsc.org/images/entities/char_2009.gif) 1 polymer repeat unit
1 polymer repeat unit![[thin space (1/6-em)]](https://www.rsc.org/images/entities/char_2009.gif) :
:![[thin space (1/6-em)]](https://www.rsc.org/images/entities/char_2009.gif) catechin complexes. Therefore, catechin is readily leaching out to leave only the bound catechin in the microporous structure. Fig. 6E shows data also for the 1
catechin complexes. Therefore, catechin is readily leaching out to leave only the bound catechin in the microporous structure. Fig. 6E shows data also for the 1![[thin space (1/6-em)]](https://www.rsc.org/images/entities/char_2009.gif) :
:![[thin space (1/6-em)]](https://www.rsc.org/images/entities/char_2009.gif) 0.1 host monomer
0.1 host monomer![[thin space (1/6-em)]](https://www.rsc.org/images/entities/char_2009.gif) :
:![[thin space (1/6-em)]](https://www.rsc.org/images/entities/char_2009.gif) catechin codeposit which results in a considerably lower but stable current response. The effect of solution pH during voltammetric experiments is very similar for PIM-EA-TB films with catechin adsorbed from solution (Fig. 2A and B) and for catechin codeposited in 1
catechin codeposit which results in a considerably lower but stable current response. The effect of solution pH during voltammetric experiments is very similar for PIM-EA-TB films with catechin adsorbed from solution (Fig. 2A and B) and for catechin codeposited in 1![[thin space (1/6-em)]](https://www.rsc.org/images/entities/char_2009.gif) :
:![[thin space (1/6-em)]](https://www.rsc.org/images/entities/char_2009.gif) 1 ratio (Fig. 6A and B).
1 ratio (Fig. 6A and B).
3.3. Quercetin immobilisation by codeposition with PIM-EA-TB
Quercetin is significantly less soluble in water when compared to catechin. Therefore, experiments for adsorption into PIM-EA-TB have not been performed. However, codeposition of the 1![[thin space (1/6-em)]](https://www.rsc.org/images/entities/char_2009.gif) :
:![[thin space (1/6-em)]](https://www.rsc.org/images/entities/char_2009.gif) 1 polymer repeat unit
1 polymer repeat unit![[thin space (1/6-em)]](https://www.rsc.org/images/entities/char_2009.gif) :
:![[thin space (1/6-em)]](https://www.rsc.org/images/entities/char_2009.gif) quercetin films is readily achieved and the voltammetric behaviour can be investigated. Data in Fig. 7A and B show oxidation and back-reduction peaks for quercetin in PIM-EA-TB immersed in pH 2 phosphate buffer solution. Oxidation (see eqn (5)) and reduction follow the 2-electron 2-proton mechanism with a midpoint potential consistent with that reported in the literature.27,28 Peak currents exhibit a linear relationship to scan rate consistent with a thin film of redox-active molecules close to the electrode surface. The charge under voltametric peaks is very similar to that observed for catechin and therefore a very similar redox active film (probably within tunnelling distance, Fig. 7F) can be assumed.
quercetin films is readily achieved and the voltammetric behaviour can be investigated. Data in Fig. 7A and B show oxidation and back-reduction peaks for quercetin in PIM-EA-TB immersed in pH 2 phosphate buffer solution. Oxidation (see eqn (5)) and reduction follow the 2-electron 2-proton mechanism with a midpoint potential consistent with that reported in the literature.27,28 Peak currents exhibit a linear relationship to scan rate consistent with a thin film of redox-active molecules close to the electrode surface. The charge under voltametric peaks is very similar to that observed for catechin and therefore a very similar redox active film (probably within tunnelling distance, Fig. 7F) can be assumed.
 | (5) |
Secondary peaks observed at higher scan rate (see Fig. 7A) could be linked to localised pH imbalances in the microporous host, but could also be associated with subsequent oxidation steps as reported by Brett et al.28 Data in Fig. 7D and E suggest that (similar to the case of catechin) excess quercetin (1![[thin space (1/6-em)]](https://www.rsc.org/images/entities/char_2009.gif) :
:![[thin space (1/6-em)]](https://www.rsc.org/images/entities/char_2009.gif) 10 host polymer repeat unit
10 host polymer repeat unit![[thin space (1/6-em)]](https://www.rsc.org/images/entities/char_2009.gif) :
:![[thin space (1/6-em)]](https://www.rsc.org/images/entities/char_2009.gif) quercetin) can be leaching out. A stable signal under cyclic voltammetry conditions is observed after 10 potential cycles and this is consistent with that for the 1
quercetin) can be leaching out. A stable signal under cyclic voltammetry conditions is observed after 10 potential cycles and this is consistent with that for the 1![[thin space (1/6-em)]](https://www.rsc.org/images/entities/char_2009.gif) :
:![[thin space (1/6-em)]](https://www.rsc.org/images/entities/char_2009.gif) 1 host polymer repeat unit
1 host polymer repeat unit![[thin space (1/6-em)]](https://www.rsc.org/images/entities/char_2009.gif) :
:![[thin space (1/6-em)]](https://www.rsc.org/images/entities/char_2009.gif) quercetin film deposit.
quercetin film deposit.
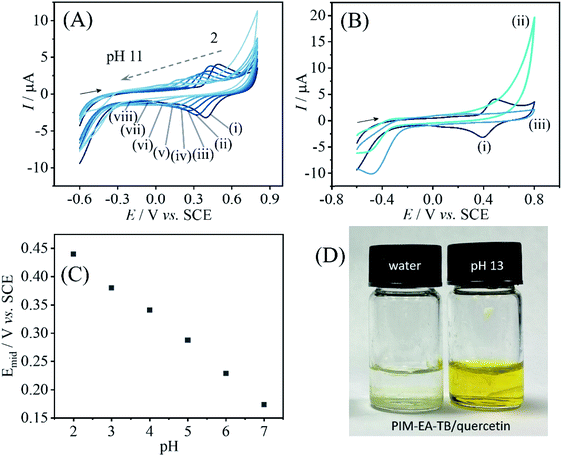
Data in Fig. 8A show the effect of solution pH on the voltammetric response for immobilised quercetin. A Nernstian shift in midpoint potential very similar to that observed for catechin is detected over a pH range from 2 to 7 (Fig. 8C). Data from more alkaline solution suggest leaching of quercetin. Fig. 8B shows data obtained subsequently for pH 2, then pH 13, then back in pH 2 and the signal for quercetin is clearly lost after exposure to alkaline conditions. When depositing PIM-EA-TB/quercetin into glass vials and adding water or phosphate buffer pH 13, the characteristic colour change for catechin anions released into the alkaline solution is observed (Fig. 8D).
3.4. Catechin and quercetin immobilisation by codeposition with PIM-EA-TB followed by electrochemically driven release
The release of the guest molecule from PIM-EA-TB occurs diffusion controlled and can be observed as a gradual loss of the voltammetric signal, slighter faster for the more water soluble catechin and somewhat slower for the less water-soluble quercetin. In order to quantify the release of these guest molecules, quantitative analysis of the solution phase by mass spectroscopy coupled to liquid chromatography was employed.For catechin as 10![[thin space (1/6-em)]](https://www.rsc.org/images/entities/char_2009.gif) :
:![[thin space (1/6-em)]](https://www.rsc.org/images/entities/char_2009.gif) 1 guest
1 guest![[thin space (1/6-em)]](https://www.rsc.org/images/entities/char_2009.gif) :
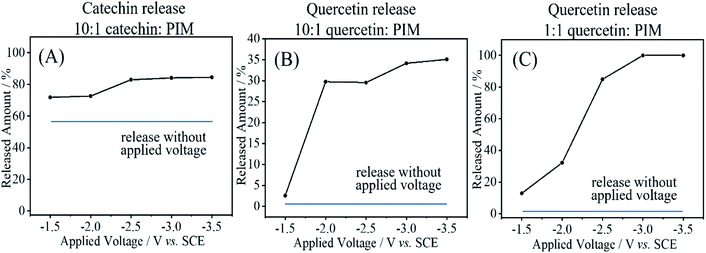
:![[thin space (1/6-em)]](https://www.rsc.org/images/entities/char_2009.gif) host codeposit, the release into 10 mM phosphate buffer pH 7 was significant already over a period of 5 minutes (see Fig. 9A). Essentially most of the catechin is released within 5 minutes either with applied voltage or without. The applied voltage enhances the release by driving out the remaining 1
host codeposit, the release into 10 mM phosphate buffer pH 7 was significant already over a period of 5 minutes (see Fig. 9A). Essentially most of the catechin is released within 5 minutes either with applied voltage or without. The applied voltage enhances the release by driving out the remaining 1![[thin space (1/6-em)]](https://www.rsc.org/images/entities/char_2009.gif) :
:![[thin space (1/6-em)]](https://www.rsc.org/images/entities/char_2009.gif) 1 guest
1 guest![[thin space (1/6-em)]](https://www.rsc.org/images/entities/char_2009.gif) :
:![[thin space (1/6-em)]](https://www.rsc.org/images/entities/char_2009.gif) host complex. Some remaining catechin is likely to be trapped in PIM-EA-TB outside of the zone of the glassy carbon electrode. For quercetin as 10
host complex. Some remaining catechin is likely to be trapped in PIM-EA-TB outside of the zone of the glassy carbon electrode. For quercetin as 10![[thin space (1/6-em)]](https://www.rsc.org/images/entities/char_2009.gif) :
:![[thin space (1/6-em)]](https://www.rsc.org/images/entities/char_2009.gif) 1 guest
1 guest![[thin space (1/6-em)]](https://www.rsc.org/images/entities/char_2009.gif) :
:![[thin space (1/6-em)]](https://www.rsc.org/images/entities/char_2009.gif) host codeposit, the diffusion-driven loss is less dramatic. Fig. 9B shows data for no applied voltage where only less than 5% are released within 10 minutes. An applied negative voltage was then employed to locally create alkaline conditions at the electrode surface (associated with hydrogen evolution). It can be observed that at −2 V vs. SCE the process is effective and partial release is observed for the 1
host codeposit, the diffusion-driven loss is less dramatic. Fig. 9B shows data for no applied voltage where only less than 5% are released within 10 minutes. An applied negative voltage was then employed to locally create alkaline conditions at the electrode surface (associated with hydrogen evolution). It can be observed that at −2 V vs. SCE the process is effective and partial release is observed for the 1![[thin space (1/6-em)]](https://www.rsc.org/images/entities/char_2009.gif) :
:![[thin space (1/6-em)]](https://www.rsc.org/images/entities/char_2009.gif) 10 host monomer
10 host monomer![[thin space (1/6-em)]](https://www.rsc.org/images/entities/char_2009.gif) :
:![[thin space (1/6-em)]](https://www.rsc.org/images/entities/char_2009.gif) quercetin film. The amount of material released (approx. 35%) appears to be less than that expected based on the total loading. In part this could be due to the low solubility of quercetin preventing detection. Fig. 9C shows the case of release from a 1
quercetin film. The amount of material released (approx. 35%) appears to be less than that expected based on the total loading. In part this could be due to the low solubility of quercetin preventing detection. Fig. 9C shows the case of release from a 1![[thin space (1/6-em)]](https://www.rsc.org/images/entities/char_2009.gif) :
:![[thin space (1/6-em)]](https://www.rsc.org/images/entities/char_2009.gif) 1 host polymer repeat unit
1 host polymer repeat unit![[thin space (1/6-em)]](https://www.rsc.org/images/entities/char_2009.gif) :
:![[thin space (1/6-em)]](https://www.rsc.org/images/entities/char_2009.gif) quercetin film and close to 100% release is observed at potentials negative of −2.5 V vs. SCE. Electrochemical release can be effective for quercetin, but slow non-electrochemical release from the PIM-EA-TB micropores (for catechin fast) is always observed down to the level of the 1
quercetin film and close to 100% release is observed at potentials negative of −2.5 V vs. SCE. Electrochemical release can be effective for quercetin, but slow non-electrochemical release from the PIM-EA-TB micropores (for catechin fast) is always observed down to the level of the 1![[thin space (1/6-em)]](https://www.rsc.org/images/entities/char_2009.gif) :
:![[thin space (1/6-em)]](https://www.rsc.org/images/entities/char_2009.gif) 1 host
1 host![[thin space (1/6-em)]](https://www.rsc.org/images/entities/char_2009.gif) :
:![[thin space (1/6-em)]](https://www.rsc.org/images/entities/char_2009.gif) guest system.
guest system.
4. Conclusion
It has been shown that catechin or quercetin can effectively bind into PIM-EA-TB most likely via hydrogen bonding to tertiary amine sites. Alternatively, these molecular guests and polymer host can be co-deposited from solution in 1![[thin space (1/6-em)]](https://www.rsc.org/images/entities/char_2009.gif) :
:![[thin space (1/6-em)]](https://www.rsc.org/images/entities/char_2009.gif) 1 stoichiometry to give films with essentially the same electrochemical properties. Accumulation of catechin occurs over a pH range from 2 to 7 irrespective of PIM-EA-TB protonation. Electrochemically driven release of both catechin or quercetin can be triggered at more alkaline pH values generated when applying sufficiently negative potentials. Electrochemical release of quercetin has been demonstrated by application of a negative applied potential (typically −2 V vs. SCE) to trigger a localised pH increase at the electrode surface. The key results of this work can be summarised as follows:
1 stoichiometry to give films with essentially the same electrochemical properties. Accumulation of catechin occurs over a pH range from 2 to 7 irrespective of PIM-EA-TB protonation. Electrochemically driven release of both catechin or quercetin can be triggered at more alkaline pH values generated when applying sufficiently negative potentials. Electrochemical release of quercetin has been demonstrated by application of a negative applied potential (typically −2 V vs. SCE) to trigger a localised pH increase at the electrode surface. The key results of this work can be summarised as follows:
• PIM-EA-TB as microporous host can provide conditions for catechin or quercetin to accumulate and to be reversibly oxidised to the corresponding quinones. The electrochemical processes happen only in a very thin layer close to the carbon electrode surface (within tunnelling distance).
• Highly chemically reversible voltammetric responses suggest that there is no polymerisation or coupling of radical intermediates in the micropores of the PIM-EA-TB. This is consistent with limited mobility/reactivity of guests in the micropores.
• Binding of catechin into PIM-EA-TB is spontaneous at pH 2 (with protonation) or at pH 6 (without protonation) with similar binding constants and this can be attributed, at least in part, to hydrogen bonding interactions. Formation of 1![[thin space (1/6-em)]](https://www.rsc.org/images/entities/char_2009.gif) :
:![[thin space (1/6-em)]](https://www.rsc.org/images/entities/char_2009.gif) 1 host polymer repeat unit
1 host polymer repeat unit![[thin space (1/6-em)]](https://www.rsc.org/images/entities/char_2009.gif) :
:![[thin space (1/6-em)]](https://www.rsc.org/images/entities/char_2009.gif) guest product are observed.
guest product are observed.
• Codeposition of PIM-EA-TB with catechin or quercetin is possible in any host monomer![[thin space (1/6-em)]](https://www.rsc.org/images/entities/char_2009.gif) :
:![[thin space (1/6-em)]](https://www.rsc.org/images/entities/char_2009.gif) guest ratio, but stable cyclic voltammetry responses are observed only for 1
guest ratio, but stable cyclic voltammetry responses are observed only for 1![[thin space (1/6-em)]](https://www.rsc.org/images/entities/char_2009.gif) :
:![[thin space (1/6-em)]](https://www.rsc.org/images/entities/char_2009.gif) 1 ratios or lower guest concentrations. Excess guest species are readily released into the electrolyte solution.
1 ratios or lower guest concentrations. Excess guest species are readily released into the electrolyte solution.
• Electrochemically triggered release is effective for quercetin codeposits whereas catechin is more water soluble and therefore released at a higher rate without electrochemical stimulus.
In the future rigid polymer host materials such as PIMs could provide functional environments for accumulation and release of guests. The range of possible structural motifs is considerable and pore size as well as host–guest interactions could be tuned. Reactivity of PIM-EA-TB in aqueous acids may be associated with additional temporary ring-opening processes at the methano-bridge38 and therefore further study and comparison to the behaviour of other types of PIMs will be of interest. The ability to bind and release guests will be linked to functional properties (molecular interactions) as well as to pore size distribution/shape and could be further optimised for particular applications.
Conflicts of interest
There are no conflicts to declare.Acknowledgements
L. W. thanks the China Scholarship Council (201906870022) for a PhD stipend.References
- W. Xie, D. Cui, S. R. Zhang, Y. H. Xu and D. L. Jiang, Mater. Horiz., 2019, 6, 1571–1595 RSC.
- R. C. Johnson, R. G. Cooks, T. M. Allen, M. E. Cisper and P. H. Hemberger, Mass Spectrom. Rev., 2000, 19, 1–37 CrossRef CAS PubMed.
- A. Devine, C. Hegarty, C. Casimero, R. L. Molyneaux, R. B. Smith, M. F. Cardosi and J. Davis, J. Electroanal. Chem., 2020, 872, 113926 CrossRef CAS.
- K. Liu, Y. T. Kang, Z. Q. Wang and X. Zhang, Adv. Mater., 2013, 25, 5530–5548 CrossRef CAS PubMed.
- N. B. McKeown and P. M. Budd, Macromolecules, 2010, 43, 5163–5176 CrossRef CAS.
- Z. X. Low, P. M. Budd, N. B. McKeown and D. A. Patterson, Chem. Rev., 2018, 118, 5871–5911 CrossRef CAS PubMed.
- N. B. McKeown, Polymer, 2020, 202, 122736 CrossRef CAS.
- M. Z. Ahmad, R. Castro-Munoz and P. M. Budd, Nanoscale, 2020, 12, 23333–23370 RSC.
- F. A. A. Nugroho, C. Xu, N. Hedin and C. Langhammer, Anal. Chem., 2015, 87, 10161–10165 CrossRef CAS PubMed.
- L. N. Wang, Y. Z. Zhao, B. B. Fan, M. Carta, R. Malpass-Evans, N. B. McKeown and F. Marken, Electrochem. Commun., 2020, 118, 106798 CrossRef CAS.
- F. Marken, M. Carta and N. B. McKeown, Anal. Chem., 2021, 93, 1213–1220 CrossRef CAS PubMed.
- M. Carta, R. Malpass-Evans, M. Croad, Y. Rogan, J. C. Jansen, P. Bernardo, F. Bazzarelli and N. B. McKeown, Science, 2013, 339, 303–307 CrossRef CAS PubMed.
- E. Madrid, Y. Y. Rong, M. Carta, N. B. McKeown, R. Malpass-Evans, G. A. Attard, T. J. Clarke, S. H. Taylor, Y. T. Long and F. Marken, Angew. Chem. Inter. Ed., 2014, 53, 10751–10754 CrossRef CAS PubMed.
- L. N. Wang, R. Malpass-Evans, M. Carta, N. B. McKeown and F. Marken, J. Solid State Electrochem., 2020, 24, 2797–2806 CrossRef CAS.
- Z. K. Li, L. N. Wang, R. Malpass-Evans, M. Carta, N. B. McKeown, K. Mathwig, P. J. Fletcher and F. Marken, ChemElectroChem, 2021, 8, 2044–2051 CrossRef CAS.
- J. J. Dalluge and B. C. Nelson, J. Chromatogr. A, 2000, 881, 411–424 CrossRef CAS PubMed.
- M. Sano, M. Tabata, M. Suzuki, M. Degawa, T. Miyase and M. Maeda-Yamamoto, Analyst, 2001, 126, 816–820 RSC.
- V. Castaignede, H. Durliat and M. Comtat, Anal. Lett., 2003, 36, 1707–1720 CrossRef CAS.
- A. N. Loes, L. Ruyle, M. Arvizu, K. E. Gresko, A. L. Wilson and C. E. Deutch, Lett. Appl. Microbiol., 2014, 58, 31–41 CrossRef CAS PubMed.
- S. H. Nile, A. S. Nile, Y. S. Keum and K. Sharma, Food Chem., 2017, 235, 119–126 CrossRef CAS PubMed.
- P. Janeiro and A. M. O. Brett, Anal. Chim. Acta, 2004, 518, 109–115 CrossRef CAS.
- M. Seruga, I. Novak and L. Jakobek, Food Chem., 2011, 124, 1208–1216 CrossRef CAS.
- T. Nakayama and B. Uno, Chem. Pharm. Bull., 2015, 63, 967–973 CrossRef CAS PubMed.
- H. R. Zare and A. M. Habibirad, J. Solid State Electrochem., 2006, 10, 348–359 CrossRef CAS.
- M. Muzolf, H. Szymusiak, A. Gliszczynska-Swiglo, I. M. C. M. Rietjens and B. E. Tyrakowska, J. Agric. Food Chem., 2008, 56, 816–823 CrossRef CAS PubMed.
- J. M. Herrero-Martinez, M. Sanmartin, M. Roses, E. Bosch and C. Rafols, Electrophoresis, 2005, 26, 1886–1895 CrossRef CAS PubMed.
- H. P. Hendrickson, A. D. Kaufman and C. E. Lunte, J. Pharm. Biomed. Anal., 1994, 12, 325–334 CrossRef CAS PubMed.
- A. M. O. Brett and M. E. Ghica, Electroanalysis, 2003, 15, 1745–1750 CrossRef CAS.
- J. C. Hu and Z. G. Zhang, Nanomaterials, 2020, 10, 2020 CrossRef CAS PubMed.
- M. Zhang, S. G. Swarts, L. J. Yin, C. M. Liu, Y. P. Tian, Y. B. Cao, M. Swarts, S. M. Yang, S. B. Zhang, K. Z. Zhang, S. Q. Ju, D. J. Olek, L. Schwartz, P. C. Keng, R. Howell, L. R. Zhang and P. Okunieff, Oxygen Transport to Tissue XXXII, ed. J. C. LaManna, M. A. Puchowicz, K. Xu, D. K. Harrison and D. F. Bruley, Book Series: Advances in Experimental Medicine and Biology, 2011, vol. 701, pp. 283–289 Search PubMed.
- X. Xu, D. Y. Nan, H. Yang, S. Pan, H. Liu and X. L. Hu, Sens. Actuators, B, 2020, 304, 127324 CrossRef CAS.
- Y. Z. Mu, G. S. Wu, C. Su, Y. Dong, K. C. Zhang, J. Li, X. J. Sun, Y. Li, X. G. Chen and C. Feng, Carbohydr. Polym., 2019, 223, 115072 CrossRef CAS PubMed.
- M. Liu, L. N. Dong, A. J. Chen, Y. Zheng, D. Z. Sun, X. Wang and B. Q. Wang, Spectrochim. Acta, Part A, 2013, 115, 854–860 CrossRef CAS PubMed.
- K. Hemmati, A. Masoumi and M. Ghaemy, Polymer, 2015, 59, 49–56 CrossRef CAS.
- G. Le Nest, O. Caille, M. Woudstra, S. Roche, B. Burlat, V. Belle, B. Guigliarelli and D. Lexa, Inorg. Chim. Acta, 2004, 357, 2027–2037 CrossRef CAS.
- Y. Y. Rong, A. Kolodziej, E. Madrid, M. Carta, R. Malpass-Evans, N. B. McKeown and F. Marken, J. Electroanal. Chem., 2016, 779, 241–249 CrossRef CAS.
- M. J. Yang, Y. A. Hung, T. W. Wong, N. Y. Lee, J. M. P. Yuann, S. T. Huang, C. Y. Wu, I. Z. Chen and J. Y. Liang, Molecules, 2018, 23, 1631 CrossRef PubMed.
- A. Greenberg, N. Molinaro and M. Lang, J. Org. Chem., 1984, 49, 1127–1130 CrossRef CAS.
| This journal is © The Royal Society of Chemistry 2021 |

