 Open Access Article
Tuning the mechanical properties of functionally graded nickel and aluminium alloy at the nanoscale†
Shailee Mitraa,
Md. Habibur Rahman a,
Mohammad Motalab
 *a,
Tawfiqur Rakibb and
Pritom Bose
 a
a
aDepartment of Mechanical Engineering, Bangladesh University of Engineering and Technology, Dhaka-1000, Bangladesh. E-mail: abdulmotalab@me.buet.ac.bd
bDepartment of Mechanical Science and Engineering, University of Illinois at Urbana-Champaign, Urbana, IL 61801, USA
First published on 15th September 2021
Abstract
In this article, Molecular Dynamics (MD) simulation is used to investigate the tensile mechanical properties of functional graded Ni–Al (Ni3Al) alloy with Ni coating. The grading profile, temperature, crystallographic direction, and concentration of vacancy defects have been varied and corresponding changes in the tensile properties are reported. In general, it has been revealed that functional grading may reduce the ultimate tensile strength (UTS) of this homogeneous alloy but increase Young's modulus (YM). Furthermore, MD simulations suggest that elliptically graded Ni–Al alloy has the highest UTS at low temperature while at high temperature, the largest UTS is recorded for the parabolic grading. Besides, at any temperature, the parabolically graded Ni–Al alloy shows the largest YM, followed by linear grading and elliptical grading. Moreover, it is also observed that the [111] crystallographic direction for this alloy demonstrates the highest UTS and YM. At extremely low temperatures, lattice mismatch is also observed to exert a significant impact on the failure characteristics of functional graded Ni–Al alloys. This investigation also suggests that the vacancy defects introduced via removing either Al or Ni atoms degrades the UTS and YM of FGM alloys remarkably. Besides, it is also found that the UTS and YM of Ni–Al FGM alloys are very sensitive to Ni vacancies compared to Al vacancies. Parabolic grading demonstrates more resilience against vacancy defects, followed by linear and elliptical grading. This paper provides a comprehensive understanding of the mechanical properties of Ni–Al FGM alloys at the atomic level as a potential substitute for homogeneous alloys.
1. Introduction
Functionally Graded Materials (FGMs) have great potential not only for application as heat-resistant materials but also as structural materials, biomaterials, semiconductors, and electrode materials.1–3 The concept of FGMs was first initiated in Japan for use in high-temperature applications such as rocket engines, jet engines, and other aerospace applications which can carry high-temperature gradient, and reduce residual stress.4,5 Udupa et al. reported that FGMs are inhomogeneous materials consisting of two or more distinct materials, designed to have continuously changing spatial compositions for particular applications.1 Tarlochan stated that FGMs are the advanced engineering materials in the composites family comprising two or more constituent phases with continuous and smoothly varying compositions.2 Besides, FGMs are designed in the desired orientation of the material axis based on different gradients of composition, thus making them flexible and superior to homogeneous material composed of identical constituents.2 Zhang et al. investigated the stability, buckling, and vibrational properties of FGMs6, and summarized that FGMs are the innovative production of composite materials used in the past, which consists of two or more materials to achieve the desired properties depending on the application where an FGMs is used, and due to their graded properties at any single point in different dimensions, FGMs have attained considerable attention from the worldwide researcher.It is worth mentioning that FGMs coating can reduce the crack driving force to connect the materials, can reduce the stress at the interface, and can greatly enhance bond strength.7 Different techniques have been used to manufacture bulk FGMs such as CVD (Chemical Vapor Deposition) process, PVD (Physical Vapor Deposition) process, surface reaction process, plasma spraying process, and so on.8–13 Qasim and Gupta investigated FGM composites for effective stress control in insulators,14 for example, they reported that the sedimentation technique could be used effectively to obtain a functionally graded material that has a linear spatial permittivity distribution.14 Moreover, they also demonstrated that using an FGM with a linear permittivity variance is shown to improve stress management effectively, and the field efficiency factor indicates that the FGM spacer substantially increases the distribution of electric fields inside and around the spacer.14 Maalawi investigated the optimization technique of FGMs structures,15 reported that FGMs represent a rapidly expanding field of science and engineering with many practical applications; there are uniquely various and complex research needs in this field but FGMs offer substantial potential benefits that completely justify the required effort.15 While there are various applications of FGMs in aerospace, defense, nuclear, automotive, and other industries, FGMs also play a vital role in the medical sector.6 Taking a wake-up look at the humans bone enhancement method, more in-depth work is needed on FGMs concerning health care, such as bone implantation, dentistry, etc.6 Cui et al. investigated the optimization of functionally graded material layer architecture in all dental ceramic restorations,16 and reported that the stress concentration in the natural tooth structure could be reduced with the help of functionally graded dentin- enamel junction which interconnects enamel and dentin.16 This concept can be applied in all-ceramic dental restorations, for excellent stress reduction and distribution.16
Additionally, several experimental and numerical approaches have been utilized to investigate the thermo-mechanical characteristics of FGMs at bulk and micro-level.16–21 For instance, investigation on the dynamic stability of spherical FGM shells,22 functionally graded circular plates subjected to radial compressive stress,23 vibrational characteristics of functionally graded bars,24 shear deformation analysis of FGM plates,25 crack growth process in FGMs with the aid of digital image correlation,26 creep deformation process in FGMs,27 investigation of microhardness on FGM polymer composites,28 quasi-static fracture analysis of FGMs,29 elasto-plastic30 and deformation31 analysis of functionally graded rotating disc, thermal stress,32 unsteady heat conduction,33 thermo-mechanical34 analysis of 2D FMG plates and so on.
However, to the best of our knowledge FGMs at the nanoscale have not been explored extensively yet. Keeping the potential application of FGMs in mind, in this study, it is aimed to investigate the temperature-dependent mechanical properties of functionally graded Ni and Al alloy using classical Molecular Dynamics (MD). In this study, tri-nickel aluminide (Ni3Al, IC-221M superalloy) has been chosen which is an intermetallic alloy of nickel and aluminium having properties similar to both a ceramic and a metal, thus making it ideal for FGM.1,3,4,35 Ni3Al is unique in that it has very high thermal conductivity combined with a high tensile strength at high temperatures.36–42 For instance, Ni3Al has a high resistance to tensile and compressive loads at a temperature of 650–1100 °C, high resistance to oxygen and carbon enriched atmosphere, high resistance to creep and fatigue, remarkable resistance to wear at high temperatures, and a relatively low density which gives it a high strength to weight ratio.36 Such properties and their low density make it suitable for special applications where higher temperature and a corrosive atmosphere requires superior strength.42–46
Undoubtedly, the MD approach is proven to be effective to find out the temperature-dependent mechanical properties and melting characteristics of aluminium,47–49 nickel50–53 at the nanoscales, and their different intermetallic alloy (Ni3Al).54,55 For instance, Luan et al.56 reported the tensile properties of Ni3Al using first principle calculation, and analysis suggests that Young's modulus (YM) takes the maximum value along [111] direction followed by [110] and [100] crystallographic orientation of Ni3Al. Their investigation also includes an in-depth analysis of anisotropic bulk modulus, Poisson's ratio, and shear modulus, and it is noteworthy that their first calculation studies exhibit nice agreement with the experiment. Besides, Wang et al.55 investigated the size-dependent tensile deformation mechanism of Ni3Al nanowire (NW) utilizing classical MD simulation. Their reports include a wide range of studies, such as temperature, diameter, and anisotropic YM, fracture nucleation process of Ni3Al NW. Furthermore, Yang et al. investigated the melting characteristics of Ni3Al by MD simulation using EAM potential54 and reported a high melting point of Ni3Al alloy.54
Hence, the gap in the understanding of the effect of the profile, temperature, crystal orientations, and defects on the tensile mechanical properties of Ni–Al FGMs requires a complete study as well as an in-depth perception at the atomic level. Ni–Al FGMs have been chosen because material properties such as heat, corrosion resistance, and mechanical characteristics can be tuned along with target-specific dimensions. The variance of compositions has been varied in a particular direction which makes FGMs a more interesting material compared to homogeneous alloy as reported earlier.1–3,35 The FGM samples of Ni–Al considered in this investigation have been subjected to uniaxial tensile strain, where the temperature has been varied from 100 K to 600 K, and three crystal orientations [100], [110], and [111] have been chosen. The stress–strain relationships have been reported for tensile loading as a function of the profile, temperature, crystallographic orientation, and vacancy defects. The variations of the ultimate tensile strength (UTS) and YM based on various profiles with temperature and crystallographic orientation have been discussed with detailed analysis. Defects play an important role during the manufacturing of FGMs which affects the tensile properties of materials significantly at both micro/macro scales. To investigate the effect of vacancy defect, the vacancy has been introduced via removing either aluminium atoms or nickel atoms from the FGM alloys. Then the corresponding stress–strain response has been recorded. Moreover, the temperature-dependent failure mechanism of linearly graded Ni–Al alloy has been elucidated in this paper.
2. Computational method
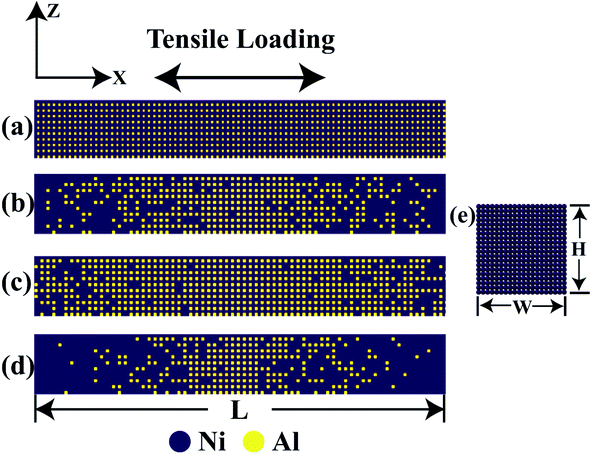
The lattice of perfect single crystal aluminium and nickel is FCC (face-centered cubic) structure with a lattice parameter of 4.06 Ȧ and 3.52 Ȧ, respectively.47,51 In Fig. S1,† the lattice structure for the single crystal Ni3Al is shown which has a lattice parameter of 3.57 Ȧ38 where nickel atoms are on face centers and aluminium atoms at corners.38 Variation in the percentage of aluminium atom in Ni3Al crystal has been introduced by replacing aluminium with nickel from the corner of the Ni3Al crystal by following different grading functions such as linear, elliptical, and parabolic with the help of Java programming57 and atomsk.58 The dimension of the Ni–Al FGM alloy nanowire (NW) has been taken as 28.57 nm × 3.57 nm × 3.57 nm which maintains a length to width ratio of 8![[thin space (1/6-em)]](https://www.rsc.org/images/entities/char_2009.gif) :
:![[thin space (1/6-em)]](https://www.rsc.org/images/entities/char_2009.gif) 1.59,60 Three different crystallographic orientations ([100], [110] and [111]) have been studied. In Fig. 1, different types of grading functions employed in the Ni–Al FGM samples have been shown. In Fig. 2, the initial coordinates of Ni3Al alloy, FGM alloy with linear, parabolic, and elliptical grading have been displayed. It is worth mentioning that Ni3Al alloy (L12 phase of Ni–Al intermetallic) includes 75% nickel and 25% aluminium, and so maximum of 25% aluminium could be soluble in that phase. Therefore, this limitation has been kept in mind while employing different grading functions.
1.59,60 Three different crystallographic orientations ([100], [110] and [111]) have been studied. In Fig. 1, different types of grading functions employed in the Ni–Al FGM samples have been shown. In Fig. 2, the initial coordinates of Ni3Al alloy, FGM alloy with linear, parabolic, and elliptical grading have been displayed. It is worth mentioning that Ni3Al alloy (L12 phase of Ni–Al intermetallic) includes 75% nickel and 25% aluminium, and so maximum of 25% aluminium could be soluble in that phase. Therefore, this limitation has been kept in mind while employing different grading functions.
Large-scale Atomic Massively Parallel Simulator (LAMMPS)61 has been used to perform MD simulations of Functionally Graded Ni–Al alloy and atomistic visualization has been done with OVITO.62 To describe the interatomic interaction between atoms in the system, Embedded Atom Method (EAM) potential52 has been used which is widely used to define interactions for metal and their intermetallic alloy systems.52,63,64 At first, using the Conjugate Gradient (CG) minimization scheme, the energy of the system has been minimized at absolute zero temperature (i.e., 0 K) with a time step of 1 fs.59,60,65
Then canonical NVE (i.e., constant volume and energy) and NPT (i.e., constant pressure and temperature) equilibration have been carried out for 100 ps each after that uniaxial tensile strain has been applied along X direction at a constant strain rate of 109 s−1 under NVT (i.e., constant volume and temperature) ensembles to control temperature fluctuations.59,60,65–67 The periodic boundary condition has been applied at the loading direction (X) and other directions have been kept stress-free. This strain rate is higher than that adopted in real life because we are constrained by computational resources. However, earlier works found that the strain rate of 109 s−1 is good enough for atomistic simulations.59,60,65,68–74 The atomic stress is calculated using virial stress theorem59,60 which can be expressed as,
 corresponds to the mass of the atom i,
  represents the velocity component of atom i, ⊗ is the cross product, rij represents the distance between atom i and j, and fij is the interatomic force exerted by atom j on atom i.59,60 To address the error induced from temperature fluctuation during MD simulation, for some simulations, three samples with different initial atomic velocity has been chosen, and corresponding errors have been added to the partial results.75
To check the validity of this computational code and potential used, YM of [100] oriented Ni, Al, Ni3Al, and the melting point of [100] oriented Ni3Al has been compared with existing literature which is presented in Fig. 3(a–b) and Table 1. The melting point of Ni3Al has been calculated by placing the system in the NVT ensemble, then equilibration has been performed for 100 ps. During equilibration, the coordinates of the atoms have been adjusted by constraining the position of the center of the mass. Then the system has been placed into the NPT ensemble where the temperature of the system has been increased from 300 K to 2500 K within 150 ps by keeping the pressure at 1 bar.76,77 During temperature rise, the change in the total energy of the Ni3Al system has been recorded and further analyzed to get a better perception of the melting point.76 Fig. 3(b) displays the melting point of Ni3Al by showing the change in the total energy concerning temperature. Note that the bend in the total energy curve refers to a first-order melting transition point of the Ni3Al alloy system. YM has been calculated from the stress–strain curve and strain value less than 4% using a linear regression.59,60
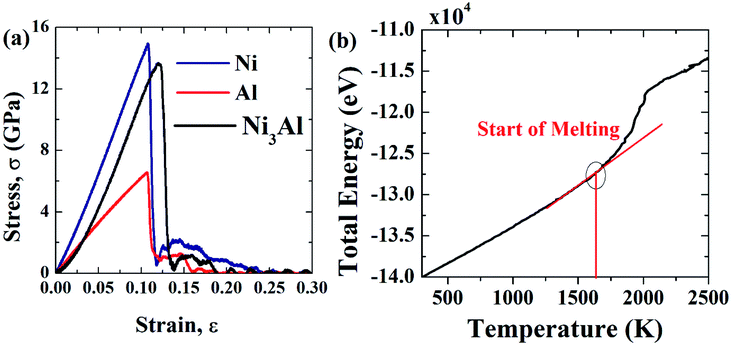 | ||
| Fig. 3 (a) Stress–strain curves of Ni, Al, and Ni3Al for 28.57 × 3.57 × 3.57 nm at 300 K, and (b) determination of the melting point of Ni3Al. | ||
| Material | Young's modulus (YM) (GPa) | Melting Point (K) |
|---|---|---|
| a Therefore, it can be inferred that the potential used to define the interatomic interaction in this study can accurately represent the mechanical properties of the Ni–Al FGM alloys. | ||
| Al | ∼68 (GPa) [present calculation] | — |
| ∼69 (GPa),47 ∼62 (ref. 49) | ||
| Ni | ∼130 (GPa) [present calculation] | — |
| ∼116.5–119.4 (GPa)52 | ||
| ∼110 GPa (ref. 78) | ||
| Ni3Al | ∼99 GPa [present calculation] | ∼1655K [present calculation], ∼1663K (experiment)54, ∼1705 (sandwich method)54, ∼1727 (NVE method)54 |
| ∼96 GPa (ref. 55) [∼4 nm diameter based sample] | ||
3. Results and discussions
3.1 Impact of temperature, profile on the stress–strain behavior of Ni–Al FGM alloy
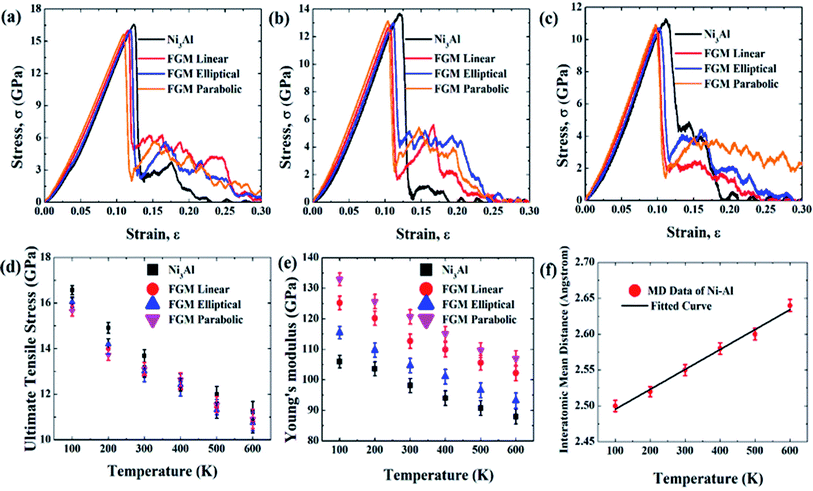
Fig. 4 (a–c) represents the stress–strain response of Ni3Al (non-FGM), FGM linear, FGM elliptical, and FGM parabolic alloy at 100 K, 300 K, and 600 K, respectively. The stress–strain behavior of various FGM profiles at different temperatures has been thoroughly discussed in this section. MD simulations have been performed at 100 K to 600 K, with a 100 K interval. Fig. 4(d–e) shows the variation of UTS and YM, respectively as a function of temperature for different grading functions. From the stress–strain diagram as depicted in Fig. 4(a–c), it is clear that the materials (Ni3Al, FGM linear, FGM elliptical, and FGM parabolic) exhibit ductile type failure. However, at the early stage of tensile deformation (up to the strain less than 4%), the stress–strain relation is almost linear and all the aforementioned samples demonstrate elastic behavior, in other words, Hook's Law is valid within this region. Note that the elastic region has been approximated by linear regression (strain less than 4%) and then the YM is determined by applying a curve fit to the corresponding generated data.59,60 Then the stress increases nonlinearly (i.e., Hook's law is no longer valid) until it reaches the UTS and then the magnitude of stress suddenly decreases. Due to the ductile nature of Ni and Al as reported earlier47,48,50–53,79–81 and its alloy,55 the materials do not fail catastrophically. Hence, in the stress–strain profiles, flow stress is observed to be present which originates from the plasticity/dislocation motion in the metallic structures.63,64 The zig-zag portion of the curve, known as plastic stress flow, is due to the nucleation, transformation, and junction of dislocations in materials during loading.63,64 Due to the tensile load, dislocations formed at different regions which interact and annihilate with each other, and thus leading to the final failure of the material.63,64At higher temperatures materials experience higher thermal fluctuation and lattice vibration, thus the interatomic mean distance between the atoms increases as well, which is depicted in Fig. 4(f). As a result, the tensile strength of materials decreases. For this reason, the UTS and YM show a decreasing trend with increasing temperature. This kind of trend is previously seen in other materials as well.59,60,68 From Fig. 4 (d), it can be seen that Ni3Al is showing high UTS compared to FGM alloys which can be credited to the absence of lattice mismatch in Ni3Al. Ni3Al has a lattice constant of 3.57 Ȧ with an FCC (L12) crystal structure as mentioned earlier, and the grading has been introduced by replacing aluminium atoms from the corner of Ni3Al crystal with nickel atoms. When the Ni–Al FGM samples have been designed in this way, this 3![[thin space (1/6-em)]](https://www.rsc.org/images/entities/char_2009.gif) :
:![[thin space (1/6-em)]](https://www.rsc.org/images/entities/char_2009.gif) 1 ratio of nickel and aluminium atoms in the Ni3Al crystal was not maintained. The grading introduced inhomogeneity in the ratio of nickel and aluminium in the different crystallographic planes of the alloy. For this reason, a lattice mismatch63,64 has been introduced in the samples. Table 2 represents lattice mismatch calculated during MD simulation for different grading functions.
1 ratio of nickel and aluminium atoms in the Ni3Al crystal was not maintained. The grading introduced inhomogeneity in the ratio of nickel and aluminium in the different crystallographic planes of the alloy. For this reason, a lattice mismatch63,64 has been introduced in the samples. Table 2 represents lattice mismatch calculated during MD simulation for different grading functions.
| Grading | Lattice mismatch |
|---|---|
| Elliptical | ∼1.13% |
| Linear | ∼1.24% |
| Parabolic | ∼1.30% |
At low temperatures (100 K), the effect of lattice mismatch dominates the stress–strain relation. So the UTS for parabolic grading is the least (∼15.65 GPa) and that of elliptical grading is the highest (∼16.57 GPa). However, further analysis reveals that the UTS of elliptical profiles is the least (∼10.7 GPa) at very high temperatures (600 K). That is because nickel is always hard, even at high temperatures while aluminium becomes soft at high temperatures.47,49,51,52 In the case of elliptical grading, the concentration of aluminium atoms is higher than the other profiles (Fig. 1). At high temperatures, the softness of aluminium dominates over the lattice mismatch, and therefore, the UTS of Ni–Al alloy with elliptical grading is the lowest.
On the other hand, from Fig. 4(e), it can be noted that YM is higher for parabolic grading than the other profiles. Ni–Al FGM alloy system with parabolic grading has a higher nickel concentration than the others (Fig. 1). As nickel is more elastic than aluminium,47–54 so the parabolic profile shows more elasticity, i.e., YM. Moreover, YM is calculated as a linear elastic property in this study; the slope of the linear portion of the stress–strain curve, and the effect of lattice mismatch is prominent in the non-linear region. Hence, there is no effect of lattice mismatch in YM. Since the UTS is found in the non-linear region of stress–strain relation, the effect of lattice mismatch dominates more in the trend of UTS rather than YM.63,64
It is also evident from Fig. 4(a–e) that FGM alloys show better YM, failure resistance, and plasticity (flow stress) compared to Ni3Al alloy which is in good agreement with previous literature1–4 regarding the advantages of FGMs over conventional homogeneous alloys. Flow stress has been calculated as ∼0.35, ∼2.25, ∼3.5, and ∼2.8 GPa for Ni3Al, linear, elliptical, and parabolic FGM alloys, respectively at 300 K thus indicating better plasticity in FGM profiles compared to Ni3Al homogeneous alloy. Flow stress has been calculated from the average values of stress corresponding to strain 0.14 to 0.25.63,64 Thus, it can be said that grading the Ni–Al alloy functionally can be an effective way to enhance or modulate the mechanical properties of the homogeneous alloy. It could also be inferred that modulation of materials' properties utilizing functional grading is not only applicable for Ni–Al alloy but also for other intermetallic alloys which have promising application in industries. Additionally, functional grading could be a robust methodology to tune the tensile properties (i.e., UTS, YM, failure resistance, and plasticity) of this type of alloy. Though the UTS is marginally reduced due to the grading, other properties such as YM, and flow stress are modulated considerably.
3.2 Impact of crystal directions
Initial coordinates of the linearly graded Ni3Al alloy along different crystallographic direction has been illustrated in Fig. 5. Fig. 6–8 represent the tensile mechanical properties of Ni–Al FGM alloy for linear, elliptical, and parabolic grading, respectively, along [100], [110], and [111] crystal orientations. Fig. 6(b), 7(b), and 8(b) demonstrate variations of UTS with temperature for linear, elliptical, and parabolic grading, respectively.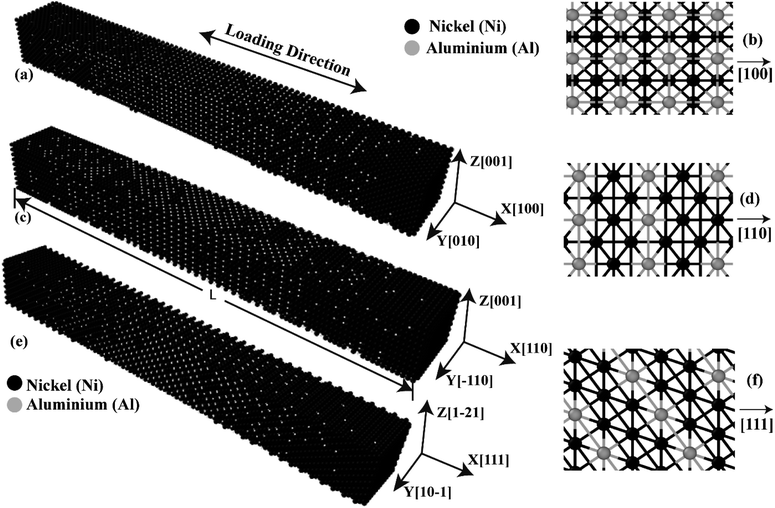 | ||
| Fig. 5 Initial coordinates of FGM alloys in (a) [100] (c) [110] (e) [111] crystal directions. Atomistic representation of FGM alloys along the (b) [100] (d) [110] [f] [111] crystal directions. | ||
The energy that would be required splitting an infinite (bulk) crystal into two sections along with a specific crystallographic plane per unit of surface area, or the energy required to produce a surface from a crystalline lattice, is known as the surface energy (SE) of an alloy. Assume that an ideal crystalline lattice, having total energy of E0 has been split up into two sections, and whose energies are Eα and Eβ, respectively, along a particular crystallographic plane with a surface area of S. Therefore, the SE would be,74
 | (1) |
It has been found that [111] crystal direction shows the largest UTS, followed by [100] and [110] orientations. It has been reported earlier that [111] crystal orientation has the lowest SE81,82 so it has the highest UTS, followed by [100] and [110] crystal orientations for fcc lattice structure which is in good agreement with the results from these MD simulations.81 Correlation between SE and UTS could be attributed to the fact that since [111] crystal orientation demonstrates the largest surface atomic distance, viz., the density of the surface atom is minimum thus it exhibits the lowest SE, followed by [100] and [110] orientations for the L12 (family of fcc lattice) lattice structured materials such as Ni3Al. The lowest density of atom, viz., lowest SE of [111] orientation makes it more stable crystal structure as well as to endure more tensile strain. This kind of trend (UTS, [111] > [100] > [110]) have been reported for fcc Cu NW83 as well. Table 3 represents the SE for FGM linear along with three different crystal orientations by MD calculation, and the corresponding values have been compared with the SE of Ni3Al alloy.
| Crystal orientation | The present study for FGM alloy (MD calculation), σ (Jm−2) | Existing literature for Ni3Al alloy, σ (J m−2)81 |
|---|---|---|
| [100] | ∼2550 | ∼2488 |
| [110] | ∼2720 | ∼2670 |
| [111] | ∼2410 | ∼2357 |
The reasonable agreement between the MD simulation and literature data implies that the simulation method used to identify the effect of crystal orientation on the tensile strength of Ni3Al FGMs is reliable. In [110] direction, due to the atomic arrangements in the crystal plane, there is a fast accumulation of stress when the tensile load is applied. The fast accumulation leads to higher YM than the [100] direction. The largest YM for [111] crystal orientation, followed by [110] and [100] orientation has been reported for Ni3Al alloy by Luan et al.56 utilizing the first principle calculation which shows excellent conformity with the present MD simulation. Therefore, it can be said that target specific crystal growth can be a way to tune the tensile properties while manufacturing FGM alloys.
3.3 Impact of vacancy defects
A vacancy usually forms when such an atom is removed from its original lattice location. As a result, vacancy creates a vacant lattice site, as shown in Fig. S2.† The neighboring atom is stretched due to the vacancy defect. Any substance with a temperature higher than absolute zero can have vacancies. Importantly, the amount of vacancy defects grows exponentially while the temperature rises.84 The number of vacancies inside a given volume of solid at a given temperature (T) could be numerically expressed by the equation below.84
 | (2) |
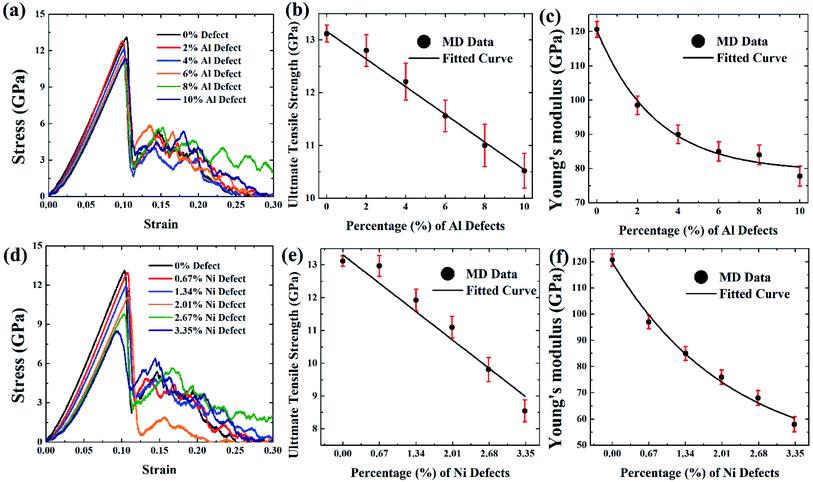
Design and manufacturing defects are inevitable during the manufacturing of FGMs which may lead to the reduction of strength in FGMs. Knowing the types of defects, mechanisms for producing them, how they affect the tensile strength, and the identification methodologies for assessing the mechanical properties and quality assurance are very important.85 Atomic defects are found in alloys, mainly vacancies, other point defects, and line defects. These deficiencies can happen during the manufacturing processes of alloy products by ion or electron irradiation.86 FGMs' manufacturing process is extremely sensitive to defects, and vacancy defects are expected due to their processing technique. So in this section, the effect of vacancy defects on the tensile properties of FGMs is discussed, and the corresponding MD results are depicted in Fig. 9–11.
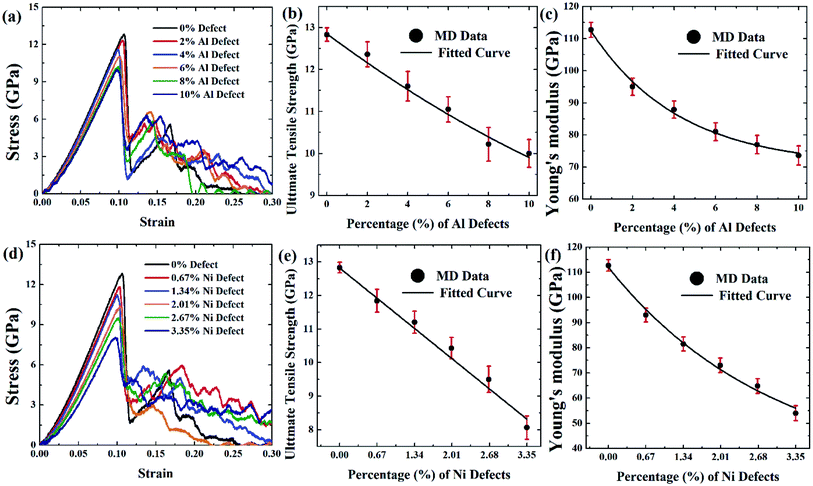
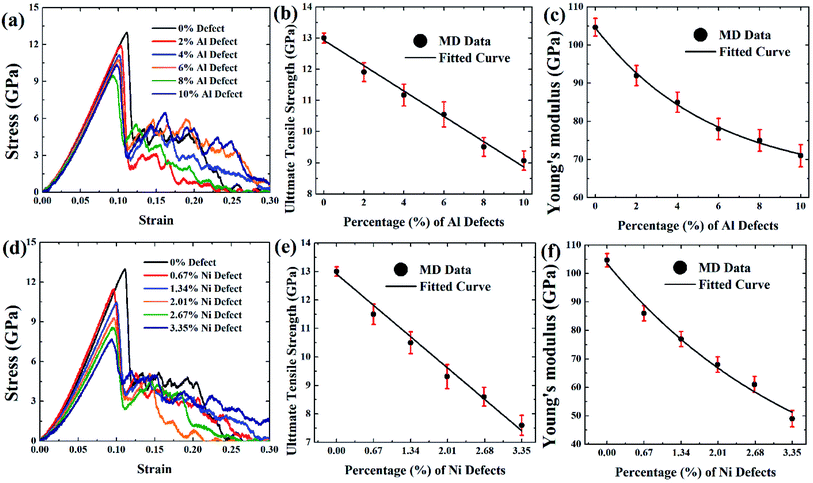
Fig. 9(a and d), Fig. 10(a and d), and Fig. 11(a and d) depict the stress–strain curves of [100] crystal oriented FGM linear, FGM elliptical, and FGM parabolic profiles, respectively, for different proportions of aluminium and nickel vacancy, at 300 K. As it is mentioned earlier, Ni3Al includes nickel and aluminium atom by 3![[thin space (1/6-em)]](https://www.rsc.org/images/entities/char_2009.gif) :
:![[thin space (1/6-em)]](https://www.rsc.org/images/entities/char_2009.gif) 1 ratio, so the vacancy is introduced by following the inverse of this ratio that is 1
1 ratio, so the vacancy is introduced by following the inverse of this ratio that is 1![[thin space (1/6-em)]](https://www.rsc.org/images/entities/char_2009.gif) :
:![[thin space (1/6-em)]](https://www.rsc.org/images/entities/char_2009.gif) 3 so that the effect of the vacancy on the tensile strength of this alloy can be understood when the same amount of atom is removed. It is evident that as vacancy concentration increases, the peak value of the stress–strain curve that is UTS reduces. These results are translated into Fig. 9(b–c, e, f), Fig. 10(b–c, e, f), and Fig. 11(b–c, e, f) for comprehensive understating which depict the variation of UTS and YM for aluminium vacancies and variation of UTS and YM for nickel vacancies, respectively for FGM linear, FGM elliptical, and FGM parabolic profiles, respectively. It is obvious from these figures that as the vacancy concentration increases both UTS and YM decrease monotonically.
3 so that the effect of the vacancy on the tensile strength of this alloy can be understood when the same amount of atom is removed. It is evident that as vacancy concentration increases, the peak value of the stress–strain curve that is UTS reduces. These results are translated into Fig. 9(b–c, e, f), Fig. 10(b–c, e, f), and Fig. 11(b–c, e, f) for comprehensive understating which depict the variation of UTS and YM for aluminium vacancies and variation of UTS and YM for nickel vacancies, respectively for FGM linear, FGM elliptical, and FGM parabolic profiles, respectively. It is obvious from these figures that as the vacancy concentration increases both UTS and YM decrease monotonically.
These results may be credited to the stress field's integrity being undermined by missing random atoms. Bond breakage happens once the coherent force is disrupted by atomic fluctuation, leading to a damaged structure and a rise in the structure's potential energy. When an atom is removed from a system, it leaves a void around it as well as several dangling bonds.86–88 Moreover, it contributes to functional disturbances around the removed atoms by causing more oscillation at the corresponding bonds. Therefore, both stress accumulation and physical instability take place in a stretched matrix.86–88 Eventually, the concentration of stress all around vacancy defect leads to the weakening of bond strength of the adjacent member, and the formation of the initial fracture. As a result, the bonds in the defective area may break much more quickly. Because of the effect of stress accumulation, the tensile strength and critical strain of the system dramatically weakens as the number of defects rises.86–88 In fact, this stress concentration causes the bonds to break much earlier during the deformation process at the defected region, resulting in a reduction of the UTS as well as YM of the faulty materials86–88
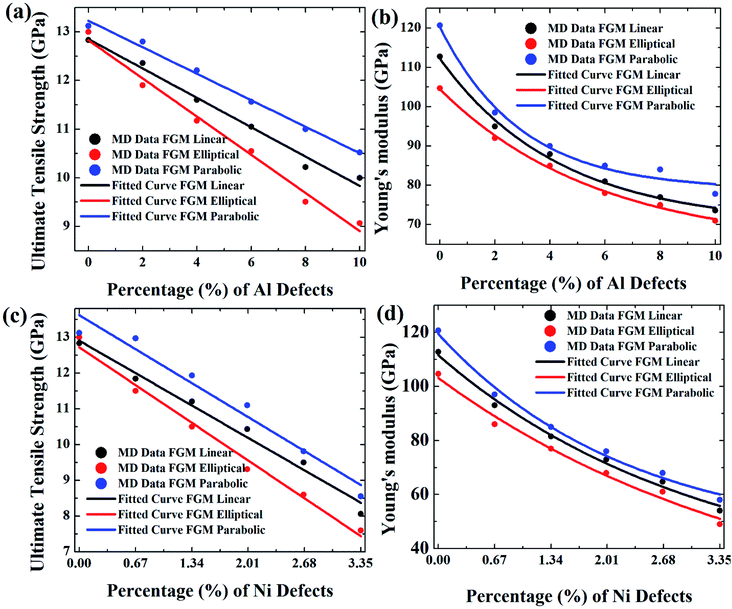
Results from Fig. 9–11 are translated into Fig. 12 to get better intuition. MD results suggest that only 10% random removal of the aluminium atom can reduce the UTS and YM by ∼22% and ∼34%, ∼29% and ∼35%, ∼20%, and ∼32%, respectively, for FGM linear, FGM elliptical, and FGM parabolic profiles, respectively. On the other hand, only 3.35% random removal of nickel atom reduces the UTS and YM of FGM alloy by ∼38% and ∼52%, ∼42% and ∼54%, ∼34%, and ∼51%, respectively, for FGM linear, FGM elliptical, and FGM parabolic profiles, respectively. This kind of vacancy-induced tensile properties (i.e., UTS and YM) is also reported for GaN NW.89
However, it is marked that the tensile strength of FGM alloys is much sensitive to nickel defects compared to aluminium defects. This is because the atomic size of a nickel (149 pm) is larger than aluminium (118 pm), hence, nickel vacancy creates a larger void in FGM crystal. Consequently, the degree of structural instability and stress concertation around the missing atom is larger for nickel vacancy compared to aluminium vacancy. Therefore, it could be inferred that the atomic size of the missing atoms plays an important role that degrades the tensile properties of materials. This finding also establishes the validity of the MD approach with continuum mechanics and experimental evidence.90
From Fig. 12, it can be interpreted that, the tensile strength of the FGM parabolic profile exhibits good resilience against vacancy defects, followed by FGM linear and FGM elliptical. Since FGM parabolic contains the highest number of Ni atoms, followed by FGM linear and FGM elliptical profiles, and it is already discussed that Ni is much harder than Al, for this reason, the tensile strength of FGM parabolic demonstrates good resistance to vacancy defects.
3.4 Failure mechanism of FGM alloy at different temperatures
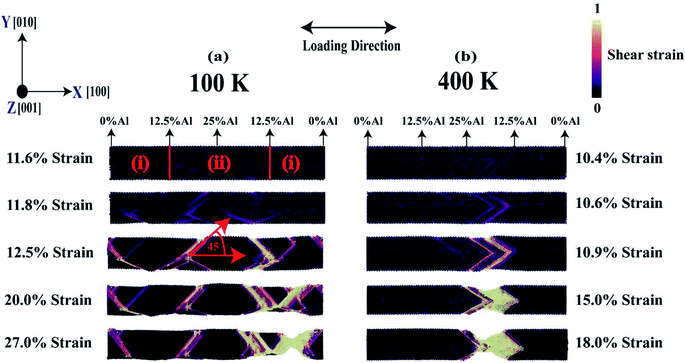
Fig. 13(a) and (b) display the failure mechanism of [100] crystal-orientated FGM with linear profile at 100 K and 400 K, respectively, for various strain levels in terms of shear strain parameters. The most common mechanism of plastic deformation in materials is slip. Slip is the process of sliding crystal blocks over each other along crystallographic planes recognized as slip planes. When applied shear stress exceeds a critical value, slip occurs. On the other hand, the appearance of plastic deformation alerts that failure is inevitable for ductile fracture, allowing for preventive action. Secondly, more strain energy is required to induce ductile fracture, because these materials are usually harder than brittle materials.90 As mentioned earlier, Ni, Al, and its alloy are ductile, failure mechanism for Ni–Al FGM alloy, predicted by this MD simulation is also convenient with continuum mechanics and literature.49,51,52From Fig. 13, it is observed that shear bands are formed at 11.8% strain and 10.6% strain for 100 K, and 400 K, respectively. Interestingly, it is also observed that at low temperature, the shear bands form in a distributed way whereas, at high temperature, the shear bands are concentrated in a definite position. This causes an increase in local stress concentration which leads to early failure at high temperatures. On the other hand, in the case of low temperature, the distributed shear bands don't allow stress to build up in a local region at a low strain. Because of the low temperature, the atom's fluctuation from its mean position is not very rapid. However, as the strain keeps increasing, the atom moves from its equilibrium and the local pile-up of shear bands is evident which ultimately causes failure. It is also evident that at low-temperature, the material undergoes substantial plastic deformation and strain hardening, sliding of crystals over one another along crystallographic planes that are slip planes. This is because, at low-temperature, atoms in the crystal plane don't experience notable thermal vibration. It can also be visualized from Fig. 13(a) that at 27% strain, stress concentration causes necking. Note that the necking takes place in a region where the proportion of aluminium is very low, ∼6.5%, and lattice mismatch in this region is high. On the other hand, at 400 K, the stress concentration and necking occurs near the middle region where the concentration of aluminium is ∼18.5%. It is known that aluminium becomes softer at high temperatures. Hence, the failure occurs by necking in the aluminium enriched region of the alloy. So, it can be said that at low-temperature, failure behavior is mainly dictated by the lattice mismatch effect but at high-temperature, the failure mechanism is dominated by interatomic bond strength between atoms in the crystal. Additionally, at both temperatures, the shear band has been seen to make 450 degrees with alloy axis thus indicates that {111} slip plane is activated which is energetically favorable for fcc crystal. Furthermore, slip propagates along with <1![[1 with combining macron]](https://www.rsc.org/images/entities/char_0031_0304.gif) 1> direction.90
1> direction.90
Besides, with the aid of DXA (dislocation extraction algorithm) analysis,91 at 100 K, the type of dislocation is mainly Shockley partial type (1/6<112>).91 Shockley partial dislocations typically refer to a pair of dislocations that may lead to stacking faults. This pair of partial dislocations will allow movement of dislocation by allowing for an alternate path to atomic motion. Previously it has been reported that two of this kind of partial dislocation of Shockley can be incorporated into a balanced dislocation, (1/6<112>) + (1/6<112>) = (1/2<110>).63,64 On the other side, at 400 K the type of dislocation is mainly Stair rod type (1/6<110>). This type of dislocation evolves when a glide plane transitions to a dissociated dislocation. In many cases, this situation happens, for example, when two dislocations align at the intersection of their glide planes to establish junctions.91
4. Conclusions
In summary, the effect of FGM profiles, temperature, crystal orientations, and vacancy concentration on the tensile behavior of functionally graded Ni–Al alloy with Ni coating has been studied thoroughly. EAM potential has been used to define the interatomic interaction between atoms in the dynamic system. Based on the MD simulation, it is found that the stress–strain curves demonstrate ductile failures for Ni3Al, linearly, parabolically, and elliptically graded Ni–Al alloy. As temperature increases from 100 K to 600 K, mechanical properties such as UTS, and YM decrease thus showing an inverse relationship with temperature. The main findings of this study are tensile properties of Ni3Al homogeneous alloy such as tensile strength, YM, flow stress, and failure resistance could be modulated via functional grading. Results from MD simulation also suggest that functional grading reduces the UTS of Ni3Al homogeneous alloy but enhances the YM. It is also found that [111] crystallographic orientation of FGM alloys shows the largest UTS, followed by [100] and [110] orientation while [111] orientation exhibits the largest YM, followed by [110], and [100] orientation. It has been realized that at low-temperature lattice mismatch dominates the tensile strength as well as failure mechanism of FGM alloys, but at high temperature due to softness of the aluminium, the effect of lattice mismatch is low. Moreover, it has been observed that vacancy defects degrade the tensile strength of FGM alloys substantially, and the tensile strength of Ni–Al FGM alloy is seen to be more sensitive to nickel vacancy compared to aluminium vacancy. Furthermore, MD results propose that elliptical grading is more likely to suffer from vacancy defects, followed by linear and parabolic grading. Finally, failure analysis of linearly graded FGM alloy recommends that at 100 K, shear bands forms in a distributed way while at 400 K, shear bands are concentrated at a definite position, and upon further stretching the cross-section of the alloy reduces eventually and causes necking. Interestingly, at 100 K, necking occurs at those crystallographic planes where lattice mismatch is quite high, while at 400 K, necking occurs from aluminium enriched crystal planes. Overall, this article can serve as a comprehensive way to learn the details of the tensile properties of Ni–Al FGM alloys, and the way to tune the mechanical properties of Ni–Al alloy by employing functional grading.Conflicts of interest
We hereby declare that there is no conflict of interest.Acknowledgements
The authors of this research would like to thank the Department of Mechanical Engineering, Bangladesh University of Engineering and Technology (BUET), and the MMMRN group, BUET, Bangladesh, for their support in conducting this research.References
- G. Udupa, S. Rao and K. Gangadharan, Procedia Mater. Sci., 2014, 5, 1291–1299 CrossRef CAS.
- F. Tarlochan, J. Appl. Mech. Eng., 2013, 02(02) DOI:10.4172/2168-9873.1000e115.
- B. Henriques, Journal of Powder Metallurgy & Mining, 2013, 02(03) DOI:10.4172/2168-9806.1000e112.
- Y. Miyamoto, W. Kaysser, B. Rabin, A. Kawasaki and R. Ford, Functionally Graded Materials, Springer, New York, NY, 2013 Search PubMed.
- R. Wetherhold, S. Seelman and J. Wang, Compos. Sci. Technol., 1996, 56, 1099–1104 CrossRef CAS.
- N. Zhang, T. Khan, H. Guo, S. Shi, W. Zhong and W. Zhang, Adv. Mater. Sci. Eng., 2019, 2019, 1–18 Search PubMed.
- Y. Shabana and N. Noda, Composites, Part B, 2001, 32, 111–121 CrossRef.
- B. Kieback, A. Neubrand and H. Riedel, Mater. Sci. Eng., A, 2003, 362, 81–106 CrossRef.
- M. Gasik, Int. J. Mater. Prod. Technol., 2010, 39, 20 CrossRef CAS.
- D. Sarathchandra, S. Kanmani Subbu and N. Venkaiah, Mater. Today: Proc., 2018, 5, 21328–21334 Search PubMed.
- D. Delfosse, Mater. Today, 1998, 1, 18 CrossRef.
- J. Gandra, R. Miranda, P. Vilaça, A. Velhinho and J. Teixeira, J. Mater. Process. Technol., 2011, 211, 1659–1668 CrossRef CAS.
- M. Zhou, J. Xi and J. Yan, J. Mater. Process. Technol., 2004, 146, 396–402 CrossRef CAS.
- S. A. Qasim and N. Gupta, IEEE International Conference on Properties and Applications of Dielectric Materials, 2015, pp. 232–235 Search PubMed.
- K. Maalawi, Optimum Composite Structures, 2019 Search PubMed.
- C. CUI and J. SUN, Dent. Mater. J., 2014, 33, 173–178 CrossRef PubMed.
- J. Reddy and C. Chin, Journal of Thermal Stresses, 1998, 21, 593–626 CrossRef.
- B. Chen and L. Tong, Mater. Des., 2004, 25, 663–672 CrossRef.
- A. Al-Maqtari, A. Razak and M. Hamdi, Dent. Mater. J., 2014, 33, 458–465 CrossRef PubMed.
- T. Hirano, J. Teraki and Y. Nishio, Mater. Sci. Forum, 1999, 308–311, 641–646 CAS.
- J. Choi and J. Cho, Mater. Sci. Forum, 2008, 569, 121–124 CAS.
- M. Ganapathi, Compos. Struct., 2007, 79, 338–343 CrossRef.
- M. Najafizadeh and M. Eslami, Int. J. Mech. Sci., 2002, 44, 2479–2493 CrossRef.
- B. Akgöz and Ö. Civalek, Composites, Part B, 2013, 55, 263–268 CrossRef.
- T. Nguyen, K. Sab and G. Bonnet, Compos. Struct., 2008, 83, 25–36 CrossRef.
- J. Abanto-Bueno and J. Lambros, Eng. Fract. Mech., 2002, 69, 1695–1711 CrossRef.
- L. You, H. Ou and Z. Zheng, Compos. Struct., 2007, 78, 285–291 CrossRef.
- M. Krumova, C. Klingshirn, F. Haupert and K. Friedrich, Compos. Sci. Technol., 2001, 61, 557–563 CrossRef CAS.
- H. Li, J. Lambros, B. Cheeseman and M. Santare, Int. J. Solids Struct., 2000, 37, 3715–3732 CrossRef.
- M. Nejad, A. Rastgoo and A. Hadi, Int. J. Eng. Sci., 2014, 85, 47–57 CrossRef.
- J. Durodola and O. Attia, Compos. Sci. Technol., 2000, 60, 987–995 CrossRef CAS.
- M. Nemat-Alla, Int. J. Solids Struct., 2003, 40, 7339–7356 CrossRef.
- J. Sladek, V. Sladek and C. Zhang, Comput. Mater. Sci., 2003, 28, 494–504 CrossRef.
- K. Dai, G. Liu, X. Han and K. Lim, Comput. Struct., 2005, 83, 1487–1502 CrossRef.
- M. Chmielewski and K. Pietrzak, Bull. Pol. Acad. Sci.: Tech. Sci., 2016, 64, 151–160 CAS.
- P. Jozwik, W. Polkowski and Z. Bojar, Materials, 2015, 8, 2537–2568 CrossRef CAS.
- W. Polkowski, P. Jóźwik and Z. Bojar, J. Alloys Compd., 2014, 614, 226–233 CrossRef CAS.
- G. Dey, Cheminf., 2003, 34 Search PubMed.
- Y. Huang, X. Zeng, X. Hu and F. Liu, Electrochim. Acta, 2004, 49, 4313–4319 CrossRef CAS.
- R. Smith, G. Lewi and D. Yates, Aircr. Eng., 2001, 73, 138–147 CrossRef.
- S. Hallwood and P. Wallis, Aircr. Eng., 1965, 37, 178–181 CrossRef.
- P. Caron and T. Khan, Aerosp. Sci. Technol., 1999, 3, 513–523 CrossRef.
- N. Arakere and G. Swanson, J. Eng. Gas Turbines Power, 2000, 124, 161–176 CrossRef.
- R. Hashizume, A. Yoshinari, T. Kiyono, Y. Murata and M. Morinaga, Energy Mater., 2007, 2, 5–12 CrossRef CAS.
- S. Nosewicz, J. Rojek, S. Mackiewicz, M. Chmielewski, K. Pietrzak and B. Romelczyk, J. Compos. Mater., 2013, 48, 3577–3589 CrossRef.
- D. Kalinski, M. Chmielewski, K. Pietrzak and K. Choregiewicz, Arch. Metall. Mater., 2012, 57, 695–702 CAS.
- H. Chabba, M. Lemaallem, A. Derouiche and D. Dafir, J. Mater. Environ. Sci., 2018, 9, 93–99 CAS.
- K. Kadau, P. Lomdahl, B. Holian, T. Germann, D. Kadau, P. Entel, D. Wolf, M. Kreth and F. Westerhoff, Metall. Mater. Trans. A, 2004, 35, 2719–2723 CrossRef.
- F. G. Sen, A. T. Alpas, A. C. T. van Duin and Y. Qi, Nat. Commun., 2014, 5(1) DOI:10.1038/ncomms4959.
- P. Branício and J. Rino, Phys. Rev. B: Condens. Matter Mater. Phys., 2000, 62, 16950–16955 CrossRef.
- A. Setoodeh, H. Attariani and M. Khosrownejad, Comput. Mater. Sci., 2008, 44, 378–384 CrossRef CAS.
- W. Wang, C. Yi and K. Fan, Trans. Nonferrous Met. Soc. China, 2013, 23, 3353–3361 CrossRef CAS.
- D. Huang, Q. Zhang and P. Qiao, Comput. Mater. Sci., 2011, 50, 903–910 CrossRef CAS.
- H. Yang, Y. Lü, M. Chen and Z. Guo, Sci. China, Ser. G: Phys., Mech. Astron., 2007, 50, 407–413 CrossRef CAS.
- Y. Wang, G. Gao and S. Ogata, Appl. Phys. Lett., 2013, 102, 041902 CrossRef.
- X. Luan, H. Qin, F. Liu, Z. Dai, Y. Yi and Q. Li, Crystals, 2018, 8, 307 CrossRef.
- C. Manning, Language, 2005, 81, 740–742 CrossRef.
- P. Hirel, Comput. Phys. Commun., 2015, 197, 212–219 CrossRef CAS.
- M. Munshi, S. Majumder, M. Motalab and S. Saha, Mater. Res. Express, 2019, 6, 105083 CrossRef CAS.
- T. Pial, T. Rakib, S. Mojumder, M. Motalab and M. Akanda, Phys. Chem. Chem. Phys., 2018, 20, 8647–8657 RSC.
- S. Plimpton, J. Comput. Phys., 1995, 117, 1–19 CrossRef CAS.
- A. Stukowski, Modell. Simul. Mater. Sci. Eng., 2009, 18, 015012 CrossRef.
- S. Mojumder, T. Rakib and M. Motalab, J. Nanopart. Res., 2019, 21 Search PubMed.
- S. Mojumder, Phys. Rev. B: Condens. Matter Mater. Phys., 2018, 530, 86–89 CrossRef CAS.
- T. Rakib, S. Saha, M. Motalab, S. Mojumder and M. Islam, Sci. Rep., 2017, 7, 14629 CrossRef PubMed.
- M. Rahman, E. Chowdhury, D. Redwan, S. Mitra and S. Hong, Phys. Chem. Chem. Phys., 2021, 23, 5244–5253 RSC.
- M. H. RahmanS. MitraM. MotalabT. Rakib, Investigation on the Temperature and Size Dependent Mechanical Properties and Failure Behavior of Zinc Blende (ZB) Gallium Nitride (GaN) Semiconducting Nanowire, in 2020 IEEE Region 10 Symposium, TENSYMP, Institute of Electrical and Electronics Engineers Inc., 2020, pp. 22–25, DOI:10.1109/TENSYMP50017.2020.9230906.
- M. Arshee, S. Adnan, M. Motalab and P. Bose, RSC Adv., 2019, 9, 34437–34450 RSC.
- E. Chowdhury, M. Rahman, R. Jayan and M. Islam, Comput. Mater. Sci., 2021, 186, 110001 CrossRef CAS.
- M. Rahman, E. Chowdhury and M. Islam, J. Nanopart. Res., 2020, 22 Search PubMed.
- M. Rahman, S. Mitra, M. Motalab and P. Bose, RSC Adv., 2020, 10, 31318–31332 RSC.
- E. Chowdhury, M. Rahman, P. Bose, R. Jayan and M. Islam, Phys. Chem. Chem. Phys., 2020, 22, 28238–28255 RSC.
- E. Chowdhury, M. Rahman, S. Fatema and M. Islam, Comput. Mater. Sci., 2021, 188, 110231 CrossRef CAS.
- M. Rahman, E. Chowdhury and S. Hong, Surf. Interfaces, 2021, 26, 101371 CrossRef.
- M. Rahman, E. Chowdhury, M. Bin Shahadat and M. Islam, Comput. Mater. Sci., 2021, 191, 110338 CrossRef CAS.
- M. Motalab, R. Paul, S. Saha, S. Mojumder, T. Ahmed and J. Suhling, J. Mol. Model., 2019, 25, 59 CrossRef CAS PubMed.
- M. Rahman, E. Chowdhury, D. Redwan and S. Hong, Comput. Mater. Sci., 2021, 190, 110272 CrossRef CAS.
- H. Sun, L. Chen, S. Sun and T. Zhang, Sci. China: Technol. Sci., 2018, 61, 687–698 CrossRef CAS.
- L. Wang, C. Peng and J. Gong, Phys. Rev. B: Condens. Matter Mater. Phys., 2010, 405, 1721–1724 CrossRef CAS.
- P. Kaminskii and V. Kuznetsov, Russ. Phys. J., 1986, 29, 982–986 Search PubMed.
- V. Kim and V. Kuznetsov, Russ. Phys. J., 1994, 37, 985–989 CrossRef.
- M. Wen and C. Wang, RSC Adv., 2016, 6, 77489–77498 RSC.
- C. Qiao, Y. Guo, Z. Wang, Y. Zheng, R. Zhang, L. Chen, Y. Chen, W. Su, Y. Jia and S. Wang, J. Mater. Sci., 2017, 52, 13237–13246 CrossRef CAS.
- C. Kinoshita and T. Eguchi, Acta Metall., 1972, 20, 45–52 CrossRef CAS.
- H. Taheri, M. Shoaib, L. Koester, T. Bigelow, P. Collins and L. Bond, International Journal of Additive and Subtractive Materials Manufacturing, 2017, 1, 172 CrossRef.
- Z. Sha, Q. Pei, Y. Zhang and Y. Zhang, Nanotechnology, 2016, 27, 315704 CrossRef PubMed.
- X. Sun, Z. Fu, M. Xia and Y. Xu, Theor. Appl. Mech. Lett., 2014, 4, 051002 CrossRef.
- N. Jing, Q. Xue, C. Ling, M. Shan, T. Zhang, X. Zhou and Z. Jiao, RSC Adv., 2012, 2, 9124 RSC.
- S. Xie, S. Chen and A. Soh, Chin. Phys. Lett., 2011, 28, 066201 CrossRef.
- W. Callister and D. Rethwisch, Materials Science and Engineering, Wiley, New York, 9th edn, SI Version, 2014 Search PubMed.
- A. Stukowski, V. Bulatov and A. Arsenlis, Modell. Simul. Mater. Sci. Eng., 2012, 20, 085007 CrossRef.
Footnote |
| † Electronic supplementary information (ESI) available. See DOI: 10.1039/d1ra04571g |
| This journal is © The Royal Society of Chemistry 2021 |


