 Open Access Article
Ni2Mn-layered double oxide electrodes in organic electrolyte based supercapacitors†
Jindui Honga,
Chunping Chena,
Ampornphan Siriviriyanunb,
Dana-Georgiana Crivoia,
Philip Holdwayc,
Jean-Charles Buffet a and
Dermot O'Hare
 *a
*a
aChemistry Research Laboratory, Department of Chemistry, University of Oxford, 12 Mansfield Road, Oxford, OX1 3TA, UK. E-mail: dermot.ohare@chem.ox.ac.uk
bSCG Chemicals Co., Ltd., 1 Siam Cement Rd, Bangsue, Bangkok, 10800, Thailand
cDepartment of Materials, University of Oxford, Parks Road, Oxford, OX1 3PH, UK
First published on 10th August 2021
Abstract
The development of future mobility (e.g. electric vehicles) requires supercapacitors with high voltage and high energy density. Conventional active carbon-based supercapacitors have almost reached their limit of energy density which is still far below the desired performance. Advanced materials, particularly metal hydroxides/oxides with tailored structure are promising supercapacitor electrodes to push the limit of energy density. To date, research has largely focused on evaluation of these materials in aqueous electrolyte, while this may enable high specific capacitance, it results in low working voltage window and poor cycle stability. Herein, we report the development of Ni2Mn-layered double oxides (Ni2Mn-LDOs) as mixed metal oxide-based supercapacitor electrodes for use in an organic electrolyte. Ni2Mn-LDO obtained by calcination of [Ni0.66Mn0.33(OH)2](CO3)0.175·nH2O at 400 °C produced the best performing Ni2Mn-LDOs with high working voltage of 2.5 V and a specific capacitance of 44 F g−1 (at 1 A g−1). We believe the performance of the Ni2Mn-LDOs is related to its unique porous structure, high surface area and the homogeneous mixed metal oxide network. Ni2Mn-LDO outperforms both the single metal oxides (NiO, MnO2) and the equivalent physical mixture of the two oxides. We propose this performance boost arises from synergy between NiO and MnOx due to a more effective homogeneous network of NiO/MnOx domains in the Ni2Mn-LDO. This work clearly shows the advantage of an LDO over the single component metal oxides as well as the physical mixture of mixed metal oxides and highlights the possibilities of development of further mixed metal oxides-based supercapacitors in organic electrolyte using LDH precursors.
Introduction
Supercapacitors together with the complementary Li-ion batteries are envisaged to power the future of mobility.1,2 Currently, the dominant supercapacitors in the market are made of active carbons using organic electrolyte. Despite their low-cost, high rate capacity and excellent cycle stability, the maximum energy density is only up to 10 W h kg−1 which limits their applications mainly to portable electronics and power backup.1,3 To enable their large-scale deployment in the transport sector, it is critical to develop supercapacitors with both high operating voltage and high energy density. Intensive research has occured on the development of advanced materials-based electrodes, particularly metal hydroxides/oxides because of their higher specific capacitance compared to conventional active carbon.4,5 To date, most of the studies have evaluated these materials in aqueous electrolyte, taking advantage of extra energy storage through the bulk redox reactions.5 However, the operating voltage of such aqueous system is generally limited as water in the electrolyte undergoes electrolysis beyond 1.23 V.6 The high specific capacitance of an aqueous system is compromised by the limited power density, low rate capacity and poor cycle stability as the bulk redox reactions are typically kinetic sluggishly, diffusion-controlled and not as reversible as the surface-limited electric double layer capacitance (EDLC)/pseudocapacitance. In comparison, organic electrolytes like tetraethylammonium tetrafluoroborate (TEABF4) have high breakdown voltage and are typically only involved in fast EDLC or pseudocapacitance, which has been widely used in commercial supercapacitors.6To achieve high specific capacitance without sacrificing the operating voltage, power capacity and cycle stability, metal oxide electrodes using organic electrolyte have been developed.7–11 Sugimoto et al. reported that NiO can achieve a wider working voltage and much higher energy density in organic electrolyte than in aqueous electrolyte.9 The composites of NiO/polypyrrole10 and NiO/carbon fibre cloth11 have also been developed to improve the electrochemical performance of NiO. Nesscap patented that MnO2 achieved better specific capacitance in the organic electrolyte with dual salts than that with single salt.12 Despite the above development, the use of mixed metal oxides in organic electrolytes remains relatively unexplored. Due to their complementary properties, mixed metal oxides have shown synergetic effects in many applications (e.g. catalysis,13,14 photocatalysis15 and batteries16,17). Individually, both NiO and MnO2 have been investigated as supercapacitor electrodes, displaying typical surface redox pseudocapacitance9,11 and bulk intercalation pseudocapacitance,18 respectively. We thought it could be highly rewarding to study mixed metal oxides for their potential advanced supercapacitor electrode, particularly in the organic electrolyte.
Layered double hydroxides (LDHs), are a big family of anion layered materials that have positively charged metal hydroxide layers and negatively charged anion interlayers.19–23 Transition metal-LDHs including [Ni0.66Mn0.33(OH)2](CO3)0.175·nH2O (Ni2Mn-LDH) have been widely studied as supercapacitor electrodes using aqueous alkaline electrolyte.24–30 By simple calcination of LDHs, they can be transformed into a unique type of mixed metal oxide often referred as layered double oxides (LDOs). LDOs have found applications in CO2 capture,31 catalysis,32 and batteries.33 LDOs were also developed as advanced supercapacitor electrode materials in aqueous electrolytes thanks to their better conductivity and unique structure.34 Herein, we report the use of Ni2Mn-LDO prepared by calcination of Ni2Mn-LDH as mixed metal oxides-based supercapacitor electrode in TEABF4/acetonitrile. We investigated the performance of Ni2Mn-LDO electrodes prepared at different calcination conditions including calcination temperature, ramping rate and hold time. Control samples including NiO, MnO2 and physical mixtures of NiO and MnO2 were also prepared and evaluated in the same organic electrolyte.
Experimental
Preparation of layered double hydroxides (LDHs) and layered double oxides (LDOs)
[Ni0.66Mn0.33(OH)2](CO3)0.175·nH2O (Ni2Mn-LDH; referred as LDH hereafter) was synthesised by a conventional co-precipitation method. 15 mmol Mn(NO3)2·4H2O (3.77 g) and 90 mmol NH4F (3.33 g) were dissolved in 180 mL deionised water and purged with O2 for 30 minutes while stirring. 30 mmol Ni(NO3)2·6H2O (8.72 g) was dissolved in 120 mL deionised water and added into the above light pink solution to form a green solution A. 75 mmol Na2CO3 (7.95 g) was dissolved in 150 mL deionised water and the pH was adjusted to be 11 by HNO3 (10 wt%, diluted from 70% HNO3) to get solution B. Solution B was added into solution A at a rate of 143 mL min−1 using a syringe pump (Model R99-E, Razel Scientific Instruments) while stirring (500 rpm). During the addition, O2 gas was bubbled through the reaction mixture to ensure oxidisation of the Mn2+. And the pH was controlled at 11 by adding NaOH (4 M) dropwise. The green solution turned to brown suspension and finally dark brown suspension. This suspension was stirred (500 rpm) for 18 h at 65 °C. The final product was filtered, washed with deionised water until pH 7 and dried overnight at room temperature in a vacuum oven.The as-obtained Ni2Mn-LDHs were calcinated in a crucible without lid in a box furnace in static air. The following conditions were investigated: (a) different calcination temperatures (200, 300, 400, 500, 600, 700 and 900 °C) with a fixed ramp rate of 5 °C min−1 and a holding time of 3 h, samples are referred as LDO200, LDO300, LDO400, LDO500, LDO600, LDO700 and LDO900, respectively; (b) different ramp rate (0.5, 5, 10, 30, 50 and 100 °C min−1) at fixed calcination temperatures of 400 °C and a holding time of 3 h; and c) different holding time (0.5, 1, 3, 6, 12 and 24 h) with fixed calcination temperature of 400 °C and a ramp rate of 5 °C min−1. Several control samples were also prepared: NiO was obtained from the calcination of Ni(OH)2 at 400 °C, 5 °C min−1 for 3 h. Commercial MnO2 was used alone and also physically mixed in with the as-synthesised NiO to give a 2![[thin space (1/6-em)]](https://www.rsc.org/images/entities/char_2009.gif) :
:![[thin space (1/6-em)]](https://www.rsc.org/images/entities/char_2009.gif) 1 Ni
1 Ni![[thin space (1/6-em)]](https://www.rsc.org/images/entities/char_2009.gif) :
:![[thin space (1/6-em)]](https://www.rsc.org/images/entities/char_2009.gif) Mn ratio as a further reference sample.
Mn ratio as a further reference sample.
Preparation of electrodes and electrochemical evaluation
Electrodes were prepared by mixing and grinding LDH or LDOs (80 wt%), carbon black (15 wt%) and PVDF (5 wt%) in 1-methyl-2-pyrrolidinone (NMP) solvent in a mortar to form a homogeneous slurry with a total solid content of about 15 wt%. The slurry was then coated on the pre-treated nickel foam with loading area of ca. 1 cm2 and loading mass of 5–10 mg cm−2. The electrodes were then dried overnight at 60 °C, then pressed using a manual hydraulic press (Specac) at 10 tons. Three-electrode cell (T-cell) test was carried out by using the pressed electrode as working electrode, Pt wire (7.5 cm, BASi MW-1032) as counter electrode and a low-leakage Ag/AgCl (5 mm diameter, Warner Instruments) as reference electrode, and 1 M tetraethylammonium tetrafluoroborate (TEABF4) in acetonitrile as electrolyte. Cyclic voltammetry (CV) was conducted over a potential range of −1.0 to 1.5 V at a scan rate of 1–100 mV s−1 for LDOs. Galvanostatic charge–discharge (GCD) was performed in the sweep potential range of −1.0 to 1.5 V for LDOs at 1 A g−1. Specific capacitance, Cs (F g−1) can be calculated from the Galvanostatic discharge profile using the equation below:
 | (1) |
Results and discussion
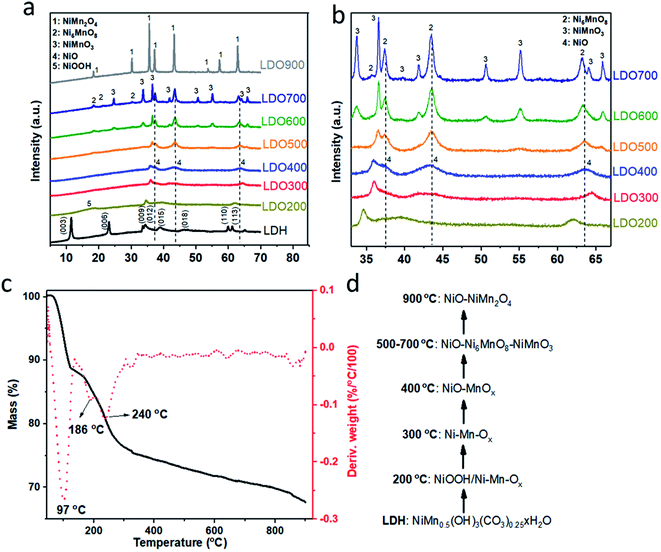
As shown in Scheme 1, various Ni2Mn-LDOs were prepared by initial formation of the Ni2Mn-LDH by co-precipitation of the metal salts, followed by the calcination from 200–900 °C. Fig. 1(a) and (b) show the XRD patterns of LDH and LDOs. The Bragg reflections at 2θ = 11.5°, 23.2°, 33.6°, 34.4°, 38.9°, 60.0°, 61.3° can be indexed to the (003), (006), (012), (015), (018), (110) and (113) reflections of Ni2Mn-LDH, respectively.24 After calcination at 200 °C, NiOOH (JCPDS #06-0141) and mixed Ni–Mn oxides (referred as Ni–Mn-Ox hereafter) are formed in LDO200 due to dehydration, dehydroxylation, decarbonation and hydroxide-oxide conversion of the LDH. At 300 °C, the Bragg reflections due to NiOOH disappear while the Bragg reflections arising from Ni–Mn-Ox shift to higher 2θ values indicating the different chemical composition and chemical status of Ni–Mn-Ox. No reflections from pure NiO or MnOx phases can be observed in the XRD patterns of LDO200 and LDO300. At 400 °C, the Bragg reflections due to NiO (JCPDS #44-1159) and MnOx can be observed which are formed from the thermal conversion of Ni–Mn-Ox. At 500 °C, the XRD data indicates the formation of Ni6MnO8 (JCPDS #42–0479) and NiMnO3 (JCPDS #12-0269). Their XRD patterns are partially overlapped with those of NiO. Between 500 and 700 °C, there is coexistence of NiO, Ni6MnO8 and NiMnO3, with Bragg peak intensity from Ni6MnO8 and NiMnO3 increasing with increasing calcination temperature. At 900 °C, NiO and the spinel NiMn2O4 (JCPDS #01-1110) coexist. Fig. 1(a) also shows that the crystallinity of LDOs increases with the calcination temperature and reaches a maximum at 900 °C. In addition to chemical composition, we are mindful that crystallinity changes could also contribute to the varied electrochemical performance due to different storage mechanism.35To further investigate the steps in LDH to LDO evolution, TGA was carried out for Ni2Mn-LDH to monitor the thermal decomposition of LDH in the temperature range of 45–900 °C. As shown in Fig. 1(c), there are typically three thermal event onsets/mass losses for the LDH at 97, 186 and 240 °C, corresponding to the loss of physisorbed/intercalated water, the metal hydroxide layer dehydroxlyation (oxyhydroxide)-metal oxide conversion and decarbonation, respectively. At 124 °C, there is a 11.1 wt% mass loss from the complete loss of moisture. By 300 °C, a further 13.0 wt% mass loss arising from carbonate decomposition and dehydroxlyation was observed. Combined with the XRD results in Fig. 1(a and b), the most likely transformation sequence with increasing temperature is shown in Fig. 1(d). The data suggests that the LDH converts to NiOOH and Ni–Mn-Ox initially (LDO200) and then transforms to another Ni–Mn-Ox phase at 300 °C (LDO300). At 400 °C, NiO and MnOx form separated nano-domained phases, which upon further heating transform into the mixture of NiO–Ni6MnO8–NiMnO3 from 500 °C until 700 °C. At 900 °C, these mixed metal oxides convert to the mixture of NiO and the spinel phase, NiMn2O4. This rich chemistry of LDH-LDO transformation provides series of LDOs with different phases and crystallinity for the study as supercapacitor electrodes.
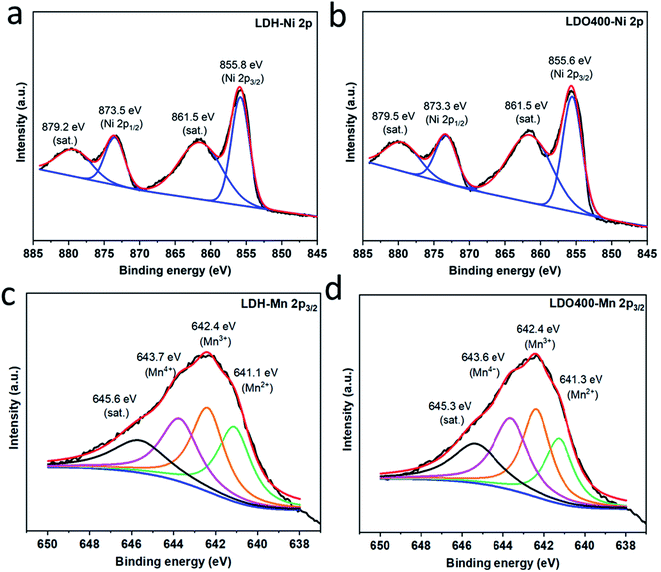
Fig. 2 and Fig. S1† show the Ni 2p3/2, Ni 2p1/2 and Mn 2p3/2 XPS spectra for Ni2Mn-LDH and the LDOs (LDO200, LDO300, LDO400, LDO700 and LDO900). Fig. 2(a) shows binding energies at 855.8 and 873.5 eV for the pristine LDH, which corresponding to the Ni2+ 2p3/2 and Ni2+ 2p1/2, respectively.36 The other two binding energies at 861.5 and 879.2 eV are corresponding to satellite peaks of Ni2+. Similar binding energies for Ni 2p are also found in LDO400 (Fig. 2(b)) and LDO300/LDO700/LDO900 (Fig. S1(b–d)†), confirming the oxidation state of Ni remains unchanged in these samples. Fig. S1(a)† shows that the Ni 2p peak of LDO200 is broad and can be deconvoluted into three peaks at 855.7, 858.2 and 862.9 eV, corresponding to Ni2+, Ni3+ and satellite peaks, respectively.36 The above results are consistent with the XRD results in Fig. 1(b) that indicates the presence of NiOOH in LDO200. Fig. 2(c-d) show very broad peaks for Mn (about 12 eV full width at half maximum, FWHM), which are more complicated to analyse due to the multiplet splitting and shakeup features.37 For all samples except LDO200, four main peaks can be fitted at about 641.1, 642.4, 643.7 and 645.6 eV (satellite peak), which suggest the co-existence of Mn2+, Mn3+ and Mn4+.38 Higher oxidation state of Mn were observed in LDO200 (Fig. S1(e)†) which could be the mixing of Mn3+, Mn4+ and even Mn5+. The higher oxidation state of Ni and Mn in LDO200 could be due to the oxidation of dehydrated hydroxides by oxygen from the calcination in air at 200 °C, but it is unclear for now how they are reduced to original chemical status when the calcination temperature is lifted above 200 °C.
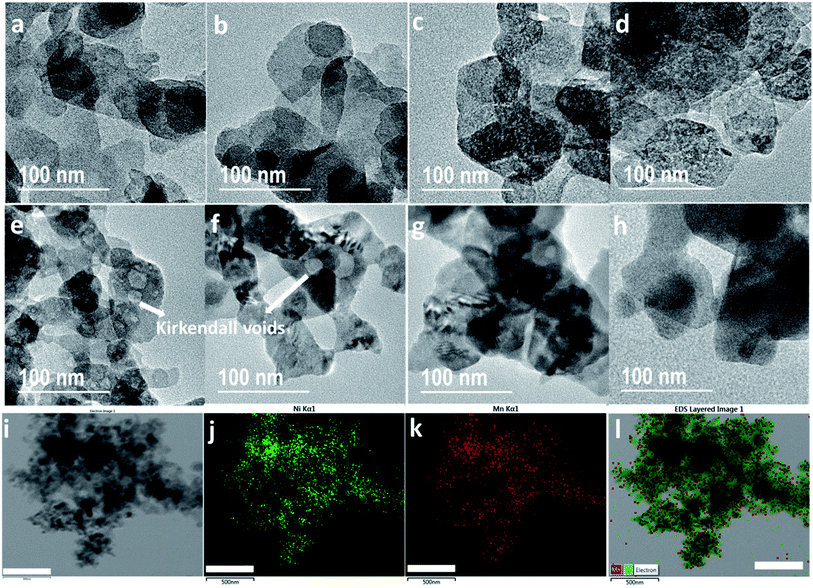
To study the effect of morphology, porosity and phases on electrode performance, TEM and BET have been carried out on both LDH and LDOs. Fig. 3(a) shows the platelet-like morphology of Ni2Mn-LDH with platelet diameters about 50–150 nm. A similar morphology is retained in LDO200 (Fig. 3(b)) despite the structural phase change to an LDO. Fig. 3(c and d) show well-distributed mesopores (2–4 nm) in LDO300 and LDO400. These mesopores are known as Kirkendall voids which are formed due to the difference in diffusivities of Ni and Mn atoms.39 As a result, LDO300 and LDO400 have the highest surface area and pore area (Fig. S2(a and b)†). These results demonstrate that LDOs with unique porous structures can be made from a simple and facile calcination method. In comparison, complex methods are typically required to make porous mixed metal oxides involving the synthesis with a template and subsequent template removal.40 Fig. 3(e and f) show that the Kirkendall voids become larger (4–20 nm) in LDO500 and LDO600. At 700 and 900 °C, most of the voids disappear with the particle size becomes larger due to the sintering at higher temperature (Fig. 3(g and h)). The STEM-EDS mapping of LDO400 in Fig. 3(i–l) show that Ni and Mn are well-distributed across the entire sample indicating the homogeneous mixing of NiO and MnOx in LDO400. In addition to the unique porous structure, LDOs have another advantage of intimate homogeneous mixing of two metal oxides, compared to physical mixing.
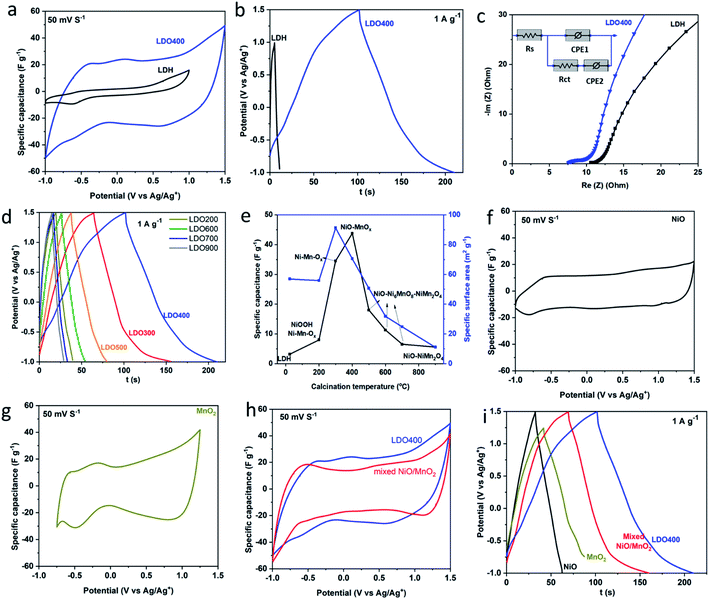
Fig. 4(a) and Fig. S3† show the cyclic voltammetry (CV) curves of LDH and LDOs in the organic electrolyte. As far as we are aware this is the first electrochemical study of an LDH/LDO in an organic electrolyte. The LDH has a relative narrow potential window (2.0 V) and limited specific capacitance over the potential window investigated. The expansion of the enclosed area within the CV curves of the LDOs indicates the enhanced specific capacitance in LDOs compared to the LDH. Particularly, LDO400 shows the strongest current response due to its highly porous structure and the intimate homogeneous mixing of electrochemically active NiO and MnOx phases. Fig. 4(a) shows a smooth CV curve for LDH in the organic electrolyte (1 M TEABF4 in AN) except for a minor reduction peak at −0.6 V. This indicates its surface-limited storage mechanism. In comparison, the CV response of Ni2Mn-LDH in alkaline aqueous electrolyte shows the typical peak shape of a battery-type storage mechanism.24,41 Fig. 4(b) shows the galvanostatic charge–discharge of LDH and LDO400. From the discharge curve and using eqn (1), the specific capacitance of LDH is calculated to be 3.2 F g−1 while LDO400 can reach 44 F g−1, which is at least 13 times higher than LDH. Both higher specific capacitance and wider working potential in LDO400 will facilitate the development of much higher energy density supercapacitors. Fig. 4(b) shows a smooth charge/discharge curve without an obvious battery-type plateau indicating nearly constant capacitance over the potential range. This is consistent with the CV data. Nyquist plots and the equivalent circuit model were shown in Fig. 4(c). Series resistance (Rs) can be obtained from the intersection of curve with x axis indicates the lower series resistance in LDO400 possibly due to its better compatibility with the organic electrolyte. On the other hand, it seems that the charge transfer resistance (Rct) is lower in Ni2Mn-LDH although the semi-circle is less obvious. Overall, the internal resistance (Rs + Rct) of LDO400 is lower than that of Ni2Mn-LDH. Galvanostatic charge–discharge curves in Fig. 4(d) show that LDOs have similar charge–discharge behaviour but with significantly different capacity. The calculated specific capacitances and measured specific surface area were plotted versus the calcination temperature in Fig. 4(e). A similar trend is found for the effect of calcination temperature on specific capacitance and specific surface area. However, a high surface area does not guarantee the best performance.4 The calcination temperature significantly affects the specific capacitance as it induces the changes of chemical composition, crystallinity, phase fraction, surface area and porous structure within the LDOs. A slow calcination (low ramp rate) of the LDH results in better performance while the effect of calcination holding time is negligible (Fig. S4†). Overall, the optimised conditions are: calcination at 400 °C with ramping rate of 5 °C min−1 and hold time of 3 h. Under the optimal conditions, LDO400 has the best performance due to the intimate mixing of low crystallinity, high surface area, active NiO/MnOx phases with a highly porous structure. We also noted that spinel oxides have been reported as supercapacitor electrodes with high performance in an aqueous electrolyte,42 however, a relative low specific capacitance was found for the spinel containing LDO (900 °C) here which could be due to the different storage mechanism in the organic electrolyte.
To further illustrate the difference between the mixed metal LDO and a simple mixture of metal oxides, control samples of NiO, MnO2 and a physical mixture (in the appropriate ratio) were prepared, evaluated by CV and GCD, and compared with LDO400. The envelop shape of CV in Fig. 4(f) indicates that storage mechanism of NiO is likely to be a fast surface redox pseudocapacitance9,11 which can be described by the eqn (2).
| (NiO)surface + TEA+ + e− ↔ (NiO−TEA+)surface | (2) |
This involves fast and reversible redox reactions on the surface of NiO involving the tetraethylammonium cation (TEA+, from the electrolyte salt TEA+BF4−). For MnO2, a pair of redox events is observed with small voltage offset indicating that the storage mechanism involves the intercalation pseudocapacitance4 which can be described by the eqn. (3).18
| MnO2 +TEA+ + e− ↔ (MnOO)TEA | (3) |
During the intercalation/deintercalation of TEA+ in the interlayers/tunnels of MnO2, there is reversible redox transition between Mn4+ and Mn3+. The linear dependence of potential on the state of charge in Fig. 4(i) is another characteristic of pseudocapacitive storage mechanism in NiO and MnO2. A higher specific capacitance is found in the physical mixture compared to their parent materials indicating the synergetic effect between NiO and MnO2. This could be due to the combined contribution of fast redox pseudocapacitance of NiO and intercalation pseudocapacitance of MnO2. For LDO400, the specific capacitance is even higher due to the synergic effect between two types of pseudocapacitive storage mechanism, uniform porous structure and a better distribution of NiO/MnOx than in the physical mixture of NiO/MnO2. From Fig. 4(i), the specific capacitances of NiO, MnO2 and physical mixture of NiO and MnO2 are calculated to be 12 F g−1 (2.5 V), 24 F g−1 (2.0 V), 36 F g−1 (2.5 V), respectively, all of which are lower than that of LDO400 (44 F g−1 at 2.5 V). These results clearly show the advantage of LDO over the single component metal oxides as well as the physical mixture of mixed metal oxides.
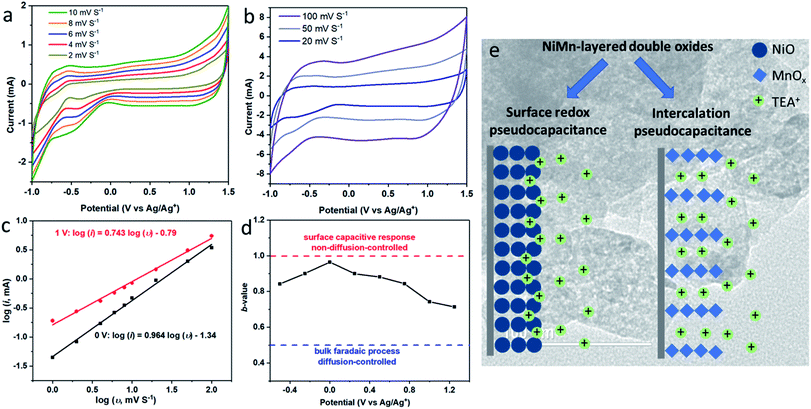
To illustrate the storage mechanism of LDO400, CV experiments at different scan rates (1–100 mV S−1) were collected and shown in Fig. 5(a and b). According to the power law relationship, eqn (4).43,44
| i = aυb | (4) |
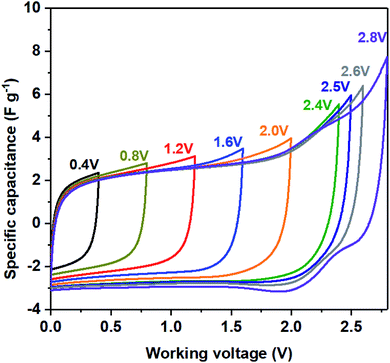
To demonstrate that LDO as the high-working voltage electrode, a symmetric two-electrode system using both LDO400 as cathode and anode was evaluated by CV at various voltage windows. Fig. 6 shows quasi-rectangular shapes of CV curves up to 2.5 V. At working voltage of 2.6 V, the discharge CV curve starts to distort slightly at 2.25 V which becomes more significant at the working voltage of 2.8 V indicating the non-reversible structure change of LDO400. These results confirm that LDO400 can operate at high working voltage up to 2.5 V using a symmetric design.
Conclusions
A route to mixed metal oxide-based supercapacitor electrodes using Ni2Mn-layered double hydroxide precursors has been developed. The calcination temperature has a significant effect on the chemical composition, crystallinity, surface area and pore structure of Ni2Mn-LDOs, leading to varied electrochemical performances. Ni2Mn-LDO produced by calcination at 400 °C has the highest specific capacitance of 44 F g−1 (1 A g−1) in the organic electrolyte which is 13 times higher than the parent Ni2Mn-LDH. Ni2Mn-LDO performs better than NiO, MnO2 and their physical mixture. These could be ascribed to the synergetic contribution of different storage mechanism in NiO and MnOx as well as the homogeneously distribution of NiO and MnOx. This study could pave the way for further development of new routes to mixed metal oxide-based supercapacitors to meet the high-energy density and high-power density demand for the supercapacitor field.Author contributions
J. H.: conceptualisation, investigation, writing and original draft; C. C.: supervision, investigation, writing, review and editing; A. S.: resources, investigation; D.-G. C.: investigation, writing, review and editing; P. H.: investigation; J.-C. B.: supervision, writing, review and editing; D. O.: funding acquisition, supervision, writing, review and editing.Conflicts of interest
There are no conflicts to declare.Acknowledgements
J. H., C. C., D.-G. C. and J.-C. B. thank SCG Chemicals Co., Ltd (Thailand) for funding.Notes and references
- P. Simon and Y. Gogotsi, Nat. Mater., 2008, 7, 845–854 CrossRef CAS PubMed.
- A. Burke, Int. J. Energy Res., 2010, 34, 133–151 CrossRef CAS.
- N. Goubard-Bretesché, O. Crosnier, F. Favier and T. Brousse, Electrochim. Acta, 2016, 206, 458–463 CrossRef.
- V. Augustyn, P. Simon and B. Dunn, Energy Environ. Sci., 2014, 7, 1597–1614 RSC.
- G. Wang, L. Zhang and J. Zhang, Chem. Soc. Rev., 2012, 41, 797–828 RSC.
- C. Zhong, Y. Deng, W. Hu, J. Qiao, L. Zhang and J. Zhang, Chem. Soc. Rev., 2015, 44, 7484–7539 RSC.
- K.-C. Liu and M. A. Anderson, Proceedings of the symposium on electrochemical capacitors II, 1996, vol. 96-25, p. 97 Search PubMed.
- H.-Y. Lee, H.-S. Kim and S.-W. Kim, US Pat., 6496357B2, 2002 Search PubMed.
- S. Makino, Y. Takasu and W. Sugimoto, Chem. Lett., 2010, 39, 544–545 CrossRef CAS.
- A. Sonavane, A. Inamdar, D. Dalavi, H. Deshmukh and P. Patil, Electrochim. Acta, 2010, 55, 2344–2351 CrossRef CAS.
- N. Padmanathan, S. Selladurai, K. M. Rahulan, C. O'Dwyer and K. M. Razeeb, Ionics, 2015, 21, 2623–2631 CrossRef CAS.
- H.-Y. Lee, H.-S. Kim and S.-W. Kim, US Pat., 6496357B2, 2002 Search PubMed.
- T. Yan, W. Bing, M. Xu, Y. Li, Y. Yang, G. Cui, L. Yang and M. Wei, RSC Adv., 2018, 8, 4695–4702 RSC.
- F. Perez-Alonso, I. Melián-Cabrera, M. L. Granados, F. Kapteijn and J. G. Fierro, J. Catal., 2006, 239, 340–346 CrossRef CAS.
- D. Bi and Y. Xu, J. Mol. Catal. Chem., 2013, 367, 103–107 CrossRef CAS.
- M. Reddy, G. Subba Rao and B. Chowdari, Chem. Rev., 2013, 113, 5364–5457 CrossRef CAS PubMed.
- Y. Zhao, X. Li, B. Yan, D. Xiong, D. Li, S. Lawes and X. Sun, Adv. Energy Mater., 2016, 6, 1502175 CrossRef.
- X. Li and B. Wei, Nano Energy, 2012, 1, 479–487 CrossRef CAS.
- Q. Wang and D. O'Hare, Chem. Rev., 2012, 112, 4124–4155 CrossRef CAS PubMed.
- C. Chen, M. Yang, Q. Wang, J.-C. Buffet and D. O'Hare, J. Mater. Chem. A, 2014, 2, 15102–15110 RSC.
- G. R. Williams and D. O'Hare, J. Mater. Chem., 2006, 16, 3065–3074 RSC.
- J. Yu, Q. Wang, D. O'Hare and L. Sun, Chem. Soc. Rev., 2017, 46, 5950–5974 RSC.
- J. Yu, K. Ruengkajorn, D.-G. Crivoi, C. Chen, J.-C. Buffet and D. O'Hare, Nat. Commun., 2019, 10, 2398 CrossRef.
- J. Zhao, J. Chen, S. Xu, M. Shao, Q. Zhang, F. Wei, J. Ma, M. Wei, D. G. Evans and X. Duan, Adv. Funct. Mater., 2014, 24, 2938–2946 CrossRef CAS.
- Y. Zhao, Q. Wang, T. Bian, H. Yu, H. Fan, C. Zhou, L.-Z. Wu, C.-H. Tung, D. O'Hare and T. Zhang, Nanoscale, 2015, 7, 7168–7173 RSC.
- H. Chen, L. Hu, M. Chen, Y. Yan and L. Wu, Adv. Funct. Mater., 2014, 24, 934–942 CrossRef CAS.
- X. Long, Z. Wang, S. Xiao, Y. An and S. Yang, Mater. Today, 2016, 19, 213–226 CrossRef CAS.
- X. Li, D. Du, Y. Zhang, W. Xing, Q. Xue and Z. Yan, J. Mater. Chem. A, 2017, 5, 15460–15485 RSC.
- L. Zhu, C. Hao, X. Wang and Y. Guo, ACS Sustain. Chem. Eng., 2020, 8, 11618–11629 CrossRef CAS.
- X. Wang, X. Li, C. Huang, C. Hao, C. Ge and Y. Guo, Appl. Surf. Sci., 2020, 527, 146891 CrossRef CAS.
- M. Ram Reddy, Z. Xu, a. G. Q. Lu and J. Diniz da Costa, Ind. Eng. Chem. Res., 2008, 47, 2630–2635 CrossRef.
- Y. Chen, J. Yan, D. Ouyang, L. Qian, L. Han and M. Chen, Appl. Catal. Gen., 2017, 538, 19–26 CrossRef CAS.
- J. Huang, Z. Yang, R. Wang, Z. Zhang, Z. Feng and X. Xie, J. Mater. Chem. A, 2015, 3, 7429–7436 RSC.
- C. Jing, B. Dong and Y. Zhang, Energy Environ. Mater., 2020, 3, 346–379 CrossRef CAS.
- P. Ragupathy, H. Vasan and N. Munichandraiah, J. Electrochem. Soc., 2008, 155, A34–A40 CrossRef CAS.
- A. P. Grosvenor, M. C. Biesinger, R. S. C. Smart and N. S. McIntyre, Surf. Sci., 2006, 600, 1771–1779 CrossRef CAS.
- D. Tang, L. Ben, Y. Sun, B. Chen, Z. Yang, L. Gu and X. Huang, J. Mater. Chem. A, 2014, 2, 14519–14527 RSC.
- X. He, F. Yin, Y. Li, H. Wang, J. Chen, Y. Wang and B. Chen, ACS Appl. Mater. Interfaces, 2016, 8, 26740–26757 CrossRef CAS PubMed.
- J. L. Shi, C. Tang, H. J. Peng, L. Zhu, X. B. Cheng, J. Q. Huang, W. Zhu and Q. Zhang, Small, 2015, 11, 5243–5252 CrossRef CAS PubMed.
- F. Wu, J. Bai, J. Feng and S. Xiong, Nanoscale, 2015, 7, 17211–17230 RSC.
- T. Brousse, D. Bélanger and J. W. Long, J. Electrochem. Soc., 2015, 162, A5185–A5189 CrossRef CAS.
- C. Huang, Y. Ding, C. Hao, S. Zhou, X. Wang, H. Gao, L. Zhu and J. Wu, Chem. Eng. J., 2019, 378, 122202 CrossRef CAS.
- S. Ardizzone, G. Fregonara and S. Trasatti, Electrochim. Acta, 1990, 35, 263–267 CrossRef CAS.
- J. Wang, J. Polleux, J. Lim and B. Dunn, J. Phys. Chem. C, 2007, 111, 14925–14931 CrossRef CAS.
Footnote |
| † Electronic supplementary information (ESI) available: Details of chemicals and materials, and characterisation methods. Fig. S1–S4, XPS, BET, pore size distribution of LDH and LDOs, effect of calcination ramping rate and hold time on the specific capacitance. See DOI: 10.1039/d1ra04681k |
| This journal is © The Royal Society of Chemistry 2021 |


