 Open Access Article
Creative Commons Attribution 3.0 Unported Licence
Exploring the feasibility of liquid fuel synthesis from CO2 under cold plasma discharge: role of plasma discharge in binary metal oxide surface modification†
Nitesh Joshi and
L. Sivachandiran*
Laboratory of Plasma Chemistry and Physics (LPCP), Department of Chemistry, Faculty of Engineering and Technology, SRM Institute of Science and Technology, SRM Nagar, Kattankulathur, Chennai-603203, India. E-mail: sivachal@srmist.edu.in
First published on 16th August 2021
Abstract
The conversion of CO2 to CH3OH over binary mixed metal oxides of NiO–Fe2O3 is investigated in the study. A series of catalysts, i.e., NiO, Fe2O3, 5% NiO–Fe2O3 (5NF), 10% NiO–Fe2O3 (10NF), and 15% NiO–Fe2O3 (15NF), was tested for CO2 conversion and CH3OH selectivity performance. The results show that binary mixed metal oxides are more active in comparison to pure metal oxides. Moreover, increasing NiO mixing leads to the agglomeration of NiO particles. At 200 °C, around 1.5%, 2%, and 3.2% CO2 conversion is achieved for 5NF, 10NF, and 15NF, respectively. Interestingly, when cold plasma was ignited at 200 °C, around 5.4%, 6.2%, and 10.2% CO2 conversion was achieved for the 5NF, 10NF, and 15NF catalysts, respectively. 15NF exhibited the highest CO2 conversion, but produced only CH4. Plasma coupling with the catalyst led to an increase in the CH3OH yield, and around an 5.8-fold enhancement was achieved with 10NF at 200 °C compared to thermal catalysis. We showed that the combination of plasma and thermal heating brings about significant changes to the catalyst morphology, which significantly improved the catalytic activity. X-ray diffraction (XRD) and X-ray photoelectron spectroscopy (XPS) characterization revealed that plasma treatment leads to the formation of a mixture of spinel compounds (NiO–Fe2O3, NiFe2O4, and Fe3O4).
1. Introduction
The rising CO2 concentration in the atmosphere is a serious situation. Currently, the adverse effects triggered by CO2 emissions are being well documented and are causing global concern.1–3 There are various methodologies available for controlling rising CO2 levels. Among the viable solutions, great efforts have been made in terms of two strategies: (1) CO2 capture and storage4,5 (2) CO2 chemical recycling.6,7 It has been reported that the recycling of CO2 as a carbon source for value-added chemical production, such as methane (CH4),8 methanol (CH3OH)9 or polycarbonate,10 would be considered to be a more sustainable use of global carbon resources, which would lead to lower consumption of fossil fuels and subsequent CO2 emissions.11,12 Among the different alternatives, one of the widely investigated processes is the hydrogenation of CO2 to CH3OH (eqn (1)) using H2 produced from renewable energy sources.CH3OH is one of the most important feedstocks as it can be used directly as a fuel, as an energy carrier in fuel cells, or as a raw material to synthesis formaldehyde, acetic acid, and olefins.11 CH3OH is traditionally produced from syngas, however, for economic and environmental reasons, there is great interest in developing a process where it is produced from the greenhouse gas CO2. The main problem that is currently hindering the wider application of the latter process is low CH3OH selectivity due to the occurrence of the competitive reverse water–gas shift (RWGS) reaction (eqn (2)).13 Thus, it is important to develop catalytic materials characterized by high activity and selectivity towards CH3OH.
The state-of-the-art catalyst for CH3OH synthesis is CuO/ZnO/Al2O3 (CZA), where CuO and ZnO catalyse both the CH3OH formation and the RWGS reaction.13 The reaction is catalysed at 513–533 K under 50–100 bar pressure.13 The commercial catalyst CZA losses its activity after several catalytic cycles due to surface poisoning and particle sintering. Additionally, to catalyse a reaction via thermal catalysis, a high operating temperature and pressure are applied to overcome kinetic and thermodynamic barriers.9,14 Thus, the industrialization of the CH3OH production requires an efficient catalyst with a low activation temperature.
The impact of metal ions in bimetallic catalysts is crucial, as demonstrated by Ren et al.,15 where in their study Ni–M/ZrO2 catalysts exhibited different product distributions with different metal ions. Iron (Fe)-based catalytic systems have been widely investigated, due to their low cost and high activity, for RWGS and Fischer Tropsch (FT) reactions to synthesis olefinic products.11 Gasoline fractions have been reported to be produced by Wei et al.16 using a heterogeneous catalytic system of Na–Fe3O4/HZSM-5. Herein, a CO2 hydrogenation reaction was initiated at a H2/CO2 ratio = 3, 320 °C, 2 MPa pressure and ∼67 mL min−1 feed flow rate. The authors obtained gasoline (C5 to C11 hydrocarbons with 78% selectivity) from this setup. In another study, Zhou et al.17 employed ZnO/ZrO2 integrated over H-ZSM5 for aromatic synthesis from CO2. The authors obtained 16% CO2 conversion and 76% selectivity towards aromatics at 340 °C under 40 bar pressure. Additionally, there are some state-of-the-art reviews available that comprehensively summarize the recent advancements in heterogeneous catalysis for CO2 hydrogenation to value added products.18,19
There are few reports available on CO2 reduction using mixed oxides under plasma discharge. CO2 conversion to CH4 has been carried out using NiO–Fe2O3 layered double hydroxides by Wierzbicki et al.20 Around 75% CO2 conversion and 100% CH4 selectivity were obtained using a Ni20Fe1.5 catalyst at 250 °C and 11.7 W input power. In another study, CO2 conversion to syngas using a Ni/Al2O3 catalyst was carried out by Ma et al.21 using plasma. The authors applied 55.4 J cm−3 of specific input energy and around 14% CO2 conversion was achieved, with CO being the main product quantified at the reactor outlet. Jwa et al.22 carried out CO and CO2 conversion to CH4 over a Ni–zeolite catalyst. The authors studied the influence of external heating on the activity of the catalysts. At a temperature of 180–360 °C, the CO2 conversion was <15%. Upon combining thermal heating with plasma discharge on the catalyst bed, the CO2 conversion increased to >95%. This enhancement is the result of the reactive species generated in the plasma reducing the catalyst activation energy barrier and thermal heating facilitating their interaction.
When it comes to the activation of catalysts and the conversion of reactants under ambient conditions, non-thermal plasma (NTP) aided catalysis is a fascinating avenue. NTP is efficient for activating CO2 at room temperature under atmospheric pressure conditions.23,24 The NTP process of catalysis operates via a completely different mechanism of electron impact dissociation, thus, it consumes less energy compared to thermal catalysis. In thermal catalysis, the vibrational excitation of molecules is a key factor that requires higher energy and therefore impacts the overall energy efficiency.25 Various types of NTPs have been employed in the successful conversion of CO2 to CO or CH4 or oxygenates.14,26–30 The dielectric barrier discharge (DBD) is one such NTP that has been widely studied, as it has a simplistic design and is operational under ambient conditions. Thus, it could be of prime importance from a commercialisation point of view. In terms of DBD plasma, only a handful of studies have focused on the conversion of CO2 to oxygenate. For instance, Bill et al.31 showed around 0.2% CH3OH yield by using 400 W input power at a 250 mL min−1 feed flow rate. Interestingly, the commercial CH3OH catalyst Cu/ZnO/Al2O3 under atmospheric pressure shows 12% CO2 conversion and a CH3OH selectivity of 0.4%, but upon increasing pressure to the 8 bar, the conversion rose to 14% with 10% CH3OH selectivity.32 Enhanced CO2 conversion to CH3OH was reported by Wang et al.24 The authors showed that CH3OH selectivity could be increased to 53.7% with 11% yield using Cu/γ-Al2O3 at room temperature under atmospheric pressure. More recently, a CoxOx/MgO catalyst system was employed for the conversion of CO2 to CH3OH at room temperature under atmospheric conditions.33 The authors observed that 33% CO2 conversion and 31% CH3OH selectivity were achieved using 10 W of input power.
In our previous work, we successfully showed that binary mixed metal oxides are more active towards CO2 conversion and CH3OH production.34 The main aim of this work was to employ mixed binary metal oxides of NiO–Fe2O3 for the hydrogenation of CO2 to CH3OH using non-thermal plasma. Dedicated efforts were made to investigate (i) the influence of individual and binary mixed metal oxides on CO2 conversion and CH3OH production, (ii) the impact of NiO mixing on Fe2O3 for CO2 conversion and CH3OH selectivity, (iii) understanding the role that plasma power and operating temperature have on CO2 conversion and products distribution, and (iv) the effect that plasma discharge has on catalyst surface modification.
| CO2 + 3H2 → CH3OH + H2O, ΔH025°C = −49.5 kJ mol−1 | (1) |
| CO2 + H2 ↔ CO + H2O, ΔH025°C = 41 kJ mol−1 | (2) |
2. Experimental description
2.1. Preparation of the catalyst
In this study, the amount of NiO was varied: 5%, 10% and 15% on Fe2O3 and labelled as 5NF, 10NF and 15NF, respectively. The detailed NiO–Fe2O3 catalyst synthesis procedure has been reported elsewhere.31 Briefly, various amounts of Ni(NO3)2·6H2O (99% pure) were mixed with Fe(NO3)3·9H2O (99% pure) and dissolved in 50 mL of ethanol (96% pure) and a homogeneous solution was made with constant stirring. Then, the precursor was precipitated as hydroxide sol using 10% NH4OH solution at a flow rate of 1 mL min−1. At pH ∼ 12, complete precipitation was reached, then the sol was aged at 85 °C overnight. Then the precipitate was centrifuged-washed several times using distilled water to remove the impurities. The washed residue was dried at 100 °C (for 2 h) and then calcined at 600 °C for 3 h.2.2. Catalyst characterization
The synthesised and used catalysts were characterised by different techniques. X-ray diffraction (XRD) data were obtained using a PANalytical X'pert3 instrument [Cu Kα 1.54 Å, 40 kV, 40 mA]. The catalyst surface morphology was studied using nanoscale images obtained using a high-resolution field emission electron microscopy (FESEM, Quanta 200) and high-resolution transmission electron microscopy (HRTEM JEOL, Japan) instruments. Along with electron images, energy-dispersive X-ray (EDX) spectroscopy data was obtained to determine the elemental composition, which is provided in Fig. S1a–c in the ESI.† The elemental mapping image of 10NF is provided in Fig. S1d in the ESI,† which was obtained using FESEM. X-ray photoelectron spectroscopy (XPS) analysis was carried out using a PHI Versaprobe III to obtain further information on the elemental composition and oxidation state of the catalysts. The physical properties of the catalysts, i.e., the total surface area (Brunauer–Emmett–Teller, BET) was measured using an Autosorb iQ Station at 77 K by N2 physisorption. Before the analysis, the catalysts were degassed under a He atmosphere at 150 °C for 3 h. The data from the N2 sorption study is provided in Fig. S2 in the ESI.† The Lewis and Brønsted acidic sites were determined using Fourier-transform infrared (FTIR) spectroscopy (SHIMADZU IR TRACER-100) by adsorbing pyridine. 10 mg of pyridine adsorbed catalysts were thoroughly mixed with 100 mg of NaCl to maintaining sample uniformity and were then analysed by FTIR spectroscopy in attenuated total reflectance (ATR) mode. The FTIR analysis is reported in Fig. S3 in the ESI.†2.3. Plasma reactor and experimental setup
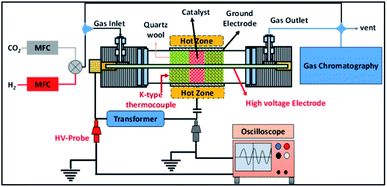
The experimental setup employed in this study is shown in Fig. 1. A detailed description of the reactor has been reported elsewhere.31 Briefly, in this setup the cylindrical quartz tube is 600 mm in length, the outer diameter (OD) of the tube is 25 mm, the wall thickness of the tube is 3 mm and the inner diameter (ID) of the reactor is 19 mm. A 12 mm (OD) stainless steel rod is used as an inner electrode, which leads to a 3.5 mm discharge gap. In the experiments, the discharge length was fixed at 100 mm by wrapping the quartz tube in stainless steel mesh. The plasma was generated using a step-up transformer supplied by Jayanti Transformer (Chennai, India). The AC voltage was varied from 10 to 18 kV at a constant frequency of 50 Hz.The electrical parameters were calculated using two high voltage probes with 1![[thin space (1/6-em)]](https://www.rsc.org/images/entities/char_2009.gif) :
:![[thin space (1/6-em)]](https://www.rsc.org/images/entities/char_2009.gif) 100 attenuation (Zeal Manufacturing Service Limited, Pune, India), which were connected to an oscilloscope (Keysight, 70 MHz 2Ga s−1) as shown in Fig. 1. The power dissipated into the reactor was calculated using the Lissajous method.35,36
100 attenuation (Zeal Manufacturing Service Limited, Pune, India), which were connected to an oscilloscope (Keysight, 70 MHz 2Ga s−1) as shown in Fig. 1. The power dissipated into the reactor was calculated using the Lissajous method.35,36
For catalytic CO2 conversion, the binary metal oxides (0.5 g) were placed in the centre of the quartz tube and quartz wool (QW 3.67 g) was used to sandwich the catalyst. The catalyst packing mode used in this work is different from that in our previously reported work.31 In the previous study, the catalyst was loaded on QW using a dip-coating method. However, in this study, due to practical issues related to catalyst characterisation, before and after plasma treatment, the catalyst was packed in sandwich mode. The CO2 and H2 composition was set to a ratio of 1![[thin space (1/6-em)]](https://www.rsc.org/images/entities/char_2009.gif) :
:![[thin space (1/6-em)]](https://www.rsc.org/images/entities/char_2009.gif) 3 and the total flow rate was fixed at 100 mL min−1. The discharge volume was fixed to 17.4 cm3.
3 and the total flow rate was fixed at 100 mL min−1. The discharge volume was fixed to 17.4 cm3.
The feed flow rate through the reactor was fixed to 100 mL min−1 unless otherwise mentioned, and H2 and CO2 were mixed in a 3![[thin space (1/6-em)]](https://www.rsc.org/images/entities/char_2009.gif) :
:![[thin space (1/6-em)]](https://www.rsc.org/images/entities/char_2009.gif) 1 ratio. Commercial-grade CO2 (99.5%), H2 (99.99%), N2 (99.999%) and zero air (99.999%) were supplied by Rana Industrial gases (Chennai, India). The zero air was used for catalyst pre-treatment and N2 was used as a dilutant gas during gas chromatography (GC) calibration. The CO2 and H2 flow were regulated using the respective calibrated mass flow controllers (MFC, KOFLOC, Japan).
1 ratio. Commercial-grade CO2 (99.5%), H2 (99.99%), N2 (99.999%) and zero air (99.999%) were supplied by Rana Industrial gases (Chennai, India). The zero air was used for catalyst pre-treatment and N2 was used as a dilutant gas during gas chromatography (GC) calibration. The CO2 and H2 flow were regulated using the respective calibrated mass flow controllers (MFC, KOFLOC, Japan).
2.4. Methodology and product analysis
The gaseous products at the reactor outlet were analysed using gas chromatography (GC, Perkin Elmer-Claraus 580) equipped with an online gas sampling loop (2 mL). A thermal conductivity detector connected to a ShinCarbon ST Column (mesh size of 100/120, length of 2 m and an inner diameter of 1/11th inch) was used for eluting the reactants and products. The reaction output, such as CO2 conversion, product selectivity and product yield, was calculated using the equations provided in the ESI.†2.5. Experimental procedure
3. Results and discussion
3.1. Physiochemical characterization of the catalysts
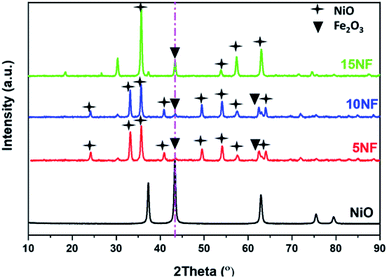
The XRD patterns of the synthesised catalysts are shown in Fig. 2. The XRD patterns show that the synthesized catalysts are pure and crystalline. The diffraction peaks at 37.3, 43.3, 62.9 and 75.3 confirm the presence of NiO, which correspond to the (111), (200), (220), and (311) planes, respectively. For NiO–Fe2O3 binary mixed oxides, the characteristic peak for NiO, centred at 43.3°, is used for calculating the particle size, whereas the intense peak at 33° is used to calculate the particle size of Fe2O3. The details of particle size calculations using the Scherrer equation for all of the catalysts are presented in Table 1. It can be observed that the particle size of NiO increases upon increasing the % of metal oxide mixing. This is due to the weak interaction between NiO and Fe2O3, which does not suppress the agglomeration and formation of large NiO clusters unlike on other supports, such as porous Al2O3, which interacts strongly with active metals to suppress particle growth.37,38 However, as compared in Table 1, the Fe2O3 particle size was not significantly affected due to the dopant action of NiO.| Catalyst | Particle size (nm) | Metal mixingb (%) | SBETc (m2 g−1) | Pore volume (cm3 g−1) | Pore size (Å) | |
|---|---|---|---|---|---|---|
| NiO | Fe2O3 | |||||
| a The ICCD database reference no 00-039-1346 peak at the highest intensity at 35.631 was used.b Results based on EDX analysis.c The specific surface area obtained from BET measurements. | ||||||
| Fe2O3 | — | 32 | — | NA | NA | NA |
| NiO | 11 | — | — | NA | NA | NA |
| 5NF | 40.8 | 20.4 | 5.2 | 23.5 | 0.15 | 195.6 |
| 10NF | 178 | 29.9 | 10.3 | 9.1 | 0.03 | 28.5 |
| 15NF | 8934 | 25.7a | 18.7 | 3.6 | 0.07 | 13.8 |
Fig. 3 shows the FESEM images of the various catalysts. As can be seen from Fig. 3(a), on 5NF the NiO particles are uniformly distributed, on the other hand for 10NF and 15NF the NiO particles are agglomerated upon increasing the amount of metal mixing, as can be seen from Fig. 3(b) and (c), respectively. It should be noted that the particle size calculated from the XRD data (using the Scherrer equation) is in good agreement with what is observed in the SEM images. It can be observed that, on the one hand, the increase in NiO mixing leads to an increase in particle size due to agglomeration. On the other hand, an increase in metal mixing decreases the surface area and pore volume, as can be seen from Table 1. The decrease in the total surface area can be attributed to the agglomeration of NiO particles on the Fe2O3 support, which is in line with the particle size calculated using XRD.
3.2. Plasma energy deposition into the packed bed reactor
Fig. 4 shows the effect of applied voltage on the specific input energy (SIE) delivered into the reactor packed with a 10NF catalyst, wherein it can be seen that the increase in applied voltage exponentially increases the SIE. It is worth mentioning that no significant difference in SIE was observed for the different catalyst packed reactors. The increase in applied voltage increases the charge build-up across the dielectric material and thus increase the power injected into the system. Therefore, it can be proposed that the enhanced charge improves the CO2 conversion under similar operating conditions. The detailed plasma diagnostics were evaluated and the results are shown in Fig. S4 in the ESI.†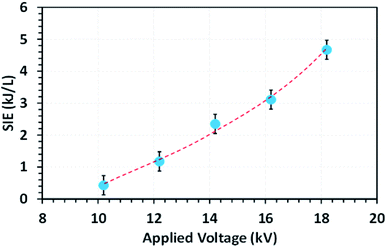 | ||
Fig. 4 The evolution of the SIE as a function of the applied voltage (feed flow rate: 100 mL min−1, CO2/H2 = 1![[thin space (1/6-em)]](https://www.rsc.org/images/entities/char_2009.gif) : :![[thin space (1/6-em)]](https://www.rsc.org/images/entities/char_2009.gif) 3, frequency: 50 Hz). 3, frequency: 50 Hz). | ||
3.3. Thermal catalysis study
The catalyst bed temperature was linearly varied from 30 to 250 °C and the CO2 conversion at different temperatures is shown in Fig. 5. We observed that for all of the catalysts the CO2 conversion increases with an increase in temperature. Moreover, even at 250 °C the pure metal oxides i.e. NiO and Fe2O3 exhibited around 3.5% and <1% CO2 conversion, respectively (results not reported in the figure). On the one hand, at 200 °C the CO2 conversion increased from 1.7 to 3.7% upon increasing the NiO mixing from 5 to 15%. On the other hand, at 250 °C the mixing of 5% NiO with Fe2O3 improved the CO2 conversion by three-fold (11.7%) under similar operating conditions. However, a further increase in the amount of NiO mixing exhibited a negative effect, i.e., decreased the CO2 conversion to 9% (10% NiO) and 7.5% (15% NiO). This decrease in conversion with an increase in NiO mixing could be attributed to the (i) NiO particle size and (ii) the oxidation of products such as CH4 and CH3OH to CO2 at high temperatures. As reported in Table 1, the NiO particle size increased significantly with an increase in the amount of NiO mixing. The bigger the NiO particle size the more difficult it is to reduce compared to small sized NiO particles, as hydrogen mass transfer is hindered.34| 2CO(ads) → C(ads) + CO2 | (3) |
| C(ads) + 2H2(ads) → CH4 | (4) |
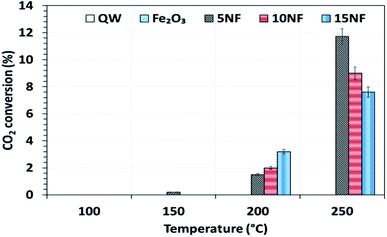 | ||
| Fig. 5 The influence of temperature on CO2 conversion for the different catalysts. Reaction conditions: catalyst, 0.5 g; H2/CO2 = 75/25, 100 mL min; P = 1 atm. | ||
Fig. 6 shows the CH3OH yield as a function of temperature varied between 100 and 250 °C. It can be observed that the CH3OH yield increases with an increase in temperature. At 200 °C, the increase in NiO mixing from 5% to 10% increases the CH3OH yield from 0.4 to 1%, respectively. At 250 °C, a maximum yield of 3.2% of CH3OH was obtained for the 10NF catalyst. However, a further increase in the amount of NiO to 15% exhibited no CH3OH formation. From the XRD results, it can be observed that the increase in NiO mixing (15NF) leads to the formation of NiFe2O4 and large particle size. Thus, it is suggested that spinel structures and larger NiO particles do not favour CH3OH formation in thermal catalysis. This could be due to weaker and/or no chemisorption of CO and H2 on spinels, as evidenced by Zhang et al.39 The authors synthesised Ni/α-Al2O for CO2 hydrogenation to CH4. It was evident that nickel aluminate spinel structures (NiAl2O4) were formed on the catalyst surface, which was confirmed by XRD. NiAl2O4 is inactive towards the chemisorption of H2 and CO and thus CH4 is the main product quantified. Thus, it is thought that the species required for CH3OH does not bind to the 15NF catalyst surface. Indeed, during CH3OH synthesis the binding energy of intermediates (namely CO, formate others) is of prime importance as it determines the nature of the product. As reported in Fig. S1 in the ESI,† the pyridine adsorption study revealed that an increase in the amount of NiO also increased the number of Lewis basic sites. Therefore, the CO2 adsorption on the catalyst surface also increases and more CO2 conversion is expected, however, it should also be noted that the nature of the product is dependent on the intermediate binding strength. If intermediates (CO, formate) are strongly adsorbed on the NiO surface then this leads to CH4 formation, i.e., the Boudouard reaction is dominant, as reported in eqn (3) and (4).
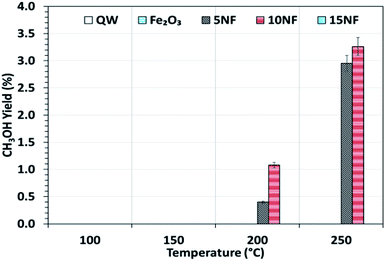 | ||
| Fig. 6 CH3OH yield as a function of the reaction temperature. Reaction conditions: catalyst, 0.5 g; H2/CO2 = 75/25, flow rate, 100 mL min; P = 1 atm. | ||
By mixing metal oxides with different binding strengths toward the intermediates (CO and formate), a binary metal oxide mixture with optimum binding energy for the intermediates could be prepared. The optimum binding energy means that the intermediates are neither adsorbed strongly nor loosely on the catalyst surface. On the one hand, as we stated above, if the intermediates (CO and formate), adsorb strongly on NiO this leads to CH4 formation, on the other hand, if CO adsorbs weakly (for example on Fe2O3), it is easily desorbed into the gas phase. Indeed, both sets of conditions significantly decrease the CH3OH production. Thus, it is proposed that 10NF shows the optimum binding energy with the intermediates and thus the highest yield of CH3OH.
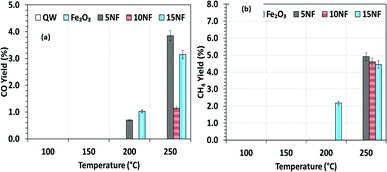
To investigate the role that the amount of NiO has on CO and CH4 formation, the respective yields were calculated as a function of temperature and the results are reported in Fig. 7(a) and (b). We observed that at 200 °C, the CO yield increased from 0.7% to 1.2% upon increasing the NiO content from 5% to 15%. Notably, with the 10NF catalyst, CO was not quantified at the reactor downstream. This result supports our hypothesis that all of the CO adsorbed with the optimum binding energy on the 10NF catalyst is converted to CH3OH. Moreover, at 250 °C, the CO yield decreases with an increase in NiO mixing. It should also be noted that 10NF exhibits the lowest yield of CO, nevertheless, it exhibits the highest yield of CH3OH (Fig. 6). These findings provide evidence for the fact that CO is converted into CH3OH on the catalyst surface.
As can be seen in Fig. 7(b), only 15NF exhibits around 2.1% CH4 yield at 200 °C. Moreover, it is noted that with an increase in the reaction temperature the CH4 yield also increases.
Remarkably, at 250 °C, the CH4 yield decreases with an increase in the amount of NiO. This CH4 formation can be correlated to a high-temperature Boudouard reaction, i.e., hydrogenation of carbon (C) to CH4. Furthermore, the decrease in the CH4 yield can be attributed to the oxidation of CH4 to CO2, thus decreasing the net CO2 conversion.
3.4. Effect of plasma discharge on the CO2 conversion and CH3OH yield
It should be noted that at room temperature the plasma discharge does not show any CO2 conversion. On the one hand, up to 150 °C, the plasma-thermal catalytic process exhibits less than 1% CO2 conversion. On the other hand, at 250 °C, despite around 10% CO2 conversion, CH4 was the major product in the thermal catalytic process. Moreover, we also found that when plasma discharge was ignited above 14 kV (2.6 kJ L−1) at 250 °C, owing to the exothermic reaction and plasma injected power, the quartz reactor was broken (repeated five times with a similar result observed). Therefore, the effect of plasma discharge on CO2 conversion and product distribution was investigated only at 200 °C and the results are reported in Fig. 8 and 9 as a function of specific input energy (SIE).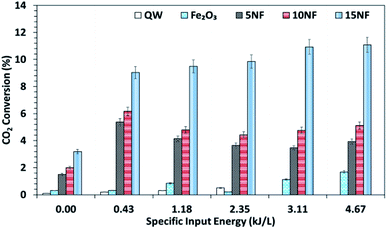 | ||
| Fig. 8 CO2 conversion at 200 °C as a function of the SIE. The SIE was varied between 0.43 and 4.67 kJ L−1 via changing the applied voltage at a fixed frequency of 50 Hz. | ||
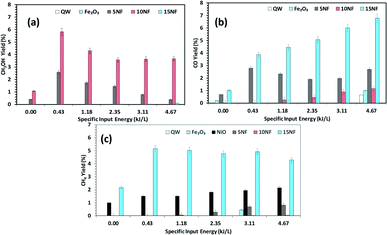 | ||
Fig. 9 Effects of the SIE on the product distribution at 200 °C. The yield of (a) CH3OH, (b) CO, and (c) CH4. Experimental conditions: catalyst, 0.5 g; H2![[thin space (1/6-em)]](https://www.rsc.org/images/entities/char_2009.gif) : :![[thin space (1/6-em)]](https://www.rsc.org/images/entities/char_2009.gif) CO 2, 3 CO 2, 3![[thin space (1/6-em)]](https://www.rsc.org/images/entities/char_2009.gif) : :![[thin space (1/6-em)]](https://www.rsc.org/images/entities/char_2009.gif) 1; total flow rate, 100 mL min−1. 1; total flow rate, 100 mL min−1. | ||
As showed in Fig. 8, without plasma discharge (denoted by 0.00 kJ L−1), the CO2 conversions were 1.5%, 2%, and 3.2% for 5NF, 10NF and 15NF, respectively. Interestingly, when plasma discharge was added (SIE of 0.43 kJ L−1, 0.8 W, 10.2 kV) the conversions increased to 5.4%, 6.2%, 10.2% for 5NF, 10NF and 15NF, respectively. Indeed, the three-fold increase in CO2 conversion could be due to the synergism between the plasma discharge and the catalyst.30 The plasma discharge along with thermal catalysis leads to changes in discharge behaviour and the plasma parameters can be found in Fig. S4–S8 in the ESI.† The inductive effect of heating and applying plasma is crucial to increasing the effective capacitance by virtue of charge separation. Remarkably, the CO2 conversion decreases upon an increase in the SIE. For example, when SIE was increased from 0.43 to 4.67 kJ L−1 the CO2 conversion decreased from 5.4% to 3.9% and 6.2% to 5.1% for the 5NF and 10NF catalysts, respectively. However, for the 15NF catalyst, the CO2 conversion increased from 9% to 11% with increasing SIE. The decrease in CO2 conversion for the 5NF and 10NF catalysts can be attributed to the water gas shift reaction (WGSR), as reported in eqn (5). The Ni-based catalyst is very active towards the WGSR, and the CO molecules are converted into CO2.18,40
 | (5) |
Fig. 9(a)–(c) shows a comparison of the yields of the major products quantified at the reactor downstream as a function of SIE at 200 °C. We evidenced that, similar to CO2 conversion, the CH3OH yield also increased when the plasma discharge was ignited. This finding emphasises the fact that plasma discharge activates the catalyst surface at low temperatures and facilitates the liquid fuel CH3OH production. As can be seen in Fig. 9(a), around 6% CH3OH yield is achieved with the 10NF catalyst at 0.43 kJ L−1 SIE, which is six-fold higher than the yield obtained under similar operating conditions in the absence of plasma. However, an increase in SIE had a negative effect on the CH3OH yield for both the 5NF and 10NF catalysts. The CH3OH yield decreases with increasing SIE, and around 4% is obtained with 4.67 kJ L−1 SIE. The decrease in the CH3OH yield can be attributed to (i) the decrease in CO2 conversion as demonstrated in Fig. 8 and (ii) the decomposition of the produced CH3OH to CO2. Notably, similar to the thermal catalytic process (Fig. 6) CH3OH was not produced with the 15NF catalyst for all of the investigated SIE values. This can be ascribed to the weak/absence of chemisorption of CO and H2 to produce CH3OH.
As reported in Fig. 9(b), at 200 °C the plasma discharge significantly improves the CO yield for all of the studied catalysts. Indeed, with the 15NF catalyst, the CO yield increased with increasing SIE. The enhanced CO yield can be attributed to the improved CO2 conversion, as shown in Fig. 8. Thus, it can be proposed that the inverse spinel NiFe2O4 assists the CO2 splitting into CO rather than undergoing a hydrogenation reaction to form CH3OH. Remarkably, the 10NF catalyst exhibited a maximum of 1% CO yield at 4.67 kJ L−1, since a maximum of converted CO2 was hydrogenated to CH3OH, as shown in Fig. 9(a). As can be seen in Fig. 2, the PXRD pattern confirms that the 15NF catalyst has an inverse spinel NiFe2O4 structure (ICDD database reference number 01-086-2267). In NiFe2O4, the active metal is encapsulated in the lattice of Fe2O3 making it difficult to reduce NiO to Ni at low temperature.41 Moreover, the NiO particles that are not encapsulated in the crystal lattice assist the conversion of CO2 to CO and hydrogenation products such as CH4. In our previous study, we confirmed that the pure NiO catalyst selectively produces CH4 and CO.31
As shown in Fig. 9(c), only the 15NF catalyst produces a significant amount of CH4. We also showed that the coupling of plasma at 200 °C doubled the CH4 yield. Moreover, the increase in SIE does not significantly influence the CH4 yield. Thus, it can be proposed that when the NiO mixing reaches an optimum value only then it does facilitate the further conversion of formate (which is one of the intermediates in CO2 to CH4 conversion) into CH4.35 Therefore, the catalyst becomes more selective towards CH4 rather than other products such as CO and CH3OH. Moreover, the CH4 production and the reverse WGSR are competitive reactions and an increase in applied voltage facilitates CO formation, as shown in Fig. 9(b).
These findings enabled us to propose the following hypotheses: (i) at 200 °C, the plasma discharge on the catalyst significantly modifies the catalyst surface, thus the catalytic activity decreases in line with the plasma treatment time and (ii) the NiO particle size is modified by the plasma discharge. To provide evidence to prove these hypotheses, the catalysts before and after plasma treatment were characterized using PXRD, TEM and XPS techniques, with the results discussed in the following section.
4. Effects of plasma discharge on catalyst changes
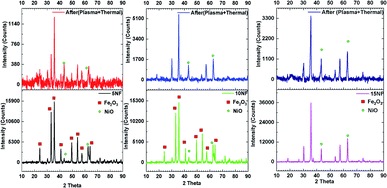
Fig. 10 shows a comparison of the PXRD patterns of the catalyst before and after 30 min of plasma treatment at 200 °C with 2.4 kJ L−1 SIE at a 1![[thin space (1/6-em)]](https://www.rsc.org/images/entities/char_2009.gif) :
:![[thin space (1/6-em)]](https://www.rsc.org/images/entities/char_2009.gif) 3 feed ratio of CO2
3 feed ratio of CO2![[thin space (1/6-em)]](https://www.rsc.org/images/entities/char_2009.gif) :
:![[thin space (1/6-em)]](https://www.rsc.org/images/entities/char_2009.gif) H2 (100 mL min−1). After plasma treatment, the 5NF and 10NF catalysts show different PXRD patterns compared to their patterns recorded as fresh catalysts. Thus, it can be concluded that the plasma discharge at low temperature brings about significant changes to the catalyst surface. We observed two important changes in the PXRD patterns: (i) the oxidation state of Fe is reduced from +3 to a mixture of +1 and +2, i.e. Fe2O3 to Fe3O4 and (ii) the NiO particle size is significantly reduced. Indeed, in thermal catalysis, even under reducing conditions at 200 °C, the catalyst does not show any significant changes. However, the additional energy provided by plasma discharge lowers the activation energy barrier and thus results in changes. Remarkably, in terms of the 15NF catalyst after plasma treatment, no significant modification was observed in the PXRD pattern. Moreover, the PXRD pattern of the synthesised 15NF catalyst matches an inverse spinel NiFe2O4 reference pattern from the ICDD database (reference number 01-086-2267). The NiFe2O4 is magnetic and crystallises in a face centred cubic structure. The NiFe2O4 has an inverse spinel structure, wherein Ni2+ occupies octahedral sites and Fe3+ occupies half of the tetrahedral and octahedral voids. The active metal oxide NiO is encapsulated in the lattice of Fe2O3 and it is difficult to reduce NiO under our operating conditions.38 After plasma treatment, the 10NF catalyst PXRD pattern exactly matches that of NiFe2O4, similar to the 15NF catalyst. However, the 10NF catalyst exhibits a higher CH3OH yield than 15NF.
H2 (100 mL min−1). After plasma treatment, the 5NF and 10NF catalysts show different PXRD patterns compared to their patterns recorded as fresh catalysts. Thus, it can be concluded that the plasma discharge at low temperature brings about significant changes to the catalyst surface. We observed two important changes in the PXRD patterns: (i) the oxidation state of Fe is reduced from +3 to a mixture of +1 and +2, i.e. Fe2O3 to Fe3O4 and (ii) the NiO particle size is significantly reduced. Indeed, in thermal catalysis, even under reducing conditions at 200 °C, the catalyst does not show any significant changes. However, the additional energy provided by plasma discharge lowers the activation energy barrier and thus results in changes. Remarkably, in terms of the 15NF catalyst after plasma treatment, no significant modification was observed in the PXRD pattern. Moreover, the PXRD pattern of the synthesised 15NF catalyst matches an inverse spinel NiFe2O4 reference pattern from the ICDD database (reference number 01-086-2267). The NiFe2O4 is magnetic and crystallises in a face centred cubic structure. The NiFe2O4 has an inverse spinel structure, wherein Ni2+ occupies octahedral sites and Fe3+ occupies half of the tetrahedral and octahedral voids. The active metal oxide NiO is encapsulated in the lattice of Fe2O3 and it is difficult to reduce NiO under our operating conditions.38 After plasma treatment, the 10NF catalyst PXRD pattern exactly matches that of NiFe2O4, similar to the 15NF catalyst. However, the 10NF catalyst exhibits a higher CH3OH yield than 15NF.
The only difference between these two catalysts is the plasma discharge assisted inverse spinal formation, at low temperature, from the NiO–Fe2O3 mixture. Thus, the enhanced catalytic activity of 10NF can be attributed to its particle size, the nature of its surface and the mixture of the formation of inverse spinel NiFe2O4 and Fe3O4.
Table 2 shows a comparison of the impact that plasma discharge has on the particle size and lattice parameters of NiO calculated from the PXRD patterns. This is evidence that the plasma discharge on the catalyst surface significantly reduces the particle size of NiO, irrespective of the amount of mixing. The d-spacing and lattice parameters of the 10NF and 15NF catalysts were also modified by plasma discharge, as observed in the shifting of the diffraction peaks to lower 2θ values. The shifting of the peaks is a result of a reduction in the NiO particle size. Moreover, the plasma discharge does not affect the Fe2O3 particle size. It should also be noted that after 30 min of plasma treatment the 15NF catalyst exhibited a particle size of around 13 nm, however, CH3OH was not produced, as shown in Fig. 9(a). Thus, it can be concluded that rather than the particle size, the nature of the spinel structure significantly influences the CO2 conversion and CH3OH selectivity.
| Catalyst | NiO particle size (nm) | d-spacing (Å) | Lattice parameter (Å) | |||
|---|---|---|---|---|---|---|
| Before | After | Before | After | Before | After | |
| 5NF | 40.8 | 13.2 | 3.25 | 3.25 | 6.51 | 6.51 |
| 10NF | 178 | 17.6 | 3.14 | 1.97 | 6.28 | 3.95 |
| 15NF | 8934 | 13.1 | 4.62 | 2.42 | 9.25 | 4.85 |
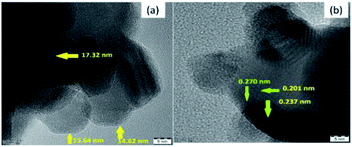
To provide evidence for the reduction in the particle size by plasma treatment, the plasma-treated 10NF catalyst was characterized by high-resolution TEM (HRTEM) and the results are shown in Fig. 11. The images reveal that the NiO particles are spherical in structure, the average particle size is 15.1 nm and the average d-spacing value is 0.228 nm (2.28 Å).
As shown in Table 2, after plasma treatment, from PXRD the calculated NiO particle size for 10NF was found to be 17.6 nm and the d-spacing was 0.197 nm (1.97 Å). The observed TEM and calculated PXRD result are in good agreement. Thus, it can be concluded that the plasma discharge at 200 °C on the powder sample significantly reduces the particle size and improves the CO2 conversion and CH3OH selectivity.
XPS analysis was carried out to obtain further information on the elemental composition and oxidation state of 10% NiO–Fe2O3 (10NF) catalyst before and after plasma treatment, with the results reported in Fig. 12(a)–(f). The X-ray source of the XPS measurements was Mg Kα, and the binding energies of the Fe 2p and Ni 2p spectra were calibrated according to the binding energy of C 1s of the adventitious C at 284.5 eV. The survey spectrum, before and after plasma treatment, exhibited only Fe, Ni and O along with C peaks, moreover, no significant difference was observed. As can be seen from Fig. 12(a), before plasma treatment two distinct peaks centered at 710.58 and 724.02 eV corresponding to the Fe 2p3/2 and Fe 2p1/2 spin–orbit peaks, respectively, were observed, identifying the Fe3+ oxidation state on the NiO–Fe2O3 surface.42 Interestingly, after plasma exposure for 30 min, the peak at 710.58 eV deconvolutes into two peaks centred at 710.08 and 711.78 eV. The oxidation states affect the binding energy of the material. The peak at 710.08 eV can be attributed to Fe2+ and the peak at 711.78 eV can be ascribed to Fe3+. These findings emphasise that plasma treatment reduces Fe3+ partially to Fe2+.39,43 Moreover, it should be noted that before plasma treatment there are fewer intensity signals for the shakeup satellites at 732.23 and 718.44 eV. Furthermore, after plasma treatment the intensity slightly increased and the peaks moved to higher binding energies (719.2 and 732.8 eV) indicating the presence of a separate hematite phase in the sample.
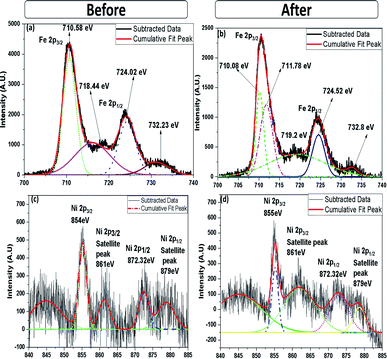 | ||
| Fig. 12 High-resolution (a) Fe 2p and (c) Ni 2p XPS spectra (before plasma treatment) and (b) Fe 2p and (d) Ni 2p XPS spectra (after plasma treatment). | ||
The Ni 2p spectra, before and after plasma treatment, are compared in Fig. 12(c) and (d). Before plasma treatment the sample exhibits two spin–orbit peaks of Ni 2p1/2 and Ni 2p3/2 at 872.32 and 854 eV, with two shakeup satellite peaks at 879 and 861 eV, indicating that Ni2+ and Ni3+ co-existed in the NiO–NiFe2O4 sample.44 Similar peaks also appeared for the plasma-treated sample, however, the intensity of the peaks at 861 and 879 eV decreased. Therefore, it can be suggested that the plasma treatment under a reducing atmosphere modifies the Ni2+ to Ni3+ ratio. Moreover, it should be noted that the appearance of the double peak features in the Ni 2p spectrum along with their consecutive shake-up satellite peaks reveal the magnetic chemical states Ni2+ and Ni3+ on the plasma-treated catalyst surface.45
From the extensive catalyst characterisation, before and after plasma treatment, it is proposed that the mixture of compounds such as NiO–Fe2O3, inverse spinel NiFe2O4 and Fe3O4 assist CO2 conversion and CH3OH production. Moreover, the inverse spinel NiFe2O4, i.e. 15% NiO–Fe2O3 catalyst, shows CO2 conversion, however, it assists only CH4 production. Nevertheless, in situ surface investigation is needed to confirm the role of the various phases of Fe2O3 in the conversion of CO2 under plasma discharge.
5. Conclusions
In the present work, it was demonstrated that CH3OH could be synthesised using the binary metal oxide NiO–Fe2O3. The pure metal oxides, namely NiO and Fe2O3, exhibit no significant amount of CO2 conversion. However, for the binary mixed oxide, CO2 conversion and CH3OH production were greatly increased. We also provided evidence that the intermediate CO is adsorbed on the catalyst surface with modest energy, thus it can be easily hydrogenated to CH3OH. With an increase in the amount of NiO in Fe2O3, the particle size increased tremendously and decreased the CO2 conversion during thermal catalysis.A synergistic effect is observed when plasma is combined with thermal heating, and this improves CO2 conversion. The CO2 conversion and CH3OH yield were increased by 3- and 5-fold, respectively, at a SIE of 0.43 kJ L−1 over the 10NF catalyst. The observed synergism is due to the generation of reactive species on the catalyst surface via plasma discharge, which speeds up CO2 conversion and CH3OH formation. The 10NF catalyst exhibited the best CH3OH production, whereas the 15NF catalyst was selective towards CH4. It can be proposed that a low amount of NiO mixing (<10%) leads to the RWGS reaction, yielding CO as the main product, however, a high amount of NiO mixing leads to CH4 formation.
We also showed that plasma treatment at 200 °C significantly reduced the NiO particle size, however, it did not affect the Fe2O3 particles. Moreover, it was demonstrated that the plasma treatment induced phase transformation at low temperatures and led to the formation of a mixture spinel structure. The catalyst with a mixed spinel structure assisted CO2 conversion and CH3OH production.
Conflicts of interest
There are no conflicts to declare.Acknowledgements
The authors greatly acknowledge the Science & Engineering Research Board, Department of Science & Technology, Government of India (SERB, File No. ECR/2016/001457) for financial support. We acknowledge the Nanotechnology Research Centre (NRC), and the HRTEM and HRSEM facility at SRMIST for providing research facilities.References
- G. P. Peters, G. Marland, C. Le Quere, T. Boden, J. G. Canadell and M. R. Raupach, Nat. Clim. Change, 2011, 2, 2–4 CrossRef.
- J. D. Shakun, P. U. Clark, F. He, S. A. Marcott, A. C. Mix and Z. Y. Liu, Nature, 2012, 484, 49–55 CrossRef CAS.
- N. P. Gillett, V. K. Arora, K. Zickfeld, S. J. Marshall and W. J. Merryfield, Nat. Geosci., 2011, 4, 83–87 CrossRef CAS.
- M. E. Boot-Handford, J. C. Abanades, E. J. Anthony, M. J. Blunt, S. Brandani and N. Mac Dowell, Energy Environ. Sci., 2014, 7, 130–189 RSC.
- M. L. Szulczewski, C. W. MacMinn, H. J. Herzog and R. Juanes, Proc. Natl. Acad. Sci. U. S. A., 2012, 109, 5185–5189 CrossRef CAS.
- C. Das Neves Gomes, O. Jacquet, C. Villiers, P. Thuery, M. Ephritikhine and T. Cantat, Angew. Chem., 2012, 51, 187–190 CrossRef CAS.
- A. Taheri Najafabadi, Int. J. Energy Res., 2013, 37, 485–499 CrossRef CAS.
- M. Burkhardt and G. Busch, Appl. Energy, 2013, 111, 74–79 CrossRef CAS.
- F. Studt, I. Sharafutdinov, F. Abild-Pedersen, C. F. Elkjaer, J. S. Hummelshoj and S. Dahl, Nat. Chem., 2014, 6, 320–324 CrossRef CAS PubMed.
- M. Taherimehr and P. P. Pescarmona, J. Appl. Polym. Sci., 2014, 131, 41141–41157 CrossRef.
- W. Wang, S. P. Wang, X. B. Ma and J. L. Gong, Chem. Soc. Rev., 2011, 40, 3703–3727 RSC.
- X. B. Lu and D. J. Darensbourg, Chem. Soc. Rev., 2012, 41, 1462–1484 RSC.
- M. Bowker, ChemCatChem, 2019, 11, 4238–4246 CrossRef CAS.
- X. Tu, H. J. Gallon, M. V. Twigg, P. A. Gorry and J. C. Whitehead, J. Phys. D: Appl. Phys., 2011, 44, 274007 CrossRef.
- J. Ren, X. Qin, J.-Z. Yang, Z.-F. Qin, H.-L. Guo, J.-Y. Lin and Z. Li, Fuel Process. Technol., 2015, 137, 204–211 CrossRef CAS.
- J. Wei, Q. Ge, R. Yao, Z. Wen, C. Fang, L. Guo, H. Xu and J. Sun, Nat. Commun., 2017, 8, 15174 CrossRef PubMed.
- C. Zhou, J. Shi, W. Zhou, K. Cheng, Q. Zhang, J. Kang and Y. Wang, ACS Catal., 2020, 10, 302–310 CrossRef CAS.
- X. Jiang, X. Nie, X. Guo, C. Song and J. G. Chen, Chem. Rev., 2020, 120, 7984–8034 CrossRef CAS PubMed.
- W. Li, H. Wang, X. Jiang, J. Zhu, Z. Liu, X. Guo and C. Song, RSC Adv., 2018, 8, 7651–7669 RSC.
- D. Wierzbicki, M. V. Moreno, S. Ognier, M. Motak, T. Grzybek, P. Da Costa and M. E. Gálvez, Int. J. Hydrogen Energy, 2020, 45, 10423–10432 CrossRef CAS.
- X. Ma, S. Li, M. Ronda-Lloret, R. Chaudhary, L. Lin, G. van Rooij and V. Hessel, Plasma Chem. Plasma Process., 2019, 39, 109–124 CrossRef CAS.
- E. Jwa, S. B. Lee, H. W. Lee and Y. S. Mok, Fuel Process. Technol., 2013, 108, 89–93 CrossRef CAS.
- I. Michielsen, Y. Uytdenhouwen, J. Pype, B. Michielsen, J. Mertens, F. Reniers, V. Meynen and A. Bogaerts, Chem. Eng. J., 2017, 326, 477–488 CrossRef CAS.
- L. Wang, Y. Yi, H. Guo and X. Tu, ACS Catal., 2017, 8, 90–100 CrossRef.
- L. Sivachandiran, P. Da Costa and A. Khacef, Appl. Surf. Sci., 2020, 501, 144175 CrossRef CAS.
- I. Belov, S. Paulussen and A. Bogaerts, Plasma Sources Sci. Technol., 2016, 25, 015023 CrossRef.
- K. Van Laer and A. Bogaerts, Energy Technol., 2015, 3, 1038–1044 CrossRef CAS.
- J. Sentek, K. Krawczyk, M. Młotek, M. Kalczewska, T. Kroker, T. Kolb, A. Schenk, K.-H. Gericke and K. Schmidt-Szałowski, Appl. Catal., B, 2010, 94, 19–26 CrossRef CAS.
- H. K. Song, J.-W. Choi, S. H. Yue, H. Lee and B.-K. Na, Catal. Today, 2004, 89, 27–33 CrossRef CAS.
- M. Kraus, W. Egli, K. Haffner, B. Eliasson, U. Kogelschatz and A. Wokaun, Phys. Chem. Chem. Phys., 2002, 4, 668–675 RSC.
- A. Bill, B. Eliasson, U. Kogelschatz and L. M. Zhou, Stud. Surf. Sci. Catal., 1998, 114, 541–544 CrossRef CAS.
- B. Eliasson, U. Kogelschatz, B. Xue and Li-M. Zhou, Ind. Eng. Chem. Res., 1998, 37, 3350–3357 CrossRef CAS.
- M. Ronda-Lloret, Y. Wang, P. Oulego, G. Rothenberg, X. Tu and N. R. Shiju, ACS Sustainable Chem. Eng., 2020, 8, 17397–17407 CrossRef CAS PubMed.
- N. Joshi and S. Loganathan, Plasma Process Polym., 2021, 18(5), 2000104 CrossRef CAS.
- T. C. Manley, Trans. Electrochem. Soc., 1943, 84, 83–96 CrossRef.
- T. Butterworth, R. Elder and R. Allen, Chem. Eng. J., 2016, 293, 55–67 CrossRef CAS.
- K. Zhao, W. Wang and Z. Li, J. CO2 Util., 2016, 16, 236–244 CrossRef CAS.
- Z. Zhang, Y. Tian, L. Zhang, S. Hu, J. Xiang, Y. Wang and X. Hu, Int. J. Hydrogen Energy, 2019, 44, 9291–9306 CrossRef CAS.
- Y. Zhang, W. Chu, W. Cao, C. Luo and X. Wen, A Plasma-Activated Ni/α-Al2O3 Catalyst for the Conversion of CH4 to Syngas, Plasma Chem. Plasma Process., 2000, 20, 137–144 CrossRef CAS.
- C. Ratnasamy and J. P. Wagner, Catal. Rev., 2009, 51, 325–440 CrossRef CAS.
- R. Benrabaa, H. Boukhlouf, A. Löfberg, A. Rubbens, R. N. Vannier, E. Bordes-Richard and A. Barama, J. Nat. Gas Chem., 2012, 21, 595–604 CrossRef CAS.
- P. Li, E. Y. Jiang and H. L. Bai, J. Phys. D: Appl. Phys., 2011, 44, 075003 CrossRef.
- K. D. Wright and A. R. Barron, J. Carbon Res., 2017, 3, 17 CrossRef.
- G. Liu, X. Gao, K. Wang, D. He and J. Li, Int. J. Hydrogen Energy, 2016, 41, 17976–17986 CrossRef CAS.
- J. S. Shaikh, R. C. Pawar, R. S. Devan, Y. R. Ma, P. P. Salvi, S. S. Kolekar and P. S. Patil, Electrochim. Acta, 2011, 56, 2127 CrossRef CAS.
Footnote |
| † Electronic supplementary information (ESI) available. See DOI: 10.1039/d1ra04852j |
| This journal is © The Royal Society of Chemistry 2021 |

