 Open Access Article
Low cost, high efficiency flexible supercapacitor electrodes made from areca nut husk nanocellulose and silver nanoparticle embedded polyaniline†
Soorya Sasia,
C. Ardra Krishnad,
Sunish K. Sugunan b,
Akash Chandrand,
P. Radhakrishnan Nair*a,
K. R. V. Subramanianc and
Suresh Mathew
 *ad
*ad
aAdvanced Molecular Materials Research Centre, Mahatma Gandhi University, Kottayam, 686 560, Kerala, India. E-mail: sureshmathewmgu@gmail.com
bDepartment of Chemistry, Kottayam CMS College (Autonomous) – affiliated to Mahatma Gandhi University, Kottayam, 686 001, Kerala, India
cDept. of Mechanical Engineering, Ramaiah Institute of Technology, Bangalore, 560 054, India
dSchool of Chemical Sciences, Mahatma Gandhi University, Priyadarshini Hills, Kottayam, 686 560, Kerala, India
First published on 2nd September 2021
Abstract
Energy storage is a key aspect in the smooth functioning of the numerous gadgets that aid easy maneuvering through modern life. Supercapacitors that store energy faradaically have recently emerged as potential inventions for which mechanical flexibility is an absolute requirement for their future applications. Flexible supercapacitors based on nanocellulose extracted from easily available waste materials via low cost methods have recently garnered great attention. In the present work, we discuss the construction of flexible, binder-free supercapacitive electrodes using nanocellulose extracted from locally available areca nut husks and polyaniline embedded with silver nanoparticles. The prepared electrodes were characterized using SEM, TEM, XRD, FTIR, EDX and electrochemical characterization techniques such as CV, galvanostatic charge–discharge, chronoamperometry and EIS. A specific capacitance of 780 F g−1 was obtained for the silver nanoparticle embedded polyaniline–nanocellulose (Ag–PANI–NC) substrate supported electrodes, which is ∼4.2 times greater than that of bare polyaniline–nanocellulose electrodes. We attributed this enhancement to a lowering of the activation energy barrier of correlated electron hopping among localized defect states in the composite matrix by the Ag nanoparticles. An energy density value of 15.64 W h kg−1 and a power density of 244.8 W kg−1 were obtained for the prepared electrodes. It was observed that the Ag–PANI–NC based electrode can retain ∼98% of its specific capacitance upon recovery from mechanical bending to extreme degrees.
Introduction
An unequivocal fact is that energy is the central dogma of the sustenance of life and that the essential advancement of human civilization depends on various natural or artificial forms of workable energy, which requires the development, invention and deployment of gadgets of various forms and functional properties that can harvest, store and convert energy.1 Numerous efficient devices have been established to harvest energy from many sources, of which energy storage devices, which can deliver stored energy for later usage, have been highly sought after for the uninterrupted functioning of the various gadgets required for everyday work.2 Capacitors, batteries, fuel cells etc. fall into this category. Of late, a recent descendant of the capacitor family, supercapacitors, which are capable of delivering high power densities and reasonable energy densities, are creating new trends in energy storage.3Recently, a number of articles describing the development of flexible supercapacitors have emerged,4 for which a combination of mechanical flexibility and high electrical output makes these devices suitable for applications in wearable electronics, wearable power supply devices, regenerative braking in motor vehicles, etc.5 These devices store energy predominantly by reversible faradaic redox reactions at the interface of an electrolyte and an electrode made of an electroactive material.6 However, capacitance due to electric double layer formation may also contribute to the overall energy storage mechanism, depending on the type of materials employed and the structure of the device.7 These devices demonstrate exceptional endurance when tested under repeated mechanical deformation, such as twisting, bending and stretching to severe degrees. Typically, flexible supercapacitor electrodes are prepared by coating the electrode material onto a flexible substrate, which is usually of metallic origin,8 or other conducting electrodes such as graphene.9 Nanocellulose is ubiquitous in nature and can be prepared from cellulose rich biomass via top-down synthetic methods involving various physical and chemical processes.10 Nanocellulose has unique properties, such as high mechanical strength, a lightweight structure and low thermal expansion, which make it an ideal building block for the development of advanced functional materials.11 Research on nanocellulose isolation and its application has been growing rapidly and nanocellulose has been widely used in transparent materials that can replace glass, reinforced polymer nanocomposites, biomimetic materials, sensors and energy harvesting and storage devices.12 Among these applications, the applicability of nanocellulose in electrodes and separators in energy storage devices, such as EDLCs and pseudocapacitors, has received great attention due to its high surface area, tunable porous structure, and excellent thermal stability.13 It is well established that the electrochemical properties of such electrode materials can be tuned and improved by integrating faradaic materials such as metal oxides or conducting polymers into the nanocellulose and nanocellulose-derived carbon matrices.14 Recently, papers and fabrics made of nanocellulose15–17 were reported as potential flexible substrates for the deposition of electroactive materials.18 Charge is stored electrostatically in these types of electrodes, where low internal resistances are required to facilitate rapid electron and ion transport.19 In order to enhance the electrical properties of these electrodes, conducting polymers like polyaniline (PANI), polypyrrole, etc. are frequently added to the nanocellulose materials.20 PANI is a low-cost electrically conducting polymer with high electrochemical and thermal stabilities and reversible pseudocapacitance properties.21 The pseudocapacitance of PANI depends upon the degree of redox reaction in which the doped ions are reversibly adsorbed onto and desorbed from the backbone chain of PANI. PANI exhibits four oxidation states, each bearing distinct names, viz. leucoemeraldine, emeraldine base, emeraldine salt and pernigraniline. Leucoemeraldine is the completely reduced state of PANI, whereas pernigraniline is its completely oxidized state.22 It was reported that the electrical conductivity of PANI could be increased by the incorporation of silver nanoparticles into the PANI matrix.23
Herein, we report the fabrication of efficient low-cost flexible supercapacitor electrodes fabricated from a composite of nanocellulose–silver nanoparticle embedded PANI (Ag–PANI–NC) where the nanocellulose is derived from the husk of locally available areca nuts. We have selected a bio-waste material like areca nut husk for making the nanocellulose because of its low cost and easy availability. Our hypothesis is that the highly fibrous structure of the areca nut husks could be beneficial in increasing the ionic conductivity of the composite when it is being used as an ingredient in the capacitor electrode material. We find that our hypothesis is well supported by the flexible supercapacitor electrodes derived from the Ag–PANI–NC composite that delivers a specific capacitance of 780 F g−1, an energy density value of 15.64 W h kg−1 and a power density of 244.8 W kg−1, which, to the best of our knowledge, place our electrodes among some of the best performing electrodes derived from nanocellulose–polymer composites.24
Materials and methods
Materials used
Aniline, 99.5% (Merck), HCl, 37% (Merck), ammoniumperoxidisulphate, 98% (Merck), ammonium hydroxide, 30% (Merck), ethanol, 96% (Merck), NaOH, 99% (Merck), KOH, 85% (Merck), KCl, 99.5% (Merck), NaClO (Merck), silver nitrate, 99% (Merck), N-methyl-2-pyrrolidone, 99.5% (Sigma-Aldrich) and distilled water were used.Methods
![[thin space (1/6-em)]](https://www.rsc.org/images/entities/char_2009.gif) :
:![[thin space (1/6-em)]](https://www.rsc.org/images/entities/char_2009.gif) 1 v/v) for 48 hours at 50 °C for dewaxing. The fibers were then submerged in boiling water for 2 hours, and then washed and dried. The dried fibers were cut and shortened to a length of 1 cm. Lignin and hemicelluloses contents were removed by treating the fibers with 5% NaOH solution at a temperature of 50 °C for 24 hours. The fibers were then washed several times with distilled water until the solution attained a neutral pH value. The fibers were then treated with 3.5 M HCl to break up the cell wall of the fiber. The obtained microfibrils of areca nut cellulose26 were washed until the pH of the solution became neutral (∼7).
1 v/v) for 48 hours at 50 °C for dewaxing. The fibers were then submerged in boiling water for 2 hours, and then washed and dried. The dried fibers were cut and shortened to a length of 1 cm. Lignin and hemicelluloses contents were removed by treating the fibers with 5% NaOH solution at a temperature of 50 °C for 24 hours. The fibers were then washed several times with distilled water until the solution attained a neutral pH value. The fibers were then treated with 3.5 M HCl to break up the cell wall of the fiber. The obtained microfibrils of areca nut cellulose26 were washed until the pH of the solution became neutral (∼7).These microfibrils were then ground into a pulp form. The as-obtained pulp was treated with NaOH to remove the remaining noncellulose constituents, followed by treatment with HCl27 for delignification.28 The microfibrils were then bleached by treating with a 4![[thin space (1/6-em)]](https://www.rsc.org/images/entities/char_2009.gif) :
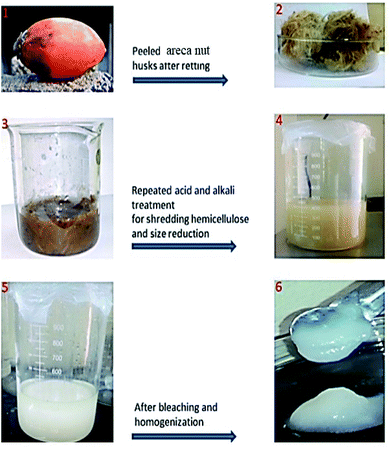
:![[thin space (1/6-em)]](https://www.rsc.org/images/entities/char_2009.gif) 1 mixture of sodium hypochlorite (NaClO) and glacial acetic acid at 60 °C for 4 hours. The process was repeated thrice to ensure that complete bleaching had occurred. The fibrils were then washed with distilled water to attain a neutral pH (∼7). The product obtained was then homogenized by ultrasonication for 5 hours at 0 °C for preventing the overheating of the fibers. Fig. 1 shows the preparation pathway of nanocellulose.
1 mixture of sodium hypochlorite (NaClO) and glacial acetic acid at 60 °C for 4 hours. The process was repeated thrice to ensure that complete bleaching had occurred. The fibrils were then washed with distilled water to attain a neutral pH (∼7). The product obtained was then homogenized by ultrasonication for 5 hours at 0 °C for preventing the overheating of the fibers. Fig. 1 shows the preparation pathway of nanocellulose.
![[thin space (1/6-em)]](https://www.rsc.org/images/entities/char_2009.gif) :
:![[thin space (1/6-em)]](https://www.rsc.org/images/entities/char_2009.gif) 1 water fiber weight ratio) and the mixture was subjected to ultrasonication for 5 hours at 0 °C to yield the Ag–PANI–NC composite.
1 water fiber weight ratio) and the mixture was subjected to ultrasonication for 5 hours at 0 °C to yield the Ag–PANI–NC composite.Results and discussion
Scanning electron microscopy (SEM)
Fig. S1 (Fig. 1 in the ESI†) shows the SEM image of the silver nanoparticle embedded PANI (Ag–PANI) and Ag–PANI–NC composite. Fig. S1A and B† show the SEM images of Ag–PANI at two different magnifications. In Fig. S1A,† clusters of PANI decorated with Ag nanoparticles are shown. In Fig. S1B,† it is clearly shown that tiny Ag particles are adsorbed on the surface of PANI. Fig. S1C† shows a SEM image of the PANI–NC composite where the PANI–NC composite shows a clustered structure in which both of the components are found together. Fig. S1D† shows the composite in which nanofibers adsorbed with Ag embedded in PANI are clearly shown.Transmission electron microscopy (TEM)
Fig. S2A and B† depict the TEM images of the Ag–PANI–NC, which unambiguously indicate that the silver nanoparticles are decorated on the surface of the Ag–PANI–NC composite. From the TEM images, it can be deduced that PANI nanorods with diameters of about 7 nm and lengths of 20 nm and silver nanoparticles with diameters of about 8 nm are formed. The formed nanocellulose fibers are of about 20–50 nm in diameter and several micrometres in length. The HRTEM image in Fig. S2C,† shows a single crystal silver nanoparticle with well-defined crystal lattice fringes. From the image, a lattice spacing of 0.23 nm, corresponding to the (111) interplanar spacing of the silver nanoparticle, was deduced. The selected area electron diffraction (SAED) pattern, shown in Fig. S2D,† shows a ring pattern with some crystalline spots, which indicates the presence of small single crystals which can be attributed to the presence of silver nanoparticles.X-ray diffraction (XRD)
Fig. 3 shows the XRD pattern of the nanocellulose fiber and Ag embedded polyaniline. The XRD pattern of the nanocellulose fiber (Fig. 3A) shows a peak at 22.2° 2θ, which indicates the formation of nanocellulose from cellulose,29 and another set of peaks at 16.1° and 44.9° 2θ representing the cellulose Iβ structure.30 The characteristic peaks of pure polyaniline (Fig. 3B) were found at 15.7, 20.4 and 25.8 2θ, corresponding to the 011, 020 and 200 crystal planes of PANI.31 The XRD patterns of Ag–PANI demonstrate sharp peaks which clearly indicate the crystalline nature of both nanocellulose and Ag embedded PANI. From Fig. 3C, a characteristic XRD peak of PANI can be observed at 24.89° 2θ, whereas the peaks of the Ag nanoparticles can be seen at 27.71°, 32.21°, 38.09°, 44.21°, 46.19° and 57.47° 2θ; these peaks represent the diffraction planes 210, 113, 111, 200, 124 and 240, respectively, of the Ag nanoparticles.32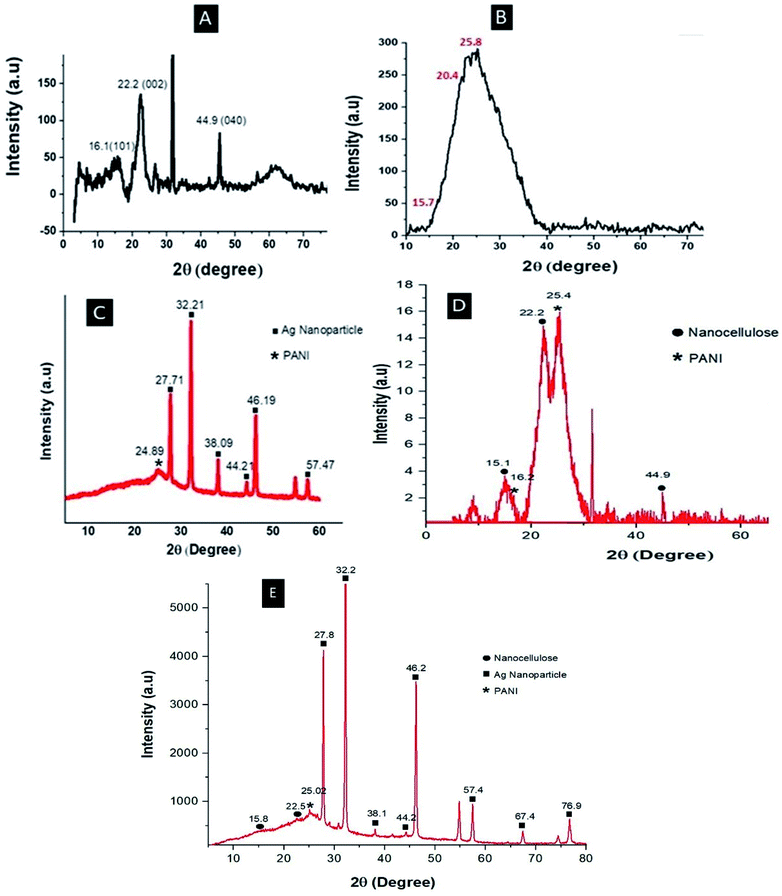 | ||
| Fig. 3 XRD patterns of (A) nanocellulose, (B) PANI, (C) Ag–PANI, (D) PANI–NC and (E) the Ag–PANI–NC composite. | ||
The peaks in Fig. 3C match very well with the standard spectrum of silver nanocrystals (JCPDS no. 4-0783). XRD analysis of Ag–PANI thus confirms that the silver particles are effectively embedded within the PANI matrix. The XRD pattern of PANI–NC (Fig. 3D) clearly shows the characteristic peaks of PANI and nanocellulose, where the characteristic peaks of PANI appear at 16.2° and 25.4° 2θ, and those of the nanocellulose are discernible at 15.1°, 22.2° and 44.9°. Fig. 3E shows the XRD pattern of the Ag–PANI–NC composite, where the characteristic sharp peaks of the crystalline Ag nanoparticles can be visualized at 27.8°, 32.2°, 38.1°, 44.2°, 46.2°, 57.4°, 67.4° and 76.9° 2θ, corresponding to the diffraction planes 210, 113, 111, 200, 124, 240, 220 and 311, respectively. The peak representing PANI in the Ag–PANI–NC composite can be observed at 25.02° 2θ and peaks representing nanocellulose are at 15.8° and 22.5° 2θ. The XRD data thus gives a clear picture of the constituents of each of the materials examined and provide insight into their crystallinity, corroborating the discussions in the forthcoming sections (vide infra).
Fourier-transform infrared spectroscopy (FTIR)
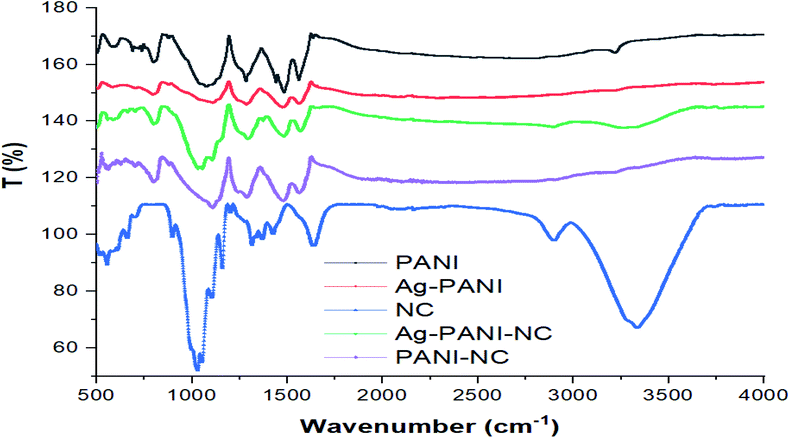
Fig. 4 gives the FTIR spectra of PANI (black), Ag–PANI (red), nanocellulose (blue), PANI–NC (purple) and the Ag–PANI–NC composite (green). The FTIR spectrum of PANI reveals peaks at 1562 and 1483 cm−1 due to the non-symmetric vibration of C–H bonds in the quinoid and benzenoid parts of the polymer backbone structure, respectively. The spectrum again shows the stretching vibrations of the C–N bond in the quinoid and benzenoid units at 1285 cm−1. A spectral feature corresponding to the out-of-plane bending vibration of the C–H bonds of the para-disubstituted benzenoid rings can also be seen as a low energy shoulder between 800–900 cm−1. The relatively weak peak observed at 3217 cm−1 can be attributed to the N–H stretching vibrations of the typical secondary aromatic amines that serve as bridges between the benzenoids in the backbone of PANI. In addition, the presence of the secondary amine unit can also be confirmed by the presence of an absorption band at 1500 cm−1, which indicates the bending vibration of N–H bonds typical of aromatic secondary amines.The strong band at 1079–1125 cm−1 is a measure of the degree of electron delocalization in PANI and hence it is a characteristic feature representing the conductivity of the polymer.33 The FTIR data unequivocally indicate that the synthesized sample is nothing but PANI. The FTIR spectrum of Ag–PANI (red) shows similar bands as that of PANI, but with a slight decrease in the peak intensities of the C–N and CQN stretching modes, suggesting interactions of considerable magnitude between PANI and the Ag nanoparticles. Furthermore, when compared to the spectrum of pure PANI, appreciable reductions in the intensities of the peaks at 1500 and 3217 cm−1, representing the bending and stretching modes of the N–H bond, respectively, are visible for the Ag–PANI composite, which unambiguously prove that the secondary amine unit of PANI plays a crucial role in interacting with the Ag nanoparticles and hence in the formation of the composite. The spectrum of nanocellulose (blue) resembles that of cellulose after delignification.34 The spectral peak at 3335 cm−1 represents the stretching vibration of the hydrogen bonded –OH functional groups and the band at 2899 cm−1 corresponds to the stretching vibration of the C–H bonds in the pyranoid rings. The spectral features at 1426 cm−1, 1315 cm−1, 1159 cm−1 and 1029 cm−1 correspond to the –OCH in-plane bending, C–H deformation, C![[double bond, length as m-dash]](https://www.rsc.org/images/entities/char_e001.gif) C stretching and C–O–C stretching, respectively. The peak at around 1700 cm−1 can be attributed to the stretching of the C
C stretching and C–O–C stretching, respectively. The peak at around 1700 cm−1 can be attributed to the stretching of the C![[double bond, length as m-dash]](https://www.rsc.org/images/entities/char_e001.gif) O group of the acetyl and uronic ester groups of hemicelluloses or the ester carbonyl groups of coumaric units of lignin in the areca nut fibers.35 The spectrum of PANI–NC (purple) shows a peak at 3205 cm−1, representing the stretching vibration of the hydrogen bonded –OH functional groups, and a band at 2897 cm−1, corresponding to the stretching vibration of the C–H bonds of the pyranoid rings of the polymer backbone. The spectral features at 1475 cm−1, 1287 cm−1 and 1106 cm−1 are characteristic of the nanocellulose and the peaks visible at 1563 and 1481 cm−1 correspond to the non-symmetric vibration of the C–H bonds in the quinoid and benzenoid parts of the polymer backbone structure of PANI, respectively. The stretching vibrations of the C–N bond in the quinoid and benzenoid units at 1287 cm−1 and a peak corresponding to the out-of-plane bending vibration of the C–H bonds of para-disubstituted benzenoid rings at 798 cm−1 can also be seen.
O group of the acetyl and uronic ester groups of hemicelluloses or the ester carbonyl groups of coumaric units of lignin in the areca nut fibers.35 The spectrum of PANI–NC (purple) shows a peak at 3205 cm−1, representing the stretching vibration of the hydrogen bonded –OH functional groups, and a band at 2897 cm−1, corresponding to the stretching vibration of the C–H bonds of the pyranoid rings of the polymer backbone. The spectral features at 1475 cm−1, 1287 cm−1 and 1106 cm−1 are characteristic of the nanocellulose and the peaks visible at 1563 and 1481 cm−1 correspond to the non-symmetric vibration of the C–H bonds in the quinoid and benzenoid parts of the polymer backbone structure of PANI, respectively. The stretching vibrations of the C–N bond in the quinoid and benzenoid units at 1287 cm−1 and a peak corresponding to the out-of-plane bending vibration of the C–H bonds of para-disubstituted benzenoid rings at 798 cm−1 can also be seen.
The spectrum of the Ag–PANI–NC composite, when compared to the spectra of nanocellulose and Ag–PANI, clearly demonstrates strong intermolecular interactions between the nanocellulose and Ag–PANI that form the composite. While forming the final composite, Ag–PANI–NC, nanocellulose shows considerable decreases in the intensities of the peaks at 1029 cm−1 (C–O–C str), 1700 cm−1 (C![[double bond, length as m-dash]](https://www.rsc.org/images/entities/char_e001.gif) O str) and 3335 cm−1 (–OH), signifying the role of oxygen in binding with the Ag–PANI composite. The overall reduction in the intensity of peaks of the Ag–PANI–NC composite with respect to those of nanocellulose and Ag–PANI could be attributed to the coverage of the nanocellulose surface with the Ag embedded PANI layer. The existence of the stretching vibration of the benzoid form of PANI at 1567 cm−1 in all of the samples, and especially in the composite, demonstrates that PANI is uniformly distributed throughout the composite. It may be noted that the ratio of the integrated area of the quinoid vibrations to that of the benzenoid vibrations is greater for both Ag–PANI and the Ag–PANI–NC composite than that of pristine PANI, indicating an enhanced conjugation length in the composites compared to that of pure PANI, which could endow with better electron transport through the composite.36
O str) and 3335 cm−1 (–OH), signifying the role of oxygen in binding with the Ag–PANI composite. The overall reduction in the intensity of peaks of the Ag–PANI–NC composite with respect to those of nanocellulose and Ag–PANI could be attributed to the coverage of the nanocellulose surface with the Ag embedded PANI layer. The existence of the stretching vibration of the benzoid form of PANI at 1567 cm−1 in all of the samples, and especially in the composite, demonstrates that PANI is uniformly distributed throughout the composite. It may be noted that the ratio of the integrated area of the quinoid vibrations to that of the benzenoid vibrations is greater for both Ag–PANI and the Ag–PANI–NC composite than that of pristine PANI, indicating an enhanced conjugation length in the composites compared to that of pure PANI, which could endow with better electron transport through the composite.36
Energy dispersive X-ray diffraction (EDX)
EDX spectra and the corresponding elemental mapping images of PANI–NC, Ag–PANI and the Ag–PANI–NC composite were acquired to scrutinize their elemental compositions and are shown in Fig. S3† and 5, respectively. The EDX spectrum of PANI–NC (Fig. S3A†) shows peaks that correspond to about 77% C, 15% O and 8% N. This, together with the data from the element overlay mapping image shown in Fig. 5(A) and (a) and the individual mapping images of the elements (Fig. S4A†), conclusively proves that the composite is a nice blend of PANI and NC. The EDX spectrum of the Ag–PANI composite, on the other hand, showed 42% C, 12% O, 6% N and 40% Ag. Considered together with the overlay element mapping images (Fig. 5(B) and (b)) and individual mapping images of the elements (Fig. S4B†), this shows that silver nanoparticles are homogeneously distributed in the PANI matrix. Finally, the EDX spectrum (Fig. S3C†), demonstrating 57% C, 12% O, 6% N and 25% Ag, a composite image of elemental mapping (Fig. 5(C) and (c)) and maps of the distribution of individual elements (Fig. S4C†) indicate that the silver nanoparticles are effectively incorporated into a matrix formed of PANI and NC. However, a significant increase in the carbon content and decrease in the percentages of nitrogen, oxygen, and silver observed in the EDX spectrum and the element mapping images of the Ag–PANI–NC composite, when compared to that of the Ag–PANI composite, indicate the effective incorporation of nanocellulose into the Ag–PANI matrix without affecting the distribution of Ag nanoparticles in the matrix much, which nicely corroborate the observations from the SEM, TEM and IR data (vide supra).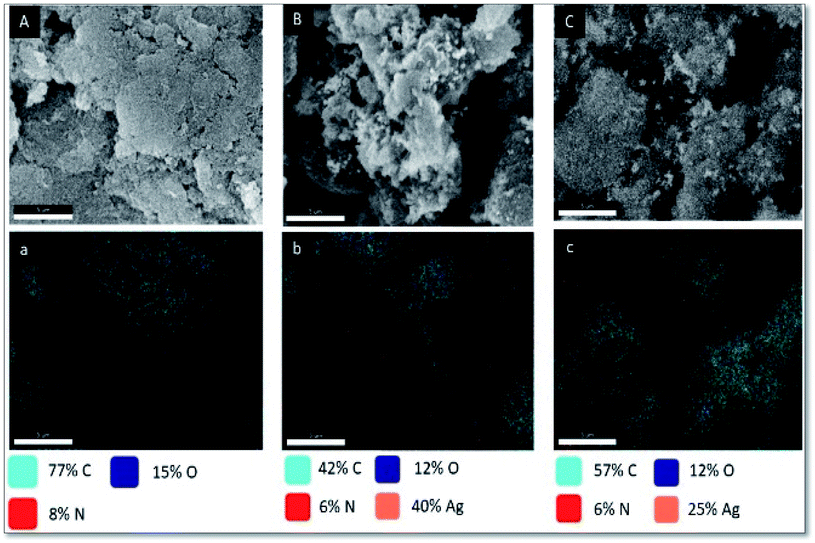 | ||
| Fig. 5 FESEM image and elemental mapping of (A & a) PANI–NC, (B & b) Ag–PANI and (C & c) Ag–PANI–NC. | ||
Electrochemical characterization
Cyclic voltammetry (CV), galvanostatic charge–discharge (GCD), chronoamperometry (CA) and electrochemical impedance spectroscopy (EIS) of the electrodes in a mixture of 0.5 M KCl and 0.5 M KOH electrolytes were carried out to analyse the effect of silver nanoparticles on the charge storage capacity of the electrodes, and are shown in Fig. S5A, B, C and D,† respectively. Fig. S5A† shows the CV curve of the bare PANI–NC composite (black curve) and the Ag–PANI–NC composite (red curve), measured at a scan rate of 10 mV s−1. The CV curve of the Ag–PANI–NC electrode shows a pair of redox peaks, which clearly indicate the occurrence of a reversible faradic process at the electrode surface and hence confirms the pseudocapacitive behaviour of the electrodes. The apparent benefit of the nanoparticle inclusion was further evident from the average specific capacitance values extracted from the CV curves; the Ag–PANI–NC composite exhibited a much greater specific capacitance (812 F g−1) than that of the PANI–NC composite (208 F g−1). The specific capacitance was calculated from the cyclic voltammogram using formula (1)
 | (1) |
The GCD measurements of the Ag–PANI–NC electrode and bare PANI–NC electrode, carried out at a 1 mA charging current, demonstrate that the discharging time increases upon Ag nanoparticle incorporation and, hence, the performance of the electrode is improved (Fig. S5B†). From the GCD curves, an average specific capacitance of 780 F g−1 was calculated for the Ag–PANI–NC composite, while for the bare sample of PANI–NC it was found to be only 184 F g−1. A maximum energy density of 15.64 W h kg−1 and a maximum power density of 244.8 W kg−1 were also estimated from the GCD curves. These results demonstrate that the prepared electrode material demonstrates the characteristics of a high energy–high power supercapacitor, without compromising much on the energy density. In addition, the GCD profile of the Ag–PANI–NC composite electrode unequivocally implies that the electrodes can store a considerable magnitude of energy and can deliver the stored energy very quickly. The specific capacitance of the electrodes was calculated using the following formula (2):
| Csp = IΔt/mΔv | (2) |
The energy density (E) and the power density of the electrode were calculated using formulae (3) and (4), respectively:22
 | (3) |
| P = (E/Δt) × 3600 | (4) |
Chronoamperometry (CA) measurements of the prepared electrodes were carried out at a constant voltage of 1 V for both charging and discharging processes that lasted for 150 s to evaluate the pseudocapacitive properties of the electrodes. In the CA graph (Fig. S5C†), Faradaic processes that occur at the electrode surface are monitored as a function of time. It can be noted from the CA profiles that the Ag–PANI–NC composite electrode is indeed pseudocapacitive in nature. In addition, it may also be noted that both the charging and discharging curves in the CA graph show considerable increases in the integrated area for the Ag–PANI–NC composite compared with those of the bare PANI–NC sample. This result indicates that the electrode made from the Ag–PANI–NC composite has superior ability to store charge, an attribute that is obviously the result of the incorporation of Ag nanoparticles into the PANI–NC matrix. Electrochemical impedance spectroscopy (EIS) of the electrodes made of the bare PANI–NC composite and the Ag–PANI–NC composite was carried out at a 10 mV s−1 scan rate and 1 mA charging and discharging currents to assess the ion transfer processes and electrical conductivity of the electrodes, and the results are shown as a Nyquist plot in Fig. S5D.† The electrochemical impedance response of a supercapacitor can generally be categorized, in the order of decreasing frequency, into three regions: (i) a high frequency region consisting of a semicircle, the diameter of which can be used to calculate the charge transfer resistance (RCT) that arises out of the electron diffusion processes; the intercept of the onset of the semicircle region on the real axis represents the equivalent series resistance (Rs), which is usually considered to be the sum of the electrode material resistance, the electrolyte’s bulk resistance and the contact resistance between the electrode and the electrolyte, (ii) a Warburg resistance region at mid frequencies with its origins in the diffusive nature of the redox species of the electrolyte, and (iii) a lower frequency region comprising of a nearly straight line, the inclination of which towards the imaginary axis decides the ideal capacitive behaviour of the electrode. The EIS spectrum of the electrode constructed from the bare PANI–NC composite shows the expected pseudocapacitive properties of the device with an ESR value of 18 Ω, which indicates very low magnitudes of contributions from the resistance of the material, electrolyte and the interface between the two. A low bulk electrolyte resistance indicates the high ionic conductivity of the prepared electrode, an attribute that we tentatively assign to possible ionic diffusion through the pores rendered by the composite.
The EIS spectrum of the Ag–PANI–NC electrode shows an ESR value of 7 Ω, however, the smaller semicircle in the high frequency region of this electrode compared to that of the PANI–NC electrode indicates a lower magnitude of RCT in the case of the Ag–PANI–NC electrode, indicating an enhanced rate of electron transfer processes and an increased available surface area of the Ag–PANI–NC electrode, which provides additional active sites for faradaic reactions.37 Furthermore, the steeper vertical line in the low frequency region that is more inclined towards the ordinate in the EIS spectrum of the Ag–PANI–NC electrode, when compared to that of the PANI–NC electrode, suggests that in the case of the Ag–PANI–NC electrode the electrolyte ions have better access to the electrode and hence render enhanced ionic diffusion in the electrode structure. The EIS data, therefore, unambiguously indicate that the incorporation of Ag nanoparticles into the PANI–NC matrix has the beneficial effect of enhancing the supercapacitive nature of the electrode. In order to ascertain the roles of the diffusive and capacitive contributions of the redox reactions at the electrode–electrolyte interface, we studied the cyclic voltammetry and GCD responses of the Ag–PANI–NC electrode at different scan rates of 1 mV s−1, 5 mV s−1, 10 mV s−1 15 mV s−1, 30 mV s−1 and 50 mV s−1 and different current densities (5 A g−1, 2 A g−1, 1.5 A g−1, 1 A g−1, 0.5 A g−1 and 0.1 A g−1), which are shown in Fig. 6A and B respectively. A diffusion-controlled process is characterized by a square root dependence of the scan rate on the current response; a capacitive process, on the other hand, demonstrates a linear relationship between the current and the scan rate. The measured current at a given fixed potential usually obeys the following relationship:,
| I(V) = k1v + k2v1/2 | (5) |
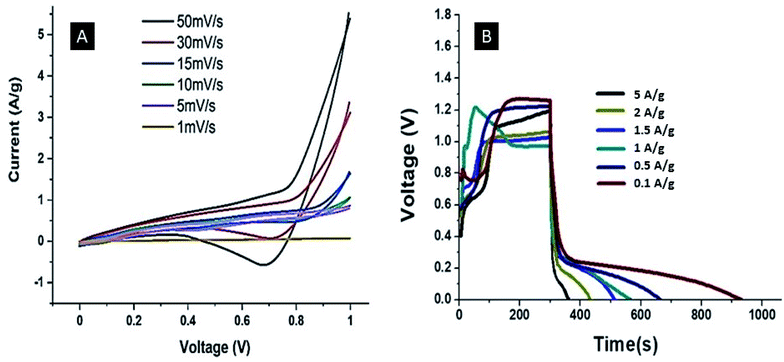 | ||
| Fig. 6 CV (A) and GCD (B) curves of the Ag–PANI–NC electrode at different scan rates and current densities, respectively. | ||
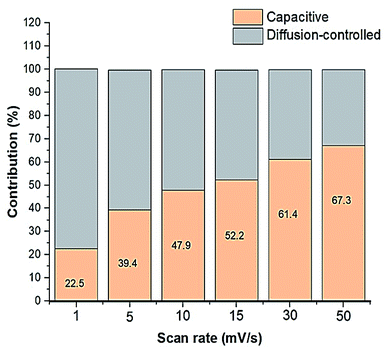 | ||
| Fig. 7 Graph showing the relative capacitive and diffusion-controlled contributions to the total capacitance. | ||
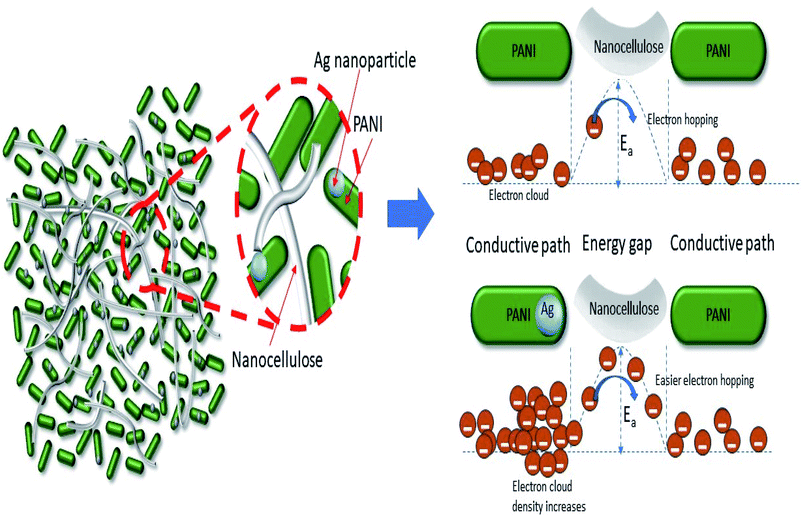
They also demonstrated that the potential energy barrier of hopping is 25 times smaller and the activation energy (Ea) required to cross this barrier is 3 times smaller for the composite than its undoped counterpart, resulting in the better conductivity of the former compared with the latter. For the Ag–PANI–NC composite reported here, our results indicate that the effective incorporation of Ag nanoparticles into the PANI matrix and favorable interactions among the components of the composite leads to a lowering of the activation energy required for crossing the barrier while the electrons hop among the localized defect states. The mechanism of electron hopping is depicted in Fig. 9. The cross sectional FESEM image of the composite shows the arrangement of components in the composite (Fig. S6†). Fig. S6A† shows the stacked arrangement of all of the components together. Fig. S6B† shows the magnified image in which the three components, Ag, PANI and NC, form a network which facilitates the easy electron transport throughout the composite, as described in Fig. 9. The specific power and specific energy of the electrode were calculated at increasing magnitudes of charging currents, viz., 0.1 mA, 0.5 mA, 1 mA, 1.5 mA, 2 mA and 5 mA, and, based on this data, a Ragone plot was drawn to estimate its operational range (Fig. 10A). A maximum specific energy of about 15 W h kg−1 was observed at a 1 mA current density, whereas a maximum specific power of 720 W kg−1 was obtained when the current density was increased to 5 mA. When the current density was increased from 1 mA to a marginal value of 1.5 mA, the specific capacitance increased beyond a magnitude of 1000 F g−1 (Fig. 10B). A further increase in the current density was observed to decrease the specific capacitance.
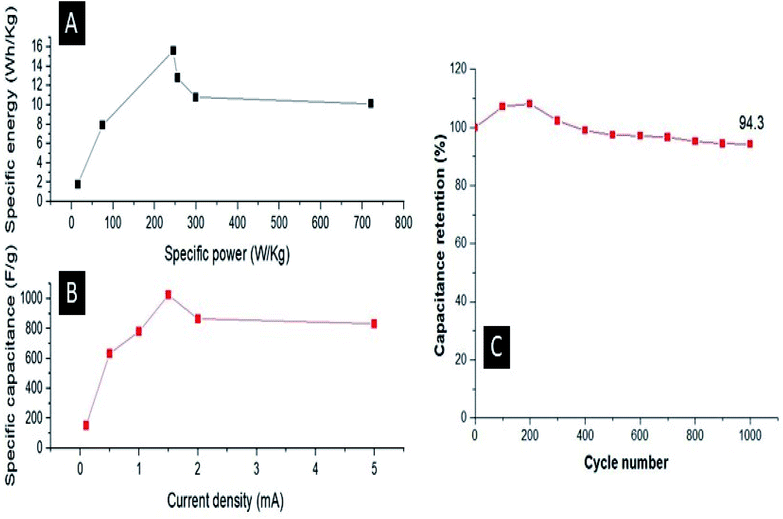 | ||
| Fig. 10 (A) Ragone plot of the specific power and specific energy; (B) relation between the specific capacitance and the charging current and (C) the cycling stability. | ||
The cycling stability of the prepared electrode was recorded for 1000 CV cycles and it was observed that the electrode maintained 94.3% of its initial capacitance after 1000 cycles (Fig. 10C). Furthermore, we evaluated the performance of the Ag–PANI–NC electrode with varying amounts of Ag nanoparticles, viz. 0%, 0.5%, 1%, 2% and 4%, in the bulk of the composite (Fig. S7†). It was observed that the electrode showed better performance upon increasing the amount of silver from 0% to 1%. An electrode with 2% Ag nanoparticles in it also showed a good performance in terms of a better voltage and minimum IR drop, however the discharging time was found to be less than that of the 1% silver sample. An electrode with 4% silver in it showed poor performance compared to all of the other samples, evidently due to the fact that the electrode corroded during the experiment.
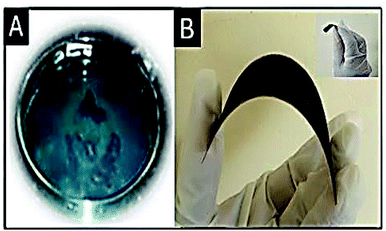
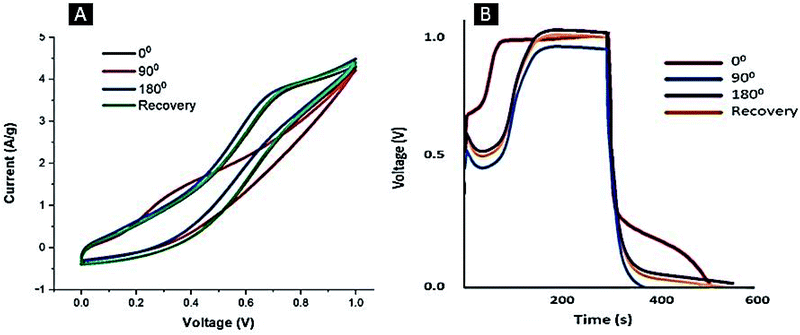
To recapitulate, firstly, we observe that both PANI and nanocellulose play significant roles in forming the Ag–PANI–NC composite with the required structural and morphological integrity that enable electrode surfaces that are easily accessible to the redox species at the interface of the electrode and the electrolyte. Secondly, as evidenced from the electrochemical studies, the Ag nanoparticles play a synergistic role along with PANI in the Ag–PANI–NC composite in boosting the capacitive properties of the electrode made of the composite. Thirdly, we see that the prepared Ag–PANI–NC electrode predominantly shows pseudocapacitive properties than EDLC characteristics, presumably due to the hybrid nature of the composite that forms the electrode, the electrochemical properties of which are seen to be largely controlled by the contributions of the Ag nanoparticles embedded in the composite. We attribute the better performance of the Ag–PANI–NC composite compared with that of the PANI–NC composite to a lowering of the activation energy of electron hopping among localized defect sites in the former due to the Ag nanoparticle incorporation. Lastly, we would also like to make a note of the self-healing nature of the prepared electrode upon recovery from extreme mechanical deformation, which we attribute to possible self-repairing interactions between the nanocellulose, PANI and the Ag nanoparticles.
Conclusion
In conclusion, the construction of a low-cost flexible supercapacitor electrode from a hybrid composite material, Ag–PANI–NC, made of nanocellulose derived from locally available areca nut husks, PANI and silver nanoparticles via a simple solution processing method, is demonstrated. The prepared composite was thoroughly characterized using various imaging and spectroscopic methods; all of them pointed towards the synergistic role of both PANI and nanocellulose in forming the final composite with a desired structure and morphology. Electrochemical studies of the electrode made of the composite showed excellent capacitance properties, such as a specific capacitance of 780 F g−1, an energy density of 15.64 W h kg−1 and a power density of 244.8 W kg−1. We demonstrate that these remarkable values are due to a combination of pseudocapacitance (56.3%) and EDLC (43.7%) of the electrode, where the capacitive contribution towards the net capacitance dominates over the diffusion-controlled contribution. The specific capacitance of the electrode was found to be retained when it recovered from mechanical bending to extreme degrees, which indicates the self-healing nature of the composite that formed the electrode. The incorporation of Ag nanoparticles has the crucial effect of lowering the activation energy of the correlated barrier hopping of electrons among the localized defect sites of the composite. In a nutshell, we would like to emphasize that both PANI and nanocellulose, and Ag nanoparticles endow the Ag–PANI–NC composite with the desired structural properties and electrical properties, respectively, and this synergy gives the electrode made of the composite excellent capacitive properties. However, we would also like to note that the system demonstrated here may deliver a more stable performance when operated under an optimum voltage range, e.g., in lower voltage regimes; research in optimizing the performance of the developed supercapacitive electrode in a lower voltage range is currently in progress in our laboratory.Conflicts of interest
There are no conflicts to declare.Acknowledgements
This work was supported by the Advanced Molecular Materials Research Centre, Mahatma Gandhi University, Kottayam-686 560, Kerala, India. We thank Mr Sajin Ravi Amrita at the Centre for Nanosciences, AIMS, Kochi for the technical assistance.References
- M. Asif and T. Muneer, Renewable Sustainable Energy Rev., 2007, 11, 1388–1413 CrossRef.
- S. Priya and D. J. Inman, Energy Harvesting Tech, Springer, 2009, vol. 21 Search PubMed.
- P. Tang, L. Han and L. Zhang, ACS Appl. Mater. Interfaces, 2014, 6, 10506–10515 CrossRef CAS PubMed.
- Y. Gao, Nanoscale Res. Lett., 2017, 12, 387 CrossRef PubMed.
- X. Peng, L. Peng, C. Wu and Y. Xie, Chem. Soc. Rev., 2014, 43, 3303–3323 RSC.
- A. Rafique, A. Massa, M. Fontana, S. Bianco, A. Chiodoni, C. F. Pirri, S. Hernández and A. Lamberti, ACS Appl. Mater. Interfaces, 2017, 9, 28386–28393 CrossRef CAS PubMed.
- Y. J Kang, H. Chung, C. H. Han and W. Kim, Nanotechnology, 2012, 23, 065401 CrossRef PubMed.
- J. Yu, J. Wu, H. Wang, A. Zhou, C. Huang, H. Bai and L. Li, ACS Appl. Mater. Interfaces, 2016, 8, 4724–4729 CrossRef CAS.
- Y. He, W. Chen, X. Li, Z. Zhang, J. Fu, C. Zhao and E. Xie, ACS Nano, 2013, 7, 174–182 CrossRef CAS PubMed.
- (a) X. Yang, K. Shi, I. Zhitomirsky and E. D. Cranston, Adv. Mater., 2015, 27, 6104–6109 CrossRef CAS PubMed; (b) H. Xie, H. Du, X. Yang and C. Si, Int. J. Polym. Sci., 2018, 2018, 1–25 Search PubMed.
- J. Wei, S. Geng, J. Hedlund and K. Oksman, Cellulose, 2020, 27, 2695–2707 CrossRef CAS.
- W. Chen, H. Yu, S. Y. Lee, T. Wei, J. Li and Z. Fan, Chem. Soc. Rev., 2018, 47, 2837–2872 RSC.
- T. Li, J. Song, X. Zhao, Z. Yang, G. Pastel, S. Xu, C. Jia, J. Dai, C. Chen, A. Gong and F. Jiang, Sci. Adv., 2018, 4, eaar3724 CrossRef PubMed.
- R. Guo, L. Zhang, Y. Lu, X. Zhang and D. Yang, J. Energy Chem., 2020, 51, 342–361 CrossRef.
- L. Y. Ee and S. F. Yau Li, Nanoscale Adv., 2021, 3, 1167–1208 RSC.
- D. Trache, A. F. Tarchoun, M. Derradji, T. S. Hamidon, N. Masruchin, N. Brosse and M. H. Hussin, Front. Chem., 2020, 8, 1–33 CrossRef PubMed.
- K. Dhali, M. Ghasemlou, F. Daver, P. Cass and B. Adhikari, Sci. Total Environ., 2021, 775, 145871 CrossRef CAS PubMed.
- Z. Wang, D. O. Carlsson, P. Tammela, K. Hua, P. Zhang, L. Nyholm and M. Stromme, ACS Nano, 2015, 9, 7563–7571 CrossRef CAS PubMed.
- L. Nyholm, G. Nystrom, A. Mihranyan and M. Stromme, Adv. Mater., 2011, 23, 3751–3769 CAS.
- Q. Meng, K. Cai, Y. Chen and L. Chen, Nano Energy, 2017, 36, 268–285 CrossRef CAS.
- Y. Z. Zhang, Y. Wang, T. Cheng, W. Y. Lai, H. Pang and W. Huang, Chem. Soc. Rev., 2015, 44, 5181–5199 RSC.
- W. Yin and E. Ruckenstein, Synth. Met., 2000, 108, 39–46 CrossRef CAS.
- D. S. Patil, J. Shaikh, S. Pawar, R. Devan, Y. Ma, A. Moholkar, J. Kim, R. Kalubarme, C. Park and P. Patil, Phys. Chem. Chem. Phys., 2012, 14, 11886–11895 RSC.
- (a) H. H. Hsu, A. Khosrozadeh, B. Li, G. Luo, M. Xing and W. Zhong, ACS Sustainable Chem. Eng., 2019, 7, 4766–4776 CrossRef CAS; (b) M. Usman, L. Pan, M. Asif and Z. Mahmood, J. Mater. Res., 2015, 30, 3192 CrossRef CAS; (c) J. Tian, D. Peng, X. Wu, W. Li, H. Deng and S. Liu, Carbohydr. Polym., 2017, 156, 19–25 CrossRef CAS PubMed.
- D. Mahanta, G. Madras, S. Radhakrishnan and S. Patil, J. Phys. Chem. B, 2008, 112, 10153–10157 CrossRef CAS PubMed.
- A. Boldizar, C. Klason, J. Kubat, P. Näslund and P. Saha, Int. J. Polym. Mater., 1987, 11, 229–262 CrossRef CAS.
- B. Parambath Kanoth, M. Claudino, M. Johansson, L. A. Berglund and Q. Zhou, ACS Appl. Mater. Interfaces, 2015, 7, 16303–16310 CrossRef CAS PubMed.
- P. Ahlgren and D. Goring, Can. J. Chem., 1971, 49, 1272–1275 CrossRef CAS.
- (a) C. Dhivya, S. A. Vandarkuzhali and N. Radha, Arabian J. Chem., 2019, 12, 3785–3798 CrossRef CAS; (b) S. Imran, S. Moiz, M. Ahmed J. H. Lee and H. T. Kim in 2009 IEEE 13th International Multitopic Conference, IEEE, 2009, pp. 1–4 Search PubMed.
- B. Duchemin, Cellulose, 2017, 24, 2727–2741 CrossRef CAS.
- Q. Wang, Y. Wang, Q. Meng, T. Wang, W. Guo, G. Wu and L. You, RSC Adv., 2017, 7, 2796–2803 RSC.
- L. Karthik, G. Kumar, A. V. Kirthi, A. Rahuman and K. B. Rao, Bioprocess Biosyst. Eng., 2014, 37, 261–267 CrossRef CAS PubMed.
- S. Patil, S. Pawar, M. Chougule, B. Raut, P. Godse, S. Sen and V. Patil, Int. J. Polym. Mater., 2012, 61, 809–820 CrossRef CAS.
- M. Tara-Lunga-Mihali, N. Plesu, L. Macarie, S. Iliescu and G. Ilia, Pure Appl. Chem., 2014, 86, 1853–1860 CAS.
- P. K. Podder, A. Gupta, S. S. B. Jamari, S. S. Rashid, S. Sharma, M. Subramaniam and J. Thraisingam, in The National Conference for Postgraduate Research, 2016, pp. 704–711 Search PubMed.
- K. R. Reddy, K. P. Lee, Y. Lee and A. I. Gopalan, Mater. Lett., 2008, 62, 1815–1818 CrossRef CAS.
- L. Tang, F. Duan and M. Chen, RSC Adv., 2016, 6, 65012–65019 RSC.
- S. M. Reda and S. M. Al-Ghannam, Adv. Mater. Phys. Chem., 2012, 2012, 75–81 CrossRef.
Footnote |
| † Electronic supplementary information (ESI) available. See DOI: 10.1039/d1ra04920h |
| This journal is © The Royal Society of Chemistry 2021 |

