 Open Access Article
Efficient and reusable ordered mesoporous WOx/SnO2 catalyst for oxidative desulfurization of dibenzothiophene†
Wenxiang Piao‡
a,
Zhenghua Li‡b,
Chengbin Lib,
Jin Seo Parkb,
Jung-ho Leeb,
Zhengyang Lib,
Ki Yeong Kimb,
Long Yi Jin *a,
Ji Man Kim
 *b and
Mingshi Jin
 *a
*a
aDepartment of Chemistry, Park Road 977, Yanji City, Jilin Province 133002, P. R. China. E-mail: lyjin@ybu.edu.cn; jimankim@skku.edu; msjin1231@ybu.edu.cn
bDepartment of Chemistry, Sungkyunkwan University, Suwon, 440-746, Republic of Korea
First published on 13th August 2021
Abstract
The oxidative desulfurization (ODS) of organic sulfur compounds over tungsten oxide supported on highly ordered mesoporous SnO2 (WOx/meso-SnO2) was investigated. A series of WOx/meso-SnO2 with WOx contents from 10 wt% to 30 wt%, were prepared by conventional wet impregnation. The physico-chemical properties of the WOx/meso-SnO2 catalysts were characterized by X-ray diffraction (XRD), N2 adsorption–desorption isotherms, electron microscopy, Fourier transform infrared spectroscopy (FT-IR), Raman spectroscopy, and the temperature-programmed reduction of hydrogen (H2-TPR). The characterization results indicated that these catalysts possessed mesoporous structures with uniform pores, high specific surface areas, and well-dispersed polyoxotungstate species on the surface of meso-SnO2 support. The ODS performances were evaluated in a biphasic system (model oil/acetonitrile, Sinitial = 2000 ppm), using H2O2 as an oxidant, and acetonitrile as an extractant. Dibenzothiophene (DBT) in the model oil was removed completely within 60 min at 50 °C using 20 wt% WOx/meso-SnO2 catalyst. Additionally, the effect of reaction temperature, H2O2/DBT molar ratio, amount of catalyst and different sulfur-containing substrates on the catalytic performances were also investigated in detail. More importantly, the 20 wt% WOx/meso-SnO2 catalyst exhibited 100% surfur-removal efficiency without any regeneration process, even after six times recycling.
1. Introduction
Sulfur-containing compounds in transportation fuels are converted to SOx, which is a major source of air pollution and energy corrosion.1 Thus, removal of sulfur has become an important research subject worldwide, and many countries have legislated environmental regulations that limit sulfur content in fuels to be below 10 ppm.2 To date, hydrodesulfurization (HDS) is a conventional desulfurization method in the petroleum refining industry for the removal of sulfur in fuels, including thiols, thioethers, and disulfides. However, the HDS process has some respective disadvantages. For example, HDS requires severe operation conditions at high pressure of (20–100) atm of H2 and temperatures (300–400 °C).3 Additionally, it is difficult to remove refractory sulfides, such as benzothiophene (BT), dibenzothiophene (DBT), and their derivatives, owing to their steric hindrance, and low electron density around sulfur atom.4 Therefore, alternative processes have been suggested to overcome these drawbacks. So far, several alternative deep desulfurization technologies, such as adsorption,5,6 extraction,7,8 bioprocess,9,10 oxidation,11–13 and photocatalytic oxidation desulfurization14,15 have been extensively investigated.Among these processes, oxidative desulfurization (ODS) combined with extraction process is considered to be one of the most promising processes. It can be operated at atmospheric pressure and low temperature without consuming hydrogen. During this process, organic sulfides can be oxidized into highly polar sulfones and sulfoxides by catalysts with suitable oxidants, and removed by the subsequent extraction process using polar organic solvents. Various oxidants have been used for the oxidation of sulfur compounds, including molecular oxygen,16–18 ozone,19 organic peroxide,20 and hydrogen peroxide (H2O2).21,22 Among them, H2O2 has been extensively used, due to its high activity, high oxidative capacity, and production of only water after the reaction.
In the field of heterogeneous catalysis, it is well-known that group 5 and 6 metals (e.g., Mo, W, V) in high oxidation states can react with hydrogen oxide to produce peroxometallate complexes, which are efficient catalysts for oxidative desulfurization reaction.8,23,24 Caero et al. examined the ODS of a real diesel fuel on V2O5 supported on alumina, silica, niobia, ceria, and titania, and reported that an approximately 99% decrease in the initial amount of sulfur.25 Prasad et al. reported that MoO3/Al2O3–SiO2 catalyst had the best catalytic performance for ODS of 4,6-dimethyldibenzothiphene (4,6-DMDBT) with tert-butyl hydroperoxide.26 A novel composite catalyst Vo-MoO2/NC exhibited excellent ODS activity and reusability, which was ascribed essentially to the strong electron-donating effect of NC on Vo-MoO2.27 Additionally, tungsten-based catalysts have also been extensively studied for ODS reaction in both single and biphasic liquid phase operating systems, due to the tungsten-oxo species on the surface of catalysts as active sites being combined with H2O2 to form peroxo-tungsten intermediates (W–O–O–H), contributing to the conversion of DBT to DBTO2 in the oxidation process.28 In order to improve the activity and stability of catalysts, tungsten species are dispersed on various supports such as W–MCM–41,29 WO3–SBA–15,30 WOx/TiO2,31 WOx–ZrO2,32 WO3/MoO3/Al2O3,33 and Mo/KIT-6-Ti.34
Recently, SnO2-based heterogeneous catalyst containing tungsten oxide has been reported, exhibiting efficient selective oxidation of amines and sulfides with green oxidant H2O2, has been reported.35 Zhang et al. have prepared WO3/SnO2 composite catalysts by the co-precipitation impregnation method for selective the oxidation of 1,2-benzenedimethanol to phthalide using H2O2 as oxidant, suggesting that high dispersion of tungsten species on SnO2 can improve catalytic activity in reaction.36 Ma et al. have found that the SnO2–WO3 composite as solid acid catalyst is more effective than pure WO3 and SnO2 catalysts in the hydrolysis of dichlorodifluoromethane, due to the strong interaction between WO3 and SnO2.37 According to the above reports, SnO2 will be a good choice as support to disperse WO3 for ODS reaction.
In the present work, highly ordered mesoporous SnO2 (meso-SnO2) was successfully prepared from KIT-6 silica template using a nano-replication method. WOx species were then highly dispersed on the meso-SnO2 support by an incipient wet-impregnation method. The Deep desulfurization performance of WOx/meso-SnO2 catalysts for fuel oil in a biphasic (model oil/acetonitrile) system under different reaction conditions was investigated in detail. The WOx/meso-SnO2 catalyst with 20 wt% WOx loading showed excellent catalytic performance in removing DBT, BT, and 4,6-DMDBT, because when WOx species interacted with SnO2, a lot of active species (tungsten oxo-species, W![[double bond, length as m-dash]](https://www.rsc.org/images/entities/char_e001.gif) O) were generated. Furthermore, the catalysts with high surface area, large pore size, and 3D pore network are beneficial for the diffusion and transport of reactants and products during ODS reaction. In addition, the reusability and stability of the catalyst were investigated.
O) were generated. Furthermore, the catalysts with high surface area, large pore size, and 3D pore network are beneficial for the diffusion and transport of reactants and products during ODS reaction. In addition, the reusability and stability of the catalyst were investigated.
2. Experimental
2.1 Synthesis of KIT-6 silica template
The typical synthesis of the mesoporous KIT-6 silica template was similar to the process described in the literature.38,39 A triblock copolymer (pluronic P123, EO20PO70EO20, Aldrich) was dissolved in distilled water and n-butanol solvent was added to the mixture at room temperature. The solution was vigorously stirred for 6 h to obtain a clear polymer solution. The clear solution was then kept in a water bath at 35 °C for 24 h followed by the addition of hydrochloric acid (HCl, Samchun) and tetraethylorthosilicate (TEOS, Samchun) with magnetic stirring. The molar composition of the mixture was P123![[thin space (1/6-em)]](https://www.rsc.org/images/entities/char_2009.gif) :
:![[thin space (1/6-em)]](https://www.rsc.org/images/entities/char_2009.gif) BuOH
BuOH![[thin space (1/6-em)]](https://www.rsc.org/images/entities/char_2009.gif) :
:![[thin space (1/6-em)]](https://www.rsc.org/images/entities/char_2009.gif) TEOS
TEOS![[thin space (1/6-em)]](https://www.rsc.org/images/entities/char_2009.gif) :
:![[thin space (1/6-em)]](https://www.rsc.org/images/entities/char_2009.gif) HCl
HCl![[thin space (1/6-em)]](https://www.rsc.org/images/entities/char_2009.gif) :
:![[thin space (1/6-em)]](https://www.rsc.org/images/entities/char_2009.gif) H2O = (0.017
H2O = (0.017![[thin space (1/6-em)]](https://www.rsc.org/images/entities/char_2009.gif) :
:![[thin space (1/6-em)]](https://www.rsc.org/images/entities/char_2009.gif) 1.01
1.01![[thin space (1/6-em)]](https://www.rsc.org/images/entities/char_2009.gif) :
:![[thin space (1/6-em)]](https://www.rsc.org/images/entities/char_2009.gif) 1.33
1.33![[thin space (1/6-em)]](https://www.rsc.org/images/entities/char_2009.gif) :
:![[thin space (1/6-em)]](https://www.rsc.org/images/entities/char_2009.gif) 0.45
0.45![[thin space (1/6-em)]](https://www.rsc.org/images/entities/char_2009.gif) :
:![[thin space (1/6-em)]](https://www.rsc.org/images/entities/char_2009.gif) 198). After that, the mixture was kept in an oven at 100 °C for another 24 h. The white precipitates were filtered and washed with distilled water and ethanol to completely remove the block copolymer. Finally, the product was calcinated at 550 °C for 3 h in air.
198). After that, the mixture was kept in an oven at 100 °C for another 24 h. The white precipitates were filtered and washed with distilled water and ethanol to completely remove the block copolymer. Finally, the product was calcinated at 550 °C for 3 h in air.
2.2 Synthesis of ordered mesoporous SnO2
Ordered mesoporous SnO2 (meso-SnO2) material was prepared by a nano-replication method using mesoporous KIT-6 as silica template. The meso-SnO2 material was synthesized by a solvent-free infiltration method.40 Typically, 5.09 g SnCl2·2H2O (Aldrich) was melted at 100 °C to liquid states. It was then impregnated into 5.0 g of preheated silica template. The composite materials were shaken for 1 h, and put in an oven at 80 °C overnight, in order to let the precursor spontaneously infiltrate into mesopores of the silica template. The composite material was then calcined at 700 °C for 3 h under static air condition. After that, the silica template was removed from the composite by a wet-etching process using a 20 wt% hydrofluoric acid (HF) solution. The resulting solid product was washed with distilled water and acetone several times, and then dried at 80 °C overnight in an oven.2.3 Synthesis of WOx/meso-SnO2 catalysts
WOx-Supported catalysts were prepared by an incipient wetness impregnation method. To obtain 20 wt% WOx/meso-SnO2, an aqueous solution of (NH4)6H2W12O40·xH2O (0.266 g, Aldrich) was impregnated into 1.0 g of meso-SnO2. After drying at 80 °C overnight, the obtained product was heated at 400 °C for 3 h under static air condition. WOx/meso-SnO2 with (10 and 30) wt% loadings were also prepared through the same method.2.4 Characterization
The X-ray diffraction (XRD) patterns of these prepared catalysts were obtained from a Rigaku D/MAX-2200 ultima equipped with Cu Kα radiation (λ = 1.54 Å) at 30 kV and 40 mA. N2 adsorption–desorption isotherms were obtained using a Micromeritics Tristar system at liquid N2 temperature. Before measurements, samples were degassed at 323 K for 12 h. The Brunauer–Emmett–Teller (BET) and Barrett–Joyner–Halenda (BJH) methods were utilized to calculate the BET surface area and pore size distribution, respectively. Scanning electron microscopy (SEM) image was obtained using a Hitachi UHR S 5500 FE-SEM operated at an accelerating voltage of 15 kV. Transmission electron microscopy (TEM) images were collected using JEOL JEM 3010 at an accelerating voltage of 200 kV. Raman spectra were recorded under ambient conditions at room temperature (RT) using WITEC Alpha300. The excitation line of the laser was at 532 nm. Fourier transform infrared spectroscopy (FT-IR) spectra were measured using KBr wafer technique with Bruker IFS-66 spectrometer. H2-Temperature programmed reduction (H2-TPR) was performed in a fixed-bed reactor. Sample (20 mg) was put in a quartz microreactor, and pretreated with He up to 100 °C at a rate of 10 °C min−1 for 1 h for pretreatment. Then 10 vol% H2 in a He flow of 40 mL min−1 was maintained at RT for 30 min. Finally, the sample was ramped to 900 °C at 10 °C min−1.2.5 Catalytic performance
Sulfur-containing compound (DBT, BT, or 4,6-DMDBT) was dissolved in n-heptane using a corresponding S-content of 2000 ppm as model oil. A typical ODS reaction of model oil was carried out in a 100 mL two-necked flask by adding 0.1 g catalyst, 0.27 mL of 34.5% H2O2 aqueous solution, 14 mL of acetonitrile, and 14 mL of the model oil successively into the flask, followed by vigorously mixing with a magnetic stirrer at 50 °C for 2 h under atmospheric pressure. Reaction products (upper oil layer) were analyzed by gas chromatography–flame ionization detector (GC–FID) equipped with a HP-5 capillary column (30 m × 0.32 mm inner diameter × 1.0 μm film thickness).3. Results and discussion
3.1 Catalyst characterization
Fig. 1 shows the low-and high angle XRD patterns for the KIT-6 template (inset), meso-SnO2, and WOx/meso-SnO2 materials. In the low-angle XRD patterns (Fig. 1A), KIT-6 exhibited typical diffraction peaks (211), (220), and (332), which are characteristic of the cubic Ia3d mesostructure. The meso-SnO2 and WOx/meso-SnO2 materials exhibited two narrow and well-defined peaks (110) and (211), indicating the highly ordered mesostructure of all materials. The presence of new diffraction peak (110) around 0.60° indicated that after the silica template etching process the cubic Ia3d mesostructure of KIT-6 silica template transformed into tetragonal I41/a (or lower symmetry).41 In the wide-angle XRD patterns (Fig. 1B), diffraction peaks of meso-SnO2 with 2θ/degree values corresponding to (110), (101), (200), (211), (220), (002), (310), (301), (202), and (321) planes exhibited a typical tetragonal phase of SnO2 (JCPDS 21-1250, P42/mnm). After loading (10 and 20) wt% WOx on meso-SnO2, there was no diffraction line of the tungsten oxide species in wide angle patterns, revealing that the WOx existed mainly in amorphous phases or particles size was very small, and they were finely dispersed on the meso-SnO2 support. The Diffraction peaks of crystalline WO3 appeared when 30 wt% WOx was loaded on meso-SnO2, as shown in Fig. 1B. Table 1 summarizes the crystallite sizes of all materials that were calculated using the Debye–Scherrer equation.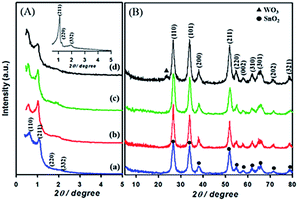 | ||
| Fig. 1 (A) Low- and (B) high-angle patterns of samples. (a) Meso-SnO2, (b) 10 wt% WOx/meso-SnO2, (c) 20 wt% WOx/meso-SnO2, (d) 30 wt% WOx/meso-SnO2, and KIT-6 (inset A). | ||
| Materials | SBETa (m2 g−1) | Vtotb (cm3 g−1) | Dpc (nm) | Dd (nm) | W/Sne |
|---|---|---|---|---|---|
| a Surface areas were calculated by the BET method from N2 adsorption isotherms in the range of p/p0 = 0.05–0.20.b Total pore volumes were calculated from the N2 adsorption data at p/p0 = 0.99.c Pore sizes were obtained from the adsorption branches of N2 sorption isotherms by the BJH method.d Crystallite sizes were calculated using Scherrer's equation from the high-angle XRD patterns.e Surface Sn/W calculated from the SEM-EDX results.f R represents the meso-SnO2 was re-calcinated at 400 °C for 3 h such as WOx/meso-SnO2 catalyst. | |||||
| Meso-SnO2 | 132 | 0.41 | 2.8/20.3 | 6.9 | — |
| 10 wt% WOx/meso-SnO2 | 90 | 0.18 | 2.8/17.0 | 8.3 | 9.10 |
| 20 wt% WOx/meso-SnO2 | 78 | 0.11 | 2.9/16.4 | 7.2 | 19.60 |
| 30 wt% WOx/meso-SnO2 | 57 | 0.07 | 2.8/16.5 | 7.6 | 27.86 |
| (R) meso-SnO2f | 73 | 0.31 | 3.3/18.0 | 9.2 | — |
Mesostructures of KIT-6, meso-SnO2, and WOx/meso-SnO2 materials were confirmed by N2 adsorption–desorption measurements (Fig. S1†). As shown in Fig. S1(a) and (c),† all the materials exhibited typical type-IV isotherms with H1 hysteresis loop in the range of p/p0 = 0.5–1.0, as characteristics of mesoporous materials. The corresponding pore size distribution curve calculated from the adsorption of N2-sorption isotherm showed that KIT-6 only had one porous structure (Fig. S1(b)†), whereas the meso-SnO2 and WOx/meso-SnO2 materials exhibited dual porous structures (Fig. S1(d)†). The smaller pore sizes of (2.5–3.3) nm come from the silica wall of the KIT-6 template, while the larger pore sizes (above 10 nm) are caused by the phase-transformation from the cubic Ia3d mesostructure to the tetragonal I41/a (or lower) mesostructure. The surface area, total pore volume, and pore size for KIT-6 were 725 m2 g−1, 0.83 cm3 g−1, and 7.0 nm, respectively. Table 1 summarizes the physical properties of meso-SnO2 and WOx/meso-SnO2 materials and shows that after loading different amounts of WOx on meso-SnO2 support, the surface areas, pore volumes, and pore sizes of samples were decreased, probably due to the partial pore blockage by the impregnated WOx. Compared to the recalcinated meso-SnO2, pure meso-SnO2 combined with WOx could suppress the particle agglomeration during the sintering process, due to the cooperative nature of the cations of the mixed oxides.42
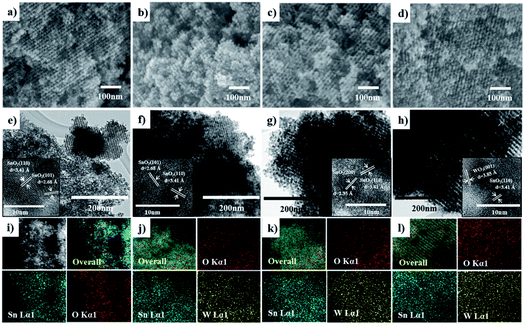
The SEM (Fig. 2a–d) and TEM images (Fig. 2e–h) also confirm the meso-SnO2 and WOx/meso-SnO2 materials with regular porosity and well-defined crystalline frameworks. All the materials consisted of well-defined nanopores and frameworks with uniformly repeating units over the whole particle, indicating that the highly ordered mesostructure remained before and after loading works. The W/Sn ratios of the WOx/meso-SnO2 materials with different amounts of WOx loading were obtained by Energy dispersed X-ray spectroscopy (EDX) from SEM analysis (Table 1), indicating that the tungsten content increased with increasing the amount of WOx loading. High-resolution TEM images (inset of TEM images) indicated that the meso-SnO2 and (10 and 20) wt% WOx/meso-SnO2 materials exhibited well-formed crystalline framework structures. The d-spacings of 3.41, 2.68 and 2.35 Å correspond to the (110), (101) and (200) planes of the tetragonal phase of SnO2, indicating that the WOx was finely dispersed on the surface of meso-SnO2, without aggregation. Fig. 2h shows that the catalyst with 30 wt% WOx loading mainly displayed the crystal SnO2 structure with tiny WO3 structure with d-spacing of 3.85 Å, which was indexed to the (001) plane of the orthorhombic WO3 phase.43 EDX mapping images obtained from TEM analysis revealed that the tungsten atoms in WOx/meso-SnO2 materials were homogeneously dispersed over the whole particles as shown in Fig. 2j–l.
Fig. 3 shows the Raman spectra of meso-SnO2 and WOx/meso-SnO2 materials in the spectral range of 200 to 1200 cm−1. The spectrum of meso-SnO2 showed the bands at around 476 cm−1 (Eg), 633 cm−1 (A1g), and 774 cm−1 (B2g) that could be assigned to the tetragonal structure of SnO2.44 After loading tungsten species, the prominent A1g band was shifted to higher wave numbers than that of pure meso-SnO2, indicating the presence of interaction between WOx species and SnO2.45 Simultaneously, the broad band appeared in the 200–400 cm−1 region was attributed to the W–O–W bending modes.46 The new band at around 960–980 cm−1 appeared in all the WOx/meso-SnO2 materials was attributed to the terminal W![[double bond, length as m-dash]](https://www.rsc.org/images/entities/char_e001.gif) O bonds of surface WOx species. The shift of surface W
O bonds of surface WOx species. The shift of surface W![[double bond, length as m-dash]](https://www.rsc.org/images/entities/char_e001.gif) O band from 960 cm−1 to 980 cm−1 with increasing the WOx loading might be related to the polymerization of surface monooxo tungsten species.47 With further increase in WOx loading (30 wt%), three new bands at about 272 cm−1, 715 cm−1 and 807 cm−1 were observed. This can be assigned to asymmetric and symmetric stretching vibration of W–O–W modes and W
O band from 960 cm−1 to 980 cm−1 with increasing the WOx loading might be related to the polymerization of surface monooxo tungsten species.47 With further increase in WOx loading (30 wt%), three new bands at about 272 cm−1, 715 cm−1 and 807 cm−1 were observed. This can be assigned to asymmetric and symmetric stretching vibration of W–O–W modes and W![[double bond, length as m-dash]](https://www.rsc.org/images/entities/char_e001.gif) O stretching modes. It is noteworthy that the formation of crystalline WO3 phase as observed in XRD and TEM measurements.48
O stretching modes. It is noteworthy that the formation of crystalline WO3 phase as observed in XRD and TEM measurements.48
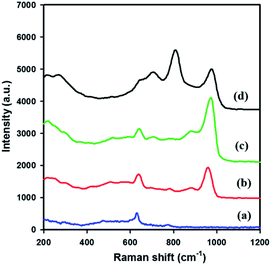 | ||
| Fig. 3 Raman spectra of (a) meso-SnO2, (b) 10 wt% WOx/meso-SnO2, (c) 20 wt% WOx/meso-SnO2, and (d) 30 wt% WOx/meso-SnO2. | ||
The FT-IR spectra of meso-SnO2 and the WOx/meso-SnO2 materials with different WOx contents are presented in Fig. S2.† As reported in the literature,49 the peaks at 651 cm−1 and 553 cm−1 could be assigned to different vibration modes of O–Sn–O and Sn–O–Sn groups. For WOx/meso-SnO2 materials, a peak appeared at 970 cm−1 was assigned to the stretching modes of W–O bond or W![[double bond, length as m-dash]](https://www.rsc.org/images/entities/char_e001.gif) O bond. Another new peak at 868 cm−1 demonstrated the typical Sn–O–W modes,50 indicating the presence of strong interactions between highly dispersed WOx and meso-SnO2. Additionally, the peak at 1621 cm−1 was attributed to the bending vibrations of hydrogen-bonded surface OH groups of physically adsorbed water molecules.51
O bond. Another new peak at 868 cm−1 demonstrated the typical Sn–O–W modes,50 indicating the presence of strong interactions between highly dispersed WOx and meso-SnO2. Additionally, the peak at 1621 cm−1 was attributed to the bending vibrations of hydrogen-bonded surface OH groups of physically adsorbed water molecules.51
H2-TPR was examined to investigate the reducibility of meso-SnO2 and WOx/meso-SnO2 catalysts. As shown in Fig. 4, the TPR profile of bulk WO3 exhibited two high intensity peaks of hydrogen consumed beginning at 600 °C, centered at 770 and 870 °C. It is important to note that these peaks might be assigned to the stepwise reduction of WO3 to W [WO3 → W20O58 → WO2 → W].52 The TPR profile of pure meso-SnO2 exhibited a mainly reduction peak at about 652 °C, which could be assigned to the reduction of Sn(4+) → Sn(2+) → Sn(0). After impregnated WOx, the first reduction peaks of all the WOx/meso-SnO2 catalysts shifted to lower temperature, indicating the presence of interaction between WOx species and meso-SnO2 support. Simultaneously, the relative area of this reduction peak increased with increasing WOx concentration due to the increasing fraction of WOx species in domains. The reduction temperature of the first peak at 450–550 °C was probably attributed to the reduction of octahedrally coordinated WOx species as reported by Wachs et al.53 Octahedrally coordinated WOx species were found to be reduced at temperatures varying from 300 to 600 °C through intermediate oxidation states. Accordingly, the reduction peaks at 450–700 °C were assigned to the WO3 to WO2.9 (or WO2) reduction process and the reduction of SnO2. The other two peaks located at higher temperature between 740 °C and 900 °C were probably attributed to a further reduction process of partially reduced WOx species (WO2.9 → WO2 → W) formed in the first reduction peak, together with the reduction of tetrahedrally coordinated WOx species that interacted with SnO2 support.54,55 In the case of 30 wt% WOx/meso-SnO2 catalyst, there were three reduction peaks centered at 743, 770, 867 °C, similar to those of bulk WO3, indication the formation of crystalline WO3 on the surface of meso-SnO2 support. In the case of 30 wt% WOx/meso-SnO2 catalyst, there were three reduction peaks centered at 743, 770 and 867 °C, similar to those of bulk WO3, indicating the formation of crystalline WO3 on the surface of meso-SnO2 support.
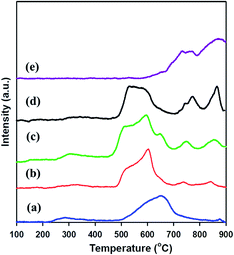 | ||
| Fig. 4 H2-TPR Profiles of (a) meso-SnO2, (b) 10 wt% WOx/meso-SnO2, (c) 20 wt% WOx/meso-SnO2, and (d) 30 wt% WOx/meso-SnO2. | ||
3.2 Catalytic study
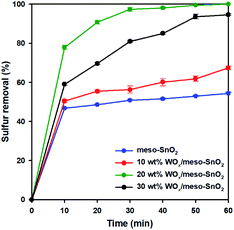
Fig. 5 shows the catalytic performance of pure meso-SnO2 and WOx/meso-SnO2 catalysts for the removal of DBT from model oil, which were carried out at 50 °C with H2O2 as oxidant for 2 h. WOx supported catalysts (WOx/meso-SnO2) exhibited better catalytic performance than pure SnO2 support because the surface tungsten–oxo species (W![[double bond, length as m-dash]](https://www.rsc.org/images/entities/char_e001.gif) O) as the active sites could interact with H2O2 to form surface peroxo-tungsten (W–O–O–H) species, and then DBT was oxidized to DBTO2 via oxidation process.56 Therefore, the amount of WOx loaded on meso-SnO2 immensely influenced the desulfurization efficiency. As shown in Fig. 5, the desulfurization efficiency of WOx-supported catalysts was remarkably increased with increasing WOx concentration and reached the 100% removal with 20 wt% WOx loading. The reason is because the active sites of tungsten–oxo species of 20 wt% WOx/meso-SnO2 catalyst are more than those of other catalysts. Further increase the WOx loading up to 30 wt% resulted in the decrease catalytic removal of DBT (94.5%). This phenomenon may be ascribed to the excess of 20 wt% WOx caused aggregation of tungsten oxide on the surface of meso-SnO2 and the formation of crystalline WO3 lead to a smaller surface area as shown in BET results (Table 1).
O) as the active sites could interact with H2O2 to form surface peroxo-tungsten (W–O–O–H) species, and then DBT was oxidized to DBTO2 via oxidation process.56 Therefore, the amount of WOx loaded on meso-SnO2 immensely influenced the desulfurization efficiency. As shown in Fig. 5, the desulfurization efficiency of WOx-supported catalysts was remarkably increased with increasing WOx concentration and reached the 100% removal with 20 wt% WOx loading. The reason is because the active sites of tungsten–oxo species of 20 wt% WOx/meso-SnO2 catalyst are more than those of other catalysts. Further increase the WOx loading up to 30 wt% resulted in the decrease catalytic removal of DBT (94.5%). This phenomenon may be ascribed to the excess of 20 wt% WOx caused aggregation of tungsten oxide on the surface of meso-SnO2 and the formation of crystalline WO3 lead to a smaller surface area as shown in BET results (Table 1).
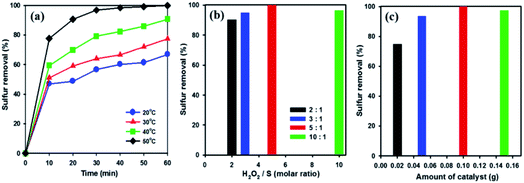
In order to examine the influence of reaction temperatures on the removal of DBT, a series of experiments were performed at different temperatures using 20 wt% WOx/meso-SnO2 catalyst. As shown in Fig. 6(a), raising the reaction temperature from 20 °C to 50 °C resulted in a remarkable increase in DBT removal efficiency and complete removal at 50 °C after 60 min. This indicates that the higher temperature is beneficial for H2O2 oxidation because the higher oxidation reaction rate at low temperatures might be limited by kinetics.57 According to the above analysis, 50 °C was chosen as the optimal reaction temperature in this work.
H2O2 is one of the main factors in oxidative system. Hence, oxidative desulfurization of DBT was carried out under different molar ratios (from 2 to 10) of H2O2/S at 50 °C with 20 wt% WOx/meso-SnO2 as catalyst. As shown in Fig. 6(b), the DBT removal efficiency was increased with increasing the molar ratio of H2O2/S from 2 to 5 followed by a slight decreased at molar ratio of 10. This indicates that the excess oxidant is beneficial for increasing the reaction efficiency in heterogeneous catalysis.58 According to the stoichiometry of the ODS reaction, 2 mole of H2O2 are consumed for the conversion of 1 mole of sulfur-containing compounds to their corresponding sulfones (DBTO2).59 However, the molar ratio of 2 gives only 90.3% of the sulfur removal, whereas the DBT can be removed completely from the model oil at the H2O2/S molar ratio of 5. The optimum ratio of H2O2/S was found to be 5, indicating that the H2O2 not only reacting with DBT, but also taken its self-decomposition. Therefore, stoichiometric amount of H2O2 can not result in complete oxidation of DBT under the present reaction conditions.
The amount of catalyst also affects desulfurization efficiency on the removal of DBT. As shown in Fig. 6(c), the sulfur removal increased from 74.7% to 100% in 60 min, when the amount of catalyst increased from 0.02 to 0.1 g. Below 0.1 g catalyst amount, the active sites of the catalyst were not enough to catalysis oxidative oxidize DBT completely. Nevertheless, when the catalyst amount increased to 0.15 g, the removal efficiency for DBT decreased to 97.2%. Therefore, the excessive catalyst was unnecessary in the desulfurization reaction because the excess active sites of catalyst might be covered by the absorption and aggregation among the catalyst in a certain reaction volume, resulting the limitation of active sites actually contacted with sulfur-containing compound.60 Thus, 0.1 g catalyst was chosen as the optimal amount for ODS reaction.
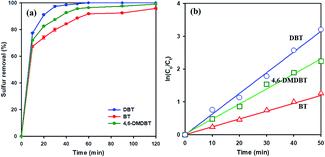
To study the effect of different sulfur-containing compounds in ODS reaction over 20 wt% WOx/meso-SnO2 catalyst. Beside DBT, benzothiophene (BT), and 4,6-dimethyl-dibenzothiophene (4,6-DMDBT), are also inflexible to be removed from fuels. The results in Fig. 7(a) indicated that the catalytic activity of these sulfur-containing compounds decreased in the order of DBT (100%) > 4,6-DMDBT (99.2%) > BT (94.4%) under the same experimental conditions. It may be ascribed to the different electron density of sulfur atoms on BT (5.739), DBT (5.758), and 4,6-DMDBT (5.760). In general, lower electron density on sulfur atom resulted in lower activity of the sulfur removal rate. Therefore, the lower electron density of sulfur atom on BT directly resulted in lowest surfur removal efficiency.61,62 Moreover, compared to DBT, 4,6-DMDBT with two methyl groups on the benzene caused steric hindrance effect, leading to the active species hard to approach the sulfur atom. Therefore, the desulfurization efficiency of 4,6-DMDBT was lower than that of DBT.
To understand ODS kinetics, the kinetics parameters of DBT oxidation at different temperatures (20 °C, 30 °C, 40 °C, and 50 °C) were studied. The rate constants for the apparent consumption of DBT were obtained from the pseudo-first-order equation:
| ln(C0/Ct) = kt | (1) |
Ea = RT2(dln![[thin space (1/6-em)]](https://www.rsc.org/images/entities/char_2009.gif) k/dT) k/dT)
| (2) |
| t1/2 = 0.693/k | (3) |
| Sulfur compound | Rate constant k (min−1) | Half-live t1/2 (min) | Correlation coefficient R |
|---|---|---|---|
| DBT | 0.0631 | 10 | 0.9929 |
| 4,6-DMDBT | 0.0458 | 15 | 0.9903 |
| BT | 0.0260 | 26 | 0.9951 |
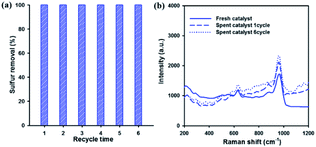
Reusability and stability of the catalyst are very important factors in industrial applications. Therefore, the reusability of the catalyst for DBT removal was investigated over 20 wt% WOx/meso-SnO2 catalyst. After each run, the used catalyst without any treatment (i.e., solvent washing, recalcination) was separated from the reaction mixture by centrifugation. Then, fresh H2O2 and model oil were directly added into the original reaction round-bottom flask for the next run. Fig. 8(a) showed that the sulfur removal efficiency remained at 100% after recycling for 6 times. That is because the active tungsten species are present on the surface of meso-SnO2 after recycling ODS reactions, as shown in the Fig. 8(b) Raman spectra. The results indicated that the 20 wt% WOx/meso-SnO2 has an excellent recycling performance in the deep oxidation desulfurization.
4. Conclusions
Highly ordered mesoporous WOx/meso-SnO2 catalysts with high surface area and well-defined mesoporosity were successfully prepared by the nano-replication method and applied to oxidative desulfurization reaction for the first time. In this ODS system, through the optimization of reaction conditions, sulfur removal of DBT could reach 100% under 50 °C with 20 wt% WOx/meso-SnO2 as catalyst. Furthermore, 20 wt% WOx/meso-SnO2 catalysts also exhibited excellent recycling performance after recycling six times without losing catalytic activity, when the catalyst was used without any regeneration process during the recycle tests. This high catalytic activity and reusability may be ascribed to the well dispersed WOx species and a strong interaction (synergistic effect) between WOx and meso-SnO2. This system with a simple WOx/meso-SnO2 catalyst has a remarkable advantage over the desulfurization by more solvent extraction and provides a promising approach for the sulfur removal in the chemical industry.Conflicts of interest
There are no conflicts to declare.Acknowledgements
This work was supported by the Education Department of Jilin Province Project of China (no. JJKH20180894KJ) and the Higher Education Discipline Innovation Project (111 Project, D18012). J. M. Kim also thanks to the Materials/Components Technology Development Program supported by the Ministry of Trade, Industry & Energy of Korea (No. 20010790).Notes and references
- Y. Shen, T. Sun and J. Jia, RSC Adv., 2012, 2, 3123–3132 RSC.
- P. Y. Wang, L. C. Jiang, X. Q. Zou, H. Q. Tan, P. P. Zhang, J. L. Li, B. S. Liu and G. S. Zhu, ACS Appl. Mater. Interfaces, 2020, 12(3), 25910–25919 CrossRef CAS PubMed.
- L. Hao, G. Xiong, L. Liu, H. Long, F. Jin and X. Wang, Chin. J. Catal., 2016, 37, 412–419 CrossRef.
- R. Abro, A. A. Abdeltawab, S. S. Al-Deyab, G. Yu, A. B. Qazi, S. Gao and X. Chen, RSC Adv., 2014, 4, 35302–35317 RSC.
- G. S. He, L. B. Sun, X. L. Song, X. Q. Liu, Y. Yin and Y. C. Wang, Energy Fuels, 2011, 25, 3506–3513 CrossRef CAS.
- W. H. Tian, L. B. Sun, X. L. Song, X. Q. Liu, Y. Yin and G. S. He, Langmuir, 2010, 26, 17398–17404 CrossRef CAS PubMed.
- J. Ge, Y. Zhou, Y. Yang and M. Xue, Ind. Eng. Chem. Res., 2011, 50, 13686–13692 CrossRef CAS.
- D. Xu, W. Zhu, H. Li, J. Zhang, F. Zou, H. Shi and Y. Yan, Energy Fuels, 2009, 23, 5929–5933 CrossRef CAS.
- W. Li, H. Tang, Q. Liu, J. Xing, Q. Li, D. Wang, M. Yang, X. Li and H. Liu, Biochem. Eng. J., 2009, 44, 297–301 CrossRef CAS.
- S. Maghsoudi, M. Vossoughi, A. Kheirolomoom, E. Tanaka and S. Katoh, Biochem. Eng. J., 2001, 8, 151–156 CrossRef CAS.
- Z. Hasan, J. Jeon and S. H. Jhung, J. Hazard. Mater., 2012, 205, 216–221 CrossRef PubMed.
- G. Gao, S. Cheng, Y. An, X. Si, X. Fu, Y. Liu, H. Zhang, P. Wu and M. Y. He, ChemCatChem, 2010, 2, 459–466 CrossRef CAS.
- H. Li, X. Jing, Y. Shi and L. Yu, React. Chem. Eng., 2021, 6, 119–124 RSC.
- D. Zhao, R. Liu, J. Wang and B. Liu, Energy Fuels, 2008, 22, 1100–1103 CrossRef CAS.
- X. Deng, R. Qian, H. Zhou and L. Yu, Chin. Chem. Lett., 2021, 32(3), 1029–1032 CrossRef CAS.
- Y. Chi, C. Li, Q. Jiao, Q. Liu, P. Yan, X. Liu and W.-B. Urs, Green Chem., 2011, 13, 1224–1229 RSC.
- W. Zhang, H. Zhang, J. Xiao, Z. Zhao, M. Yu and Z. Li, Green Chem., 2014, 16, 211–220 RSC.
- Y. Zheng, A. Wu, Y. Ke, H. Cao and L. Yu, Chin. Chem. Lett., 2019, 30(5), 937–941 CrossRef CAS.
- F. Lin, Z. Wang, J. Shao, D. Yuan, Y. He, Y. Zhu and K. Gen, Chin. J. Catal., 2017, 28, 1270–1280 CrossRef.
- D. Wang, E. W. Qian, H. Amano, K. Okata, A. Ishihara and T. Kabe, Appl. Catal., A, 2003, 253, 91–99 CrossRef CAS.
- W. Zhu, P. Wu, Y. Chao, H. Li, F. Zou, S. Xun, F. Zhu and Z. Zhao, Ind. Eng. Chem. Res., 2013, 52, 17399–17406 CrossRef CAS.
- C. Chen, Y. Cao, X. Wu, Y. Cai, J. Liu, L. Xu, K. Ding and L. Yu, Chin. Chem. Lett., 2020, 31(5), 1078–1082 CrossRef CAS.
- M. Te, C. Fairbridge and Z. Ring, Appl. Catal., A, 2001, 219, 267–280 CrossRef CAS.
- C. Wang, Y. Qiu, H. Y. Wu, W. S. Yang, Q. Zhu, Z. G. Chen, S. H. Xun, W. S. Zhu and H. M. Li, Fuel, 2020, 270, 117498–117505 CrossRef CAS.
- Y. Du, L. N. Zhou, Z. H. Liu, Z. R. Guo, X. Z. Wang and J. H. Lei, Chem. Eng. J., 2020, 387, 124056–124065 CrossRef CAS.
- C.-C. Luis, G.-B. Hilda, F.-C. Adriana, G.-G. Hector D and C.-G. Rogelio, Catal. Today, 2008, 133–135, 244–254 Search PubMed.
- J. Zou, Y. Lin, S. Wu, Y. Zhong and C. Yang, Adv. Funct. Mater., 2021, 31, 2100442–2100453 CrossRef CAS.
- V. V. D. N. Prasad, K.-E. Jeong, H.-J. Chae, C.-U. Kim and S.-Y. Jeong, Catal. Commun., 2008, 9, 1966–1969 CrossRef CAS.
- L. F. Ramírez-Verduzco, J. A. De los Reyes and E. Torres-García, Ind. Eng. Chem. Res., 2008, 47, 5353–5361 CrossRef.
- M. Zhang, W. Zhu, H. Li, S. Xun, W. Ding, J. Liu, Z. Zhao and Q. Wang, Chem. Eng. J., 2014, 243, 386–393 CrossRef CAS.
- X. Li, S. Huang, Q. Xu and Y. Yang, Transition Met. Chem., 2009, 34, 943–947 CrossRef CAS.
- M. A. Cortes-Jácome, M. Morales, C. Angeles Chavez, L. F. Ramírez-Verduzco, E. López-Salinas and J. A. Toledo-Antonio, Chem. Mater., 2007, 19, 6605–6614 CrossRef.
- G. Rodriguez-Gattorno, A. Galano and E. Torres-García, Appl. Catal., B, 2009, 92, 1–8 CrossRef CAS.
- J. Zou, Y. Lin, S. Wu, M. Wu and C. Yang, Sep. Purif. Technol., 2021, 264, 118434–118445 CrossRef CAS.
- W. A. W. A. Bakar, R. Ali, A. A. A. Kadir and W. N. A. W. Mokhtar, Fuel Process. Technol., 2012, 101, 78–84 CrossRef CAS.
- K. Kamata, K. Yonehara, Y. Sumida, K. Hirata, S. Nojima and N. Mizuno, Angew. Chem., Int. Ed., 2011, 50, 12062–12066 CrossRef CAS PubMed.
- Z. Zhang, Q. Zhu, J. Ding, X. Liu and W. L. Dai, Appl. Catal., A, 2014, 482, 171–178 CrossRef CAS.
- Z. Ma, W. Hua, Y. Tang and Z. Gao, J. Mol. Catal. A: Chem., 2000, 159, 335–345 CrossRef CAS.
- M. Jin, J.-N. Park, J. Shon, Z. Li, M. Yoon, H. Na, Y.-K. Park and J. Kim, Res. Chem. Intermed., 2011, 37, 1181–1192 CrossRef CAS.
- T.-W. Kim, F. Kleitz, B. Paul and R. Ryoo, J. Am. Chem. Soc., 2005, 127, 7601–7610 CrossRef CAS PubMed.
- J. K. Shon, H. Kim, S. S. Kong, S. H. Hwang, T. H. Han, J. M. Kim, C. Pak, S. Doo and H. Chang, J. Mater. Chem., 2009, 19, 6727–6732 RSC.
- J. K. Shon, S. S. Kong, Y. S. Kim, J.-H. Lee, W. K. Park, S. C. Park and J. M. Kim, Microporous Mesoporous Mater., 2009, 120, 441–446 CrossRef CAS.
- F. S. H. Simanjuntak, V. T. Widyaya, C. S. Kim, B. S. Ahn, Y. J. Kim and H. Lee, Chem. Eng. Sci., 2013, 94, 265–270 CrossRef CAS.
- B. Mallesham, P. Sudarsanam, G. Raju and B. M. Reddy, Green Chem., 2013, 15, 478–489 RSC.
- J. H. Pan and W. I. Lee, Chem. Mater., 2006, 18, 847–853 CrossRef CAS.
- J. X. Zhou, M. S. Zhang, J. M. Hong and Z. Yin, Solid State Commun., 2006, 138, 242–246 CrossRef CAS.
- Z. Zhang, Q. Zhu, J. Ding, X. Liu and W.-L. Dai, Appl. Catal., A, 2014, 482, 171–178 CrossRef CAS.
- V. M. Benitez and N. S. Fígoli, Catal. Commun., 2002, 3, 487–492 CrossRef CAS.
- Z. Ma, D. Weng, X. Wu and Z. Si, J. Environ. Sci., 2012, 24, 1305–1316 CrossRef CAS.
- Z. Hasan, J. Jeon and S. H. Jhung, J. Hazard. Mater., 2012, 205–206, 216–221 CrossRef CAS PubMed.
- M. Martos, J. Morales and L. Sanchez, J. Mater. Chem., 2002, 12, 2979–2984 RSC.
- K. M. Parida, S. Mallick and G. C. Pradhan, J. Mol. Catal. A: Chem., 2009, 297, 93–100 CrossRef CAS.
- D. C. Vermaire and P. C. van Berge, J. Catal., 1989, 116, 309–317 CrossRef CAS.
- I. E. Wachs, C. C. Chersich and J. H. Iiardenbergh, Appl. Catal., 1985, 13, 335–346 CrossRef CAS.
- V. Benitez, C. Querini and N. Fıgoli, Appl. Catal., A, 2003, 252, 427–436 CrossRef CAS.
- J. Horsley, I. Wachs, J. Brown, G. Via and F. Hardcastle, J. Phys. Chem., 1987, 91, 4014–4020 CrossRef CAS.
- Z. Li, H. J. Jeong, K. Sivaranjani, B. J. Song, S. B. Park, D. Li, C. W. Lee, M. Jin and J. M. Kim, Nano, 2015, 10, 1550075 CrossRef CAS.
- J. Zhang, A. Wang, X. Li and X. Ma, J. Catal., 2011, 279, 269–275 CrossRef CAS.
- S. S. Wang and G. Y. Yang, Chem. Rev., 2015, 115, 4893–4962 CrossRef CAS PubMed.
- H. Li, L. He, J. Lu, W. Zhu, X. Jiang, Y. Wang and Y. Yan, Energy Fuels, 2009, 23, 1354–1357 CrossRef CAS.
- W. Ma, Y. Xu, K. Ma and H. Zhang, Appl. Catal., A, 2016, 526, 147–154 CrossRef CAS.
- H. Lü, J. Gao, Z. Jiang, F. Jing, Y. Yang, G. Wang and C. Li, J. Catal., 2006, 239, 369–375 CrossRef.
- Y. Shiraishi, K. Tachibana, T. Hirai and I. Komasawa, Ind. Eng. Chem. Res., 2002, 41, 4362–4375 CrossRef CAS.
Footnotes |
| † Electronic supplementary information (ESI) available. See DOI: 10.1039/d1ra04957g |
| ‡ These authors contributed equally. |
| This journal is © The Royal Society of Chemistry 2021 |

