 Open Access Article
Effect of porous structural properties on lithium-ion and sodium-ion storage: illustrated by the example of a micro-mesoporous graphene1−x(MoS2)x anode
Yige Sun†
 *ab,
Jie Tang
 *ab,
Kun Zhang
 a,
Xiaoliang Yua,
Jinshi Yuana,
Da-Ming Zhuc,
Kiyoshi Ozawaa and
Lu-Chang Qin
 d
d
aNational Institute for Materials Science, 1-2-1 Sengen, Tsukuba 305-0047, Japan. E-mail: tang.jie@nims.go.jp
bDoctoral Program in Materials Science and Engineering, University of Tsukuba, 1-1-1 Tennodai, Tsukuba 305-8577, Japan
cDepartment of Physics and Astronomy, University of Missouri-Kansas City, Kansas City, Missouri 64110, USA
dDepartment of Physics and Astronomy, University of North Carolina at Chapel Hill, Chapel Hill, NC 27599-3255, USA
First published on 20th October 2021
Abstract
In this work, we synthesized micro-mesoporous graphene1−x(MoS2)x with different compositional ratios via co-reduction of graphite oxide and exfoliated MoS2 platelets. We systematically studied the performance of the micro-mesoporous graphene1−x(MoS2)x as anodes in lithium-ion batteries and sodium-ion batteries. The results show that the specific surface areas of the composites decrease with introducing MoS2. The irreversible capacitance, which is related to the formation of solid electrolyte interphases, also decreases. Besides specific surface area, we found that micropores can benefit the lithiation and sodiation. We demonstrated that a specific charge capacity of 1319.02 mA h g−1 can be achieved at the 50th cycle for the graphene½(MoS2)½ anode in lithium-ion batteries. Possible relationships between such a high specific capacity and the micro-mesoporous structure of the graphene1−x(MoS2)x anode are discussed. This work may shed light on a general strategy for the structural design of electrode materials in lithium-ion batteries and sodium-ion batteries.
1. Introduction
Lithium-ion batteries (LIBs) with high energy density have enjoyed great success recently.1,2 Extensive work has been carried out toward continued improvements of the capacity, the life span, and the safety of LIBs in the past decade.3–5 One of the approaches used in the improvement of the capacity is to employ new electrode materials with porous structures.6–8There are both advantages and disadvantages of applying a porous structure in an electrode material. The advantages include: (i) reduced solid-state diffusion of Li-ions due to thin pore walls, (ii) good electrode–electrolyte contact due to the high surface area, (iii) fast Li-ion diffusion kinetics, and good rate capability due to hierarchical structures of pores. For example, the micropores in low-temperature carbons (LTCs) below 100 nm are believed to act as the “reservoirs” for lithium storage.9 Ordered multimodal porous carbons, with a specific surface area of 1120 m2 g−1, exhibit a reversible capacity of 903 mA h g−1 and high rate performance, due to facile penetration of the porous structure.10 However, a porous structure has several disadvantages, such as poor cycle stability due to the instability of such a structure,9,11 and high irreversible capacity due to excessive solid electrolyte interphase (SEI) formation.12 Porous structural properties, including specific surface area, pore size, pore distribution, and so forth, form an integrated system, which plays a crucial role in lithium-ion storage.
Different electrode materials require different porosity designs. For LiMnPO4/C, the reversible capacity is proportional to specific surface area and pore volume, due to more active sites contacted with electrolyte ions.13 However, the capacity of a lithium storage device is not proportional to pore size. Graphite with a low specific surface area was believed to be a suitable electroactive material.14 In ordered mesoporous carbons, mesoporous contribute more than microporous.15 While phosphorus@carbon benefits from the pores smaller than 1 nm, which play a crucial role in bond formation between phosphorus and carbon.16 There are also different studies on CNT-Carbon nanofibers17 and LiFePO4/C.18 One reason for such a significant difference is the different nature and geometry of various materials. This suggests the need for careful analysis of the influence of surface properties on electrochemistry of different electrode materials.
There have been very few such investigations on graphene/molybdenum disulfide (graphene1−x(MoS2)x) anode. Graphene1−x(MoS2)x is combined by two kinds of layered material. In which, MoS2 is a newly developed material.19 In a MoS2 crystal, each Mo atom and S atom are covalently bonded forming a two-dimensional (2D) layered structure. These 2D layers are stacked together through weak van der Waals attraction, providing a very large interlayer spacing of about 0.61 nm along the C-axis.20,21 This interlayer spacing is about twice that of graphite (0.335 nm). Therefore, MoS2 can easily accommodate lithium-ions and sodium-ions.22–24 MoS2 has a theoretical specific capacity of 670 mA h g−1 in lithium-ion batteries. However, the low conductivity, layer restacking, low cyclic stability, and low rate performance are the key issues that limit the application of MoS2 as materials for constructing LIB's anodes. To solve the problem, carbon material, such as graphene, was used as binders and “skeleton” in a MoS2. Such graphene could be produced by expanding graphite flakes at low cost and high throughput.25 This graphene1−x(MoS2)x anode can achieve a capacity of 877 mA h g−1 at a current density of 100 mA g−1.26 Although considerable research has been devoted to increasing the specific capacity, rather less attention has been paid to understand how porous structural properties affect electrochemistry performance of graphene1−x(MoS2)x.
To our best knowledge, no experimental study has been reported which details the effects of porosity structure in graphene1−x(MoS2)x on the electrochemical performance as anodes in LIBs and sodium-ion batteries (SIBs). In this work, by using reduced graphite oxide, we synthesized micro-mesoporous graphene1−x(MoS2)x composite with increased specific surface area and similar pore-size distribution. We analyzed the effect of specific surface area and pore size distribution of micro-mesoporous graphene1−x(MoS2)x anodes. The results suggest that instead of specific surface area, the pores with a radius smaller than 2 nm play an important role in the kinetics of both lithium-ion and sodium-ion storage. The results of this work may shed light on the application of graphene1−x(MoS2)x in lithium-ion and sodium-ion storage devices. The discussion of porous structural properties and their effect on lithium-ion/sodium-ion storage may benefit the structural design of other electrodes.
2. Experimental
2.1 Synthesis of micro-mesoporous graphene1−x(MoS2)x
To synthesize micro-mesoporous graphene1−x(MoS2)x, bulk MoS2 was dispersed in a solvent containing H2O2 (30 wt% aqueous solution) and N-methyl-2-pyrrolidinone (NMP) (1![[thin space (1/6-em)]](https://www.rsc.org/images/entities/char_2009.gif) :
:![[thin space (1/6-em)]](https://www.rsc.org/images/entities/char_2009.gif) 9 v/v), followed by subsequently sonication (with a nominal power of 500 W) at room temperature for 12 hours to produce exfoliated MoS2 platelet. Then, graphite oxide dispersion (0.5 mg mL−1) was synthesized through the modified Hummers' method as discussed in our previous work.27,28 To form the micro-mesoporous graphene1−x(MoS2)x, graphite oxide dispersion was mixed with as-prepared MoS2 platelet dispersion with different weight ratios (weight ratio of reduced graphite oxide to MoS2) of 1
9 v/v), followed by subsequently sonication (with a nominal power of 500 W) at room temperature for 12 hours to produce exfoliated MoS2 platelet. Then, graphite oxide dispersion (0.5 mg mL−1) was synthesized through the modified Hummers' method as discussed in our previous work.27,28 To form the micro-mesoporous graphene1−x(MoS2)x, graphite oxide dispersion was mixed with as-prepared MoS2 platelet dispersion with different weight ratios (weight ratio of reduced graphite oxide to MoS2) of 1![[thin space (1/6-em)]](https://www.rsc.org/images/entities/char_2009.gif) :
:![[thin space (1/6-em)]](https://www.rsc.org/images/entities/char_2009.gif) 0.2, 1
0.2, 1![[thin space (1/6-em)]](https://www.rsc.org/images/entities/char_2009.gif) :
:![[thin space (1/6-em)]](https://www.rsc.org/images/entities/char_2009.gif) 0.5, 1
0.5, 1![[thin space (1/6-em)]](https://www.rsc.org/images/entities/char_2009.gif) :
:![[thin space (1/6-em)]](https://www.rsc.org/images/entities/char_2009.gif) 1, 1
1, 1![[thin space (1/6-em)]](https://www.rsc.org/images/entities/char_2009.gif) :
:![[thin space (1/6-em)]](https://www.rsc.org/images/entities/char_2009.gif) 3, and 1
3, and 1![[thin space (1/6-em)]](https://www.rsc.org/images/entities/char_2009.gif) :
:![[thin space (1/6-em)]](https://www.rsc.org/images/entities/char_2009.gif) 5. Then, hydrazine monohydrate (3 μL for 3 mg graphite oxide) was added to the mixture, followed by reflux at 98 °C for 24 hours. The product graphene1−x(MoS2)x with different weight ratios were labeled as Graphene⅚(MoS2)⅙, Graphene⅔(MoS2)⅓, Graphene½(MoS2)½, Graphene¼(MoS2)¾, and Graphene⅙(MoS2)⅚ respectively. The samples, in form of black power, were filtered and washed by using distilled water 5 times until the pH reached 7.
5. Then, hydrazine monohydrate (3 μL for 3 mg graphite oxide) was added to the mixture, followed by reflux at 98 °C for 24 hours. The product graphene1−x(MoS2)x with different weight ratios were labeled as Graphene⅚(MoS2)⅙, Graphene⅔(MoS2)⅓, Graphene½(MoS2)½, Graphene¼(MoS2)¾, and Graphene⅙(MoS2)⅚ respectively. The samples, in form of black power, were filtered and washed by using distilled water 5 times until the pH reached 7.
2.2 Fabrication of graphene1−x(MoS2)x electrode
Graphene1−x(MoS2)x powders were dispersed in ethanol to form a suspension, and then filtered through a weighted porous filter membrane (47 mm hydrophilic PTFE membrane filter, 0.2 μm pore size, Merck Millipore). The membranes which contain graphene1−x(MoS2)x powders were dried in a vacuum for 24 hours to remove water and ethanol, followed by cutting into 15 mm diameter circular disks. The circular disks were dried in a vacuum at 110 °C for 12 hours, which were used as the electrodes in CR2032-type coin cells.2.3 Structural characterization
The surface morphologies of samples were examined using a scanning electron microscope (SEM) and high-resolution transmission electron microscopy (HRTEM). The microscopic structures were characterized through X-ray diffraction (XRD, Rigaku SmartLab using Cu Kα radiation with λ = 1.5418 Å). Elemental mapping (Energy dispersive X-ray spectroscopy-EDS) was performed by using a JEOL JSM-7100F instrument.2.4 Adsorption isotherm characterization
Nitrogen adsorption measurements were performed by using Autosorb-1 (Quantachrome Instruments) at −196 °C. Samples were outgassed at 150 °C for 24 hours before N2 adsorption. To calculate the specific surface area, the Brunauer–Emmett–Teller (BET) equation was used. Taking the porosity and surface energy of the solid into account, we used Density Functional Theory (DFT) model (from Quantachrome Autosorb ASiQwin 2.0) to analyze the pore size distributions.2.5 Electrochemical performance
The electrochemical properties of the graphene1−x(MoS2)x electrodes were characterized by assembling them in CR2032-type coin cells. The lithium foil acted as a reference and a counter electrode. A piece of polypropylene was used as the separator, and LiPF6 (1 mol L−1 in EC![[thin space (1/6-em)]](https://www.rsc.org/images/entities/char_2009.gif) :
:![[thin space (1/6-em)]](https://www.rsc.org/images/entities/char_2009.gif) DMC = 1
DMC = 1![[thin space (1/6-em)]](https://www.rsc.org/images/entities/char_2009.gif) :
:![[thin space (1/6-em)]](https://www.rsc.org/images/entities/char_2009.gif) 1 (v/v %)) was used as the electrolyte to assemble LIBs. To assemble SIBs, a piece of sodium foil and NaPF6 electrolyte (1 mol L−1 in EC
1 (v/v %)) was used as the electrolyte to assemble LIBs. To assemble SIBs, a piece of sodium foil and NaPF6 electrolyte (1 mol L−1 in EC![[thin space (1/6-em)]](https://www.rsc.org/images/entities/char_2009.gif) :
:![[thin space (1/6-em)]](https://www.rsc.org/images/entities/char_2009.gif) DMC = 1
DMC = 1![[thin space (1/6-em)]](https://www.rsc.org/images/entities/char_2009.gif) :
:![[thin space (1/6-em)]](https://www.rsc.org/images/entities/char_2009.gif) 1 (v/v %)) were used to replace lithium foil and LiPF6 electrolyte. The cells were galvanostatically charged and discharged under increasing current densities to evaluate the rate performance. Cyclic voltammetry measurements were carried out at a potential scan rate of 0.1 mV s−1.
1 (v/v %)) were used to replace lithium foil and LiPF6 electrolyte. The cells were galvanostatically charged and discharged under increasing current densities to evaluate the rate performance. Cyclic voltammetry measurements were carried out at a potential scan rate of 0.1 mV s−1.
2.6 Li+/Na+ diffusion coefficient calculation
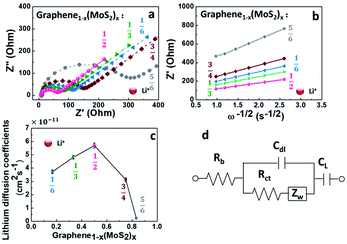
To analyze the influence of surface properties on the lithium-ion and sodium-ion storage kinetics, electrochemical impedance spectroscopy (EIS) measurements at a 50% state of charge (SOC) in an AC frequency (from 200 kHz to 0.01 Hz) was carried out using a Biologic VMP-3 model. The lithium-ion and sodium-ion diffusion coefficient D was calculated using eqn (1):13,29,30
 | (1) |
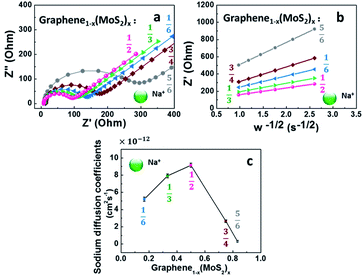
![[thin space (1/6-em)]](https://www.rsc.org/images/entities/char_2009.gif) 500 C mol−1), C is the concentration of lithium-ion or sodium-ion, σ is the Warburg factor (the slope of line Z′ ∼ ω−1/2 as shown in Fig. 6b and 8b).
500 C mol−1), C is the concentration of lithium-ion or sodium-ion, σ is the Warburg factor (the slope of line Z′ ∼ ω−1/2 as shown in Fig. 6b and 8b).
3. Results and discussion
3.1 Structure characterization and morphology
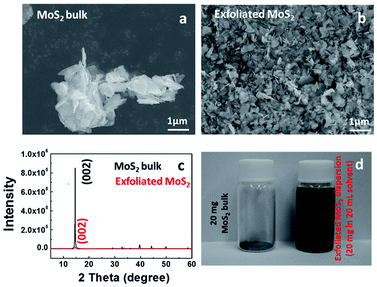
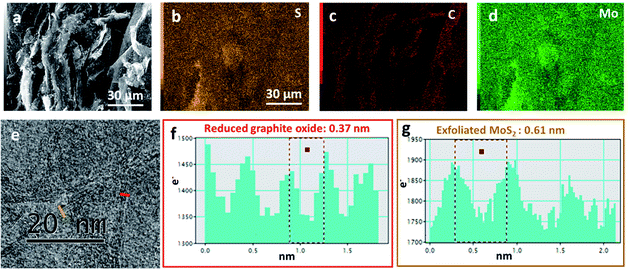
Fig. 1 illustrates SEM images and XRD patterns of bulk MoS2 and exfoliated MoS2. Compared with bulk particles in Fig. 1a, the exfoliated MoS2 sheets in Fig. 1b exhibited a wider lateral size distribution. After sonication, the MoS2 sheets were peeled off from the bulk particles, due to the weak van der Waals force.20 Before exfoliation, the XRD spectrum of the bulk MoS2 shown a (002) peak at 14.51° (Fig. 1c), indicating a d002 of 0.61 nm. After exfoliation, the absolute intensity of the (002) peak decreased dramatically, indicating the lower degrees of periodicity on the (002) face due to the exfoliation. Through the exfoliation process, we produced MoS2 sheets from large particles as shown in Fig. 1d.SEM images in Fig. 2 illustrate the morphology of the sample Graphene½(MoS2)½. The distributions of sulfur, carbon, and molybdenum were detected by EDS elemental mapping in Fig. 2b–d. It could be seen that the graphene and MoS2 sheet were mixed together in Graphene½(MoS2)½ composite in the high-resolution transmission electron microscopy image in Fig. 2e. Fig. 2f and g show the intensity profiles along the red line (reduced graphite oxide: graphene) and orange line (exfoliated MoS2) in Fig. 2e respectively. For graphene, the average distance between neighboring sheets was 0.37 nm, which was consistent with that in our previous report.27 For exfoliated MoS2 sheet, the interlayer spacing was 0.61 nm. This inter-layer spacing was in good agreement with the XRD pattern in Fig. 1c.
3.2 Effect of specific surface area on lithium storage
As shown in Fig. 3a, the exfoliate MoS2 exhibited a type II isotherm with a specific surface area of only 17 m2 g−1. The absence of hysteresis indicated adsorption on and desorption from a macro-porous or a non-porous surface.31 In contrast, Graphene½(MoS2)½ in Fig. 3b exhibited a type IV isotherm (specific surface area of 321 m2 g−1). The hysteresis indicated capillary condensation in mesopores. The closure at P/P0 around 0.45 indicated the presence of small mesopores, due to the tensile strength effect (TSE) as discussed by Groen et al.32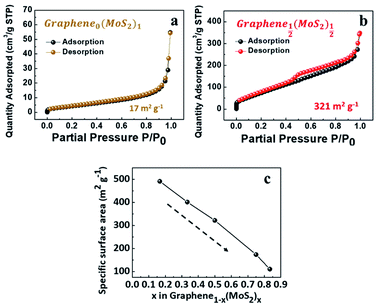 | ||
| Fig. 3 Nitrogen physisorption isotherms of (a) exfoliated MoS2, and (b) Graphene½(MoS2)½. (c) Specific surface area as a function of x in graphene1−x(MoS2)x (weight ratio). | ||
With the decrease of MoS2 amount, the specific surface area was increased from 111 m2 g−1 (Graphene⅙(MoS2)⅚) to 491 m2 g−1 for (Graphene⅚(MoS2)⅙) as shown in Fig. 3c. This was because excessive MoS2 flakes tend to restack together and decrease the surface area.20
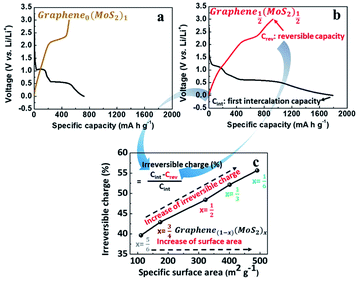
Fig. 4a and b are the first galvanostatic charge and discharge curves of exfoliated MoS2 (graphene0(MoS2)1) and Graphene½(MoS2)½. In the intercalation curve, there were two typical plateaus indicating the formation of LixMoS2 around 1.1 V (vs. Li/Li+) and that of Li2S around 0.6 V (vs. Li/Li+).33 Graphene½(MoS2)½ exhibited much higher specific capacity compared with that of graphene0(MoS2)1. The first intercalation capacity of Graphene½(MoS2)½ was 1792.47 mA h g−1 (vs. 721.52 mA h g−1 for graphene0(MoS2)1). The first reversible capacity was 924.64 m Ah g−1 (vs. 505.35 mA h g−1 for exfoliated MoS2). This increase was due to the micro-mesopore structure of graphene1−x(MoS2)x which could provide better delivery of ions and increased conductivity.6,8 As shown in Fig. 4c and Table 1, an increase of specific surface area lead to a dramatic increase of irreversible charge in the first cycle. The irreversible charge ratio was calculated by the eqn (2):12,14
 | (2) |
| Samples, Graphene1−x(MoS2)x | SBET | Irreversible charge in 1st cycle | Rct (Li+) | DLi+ | Rct (Na+) | DNa+ | Pore size (nm) |
|---|---|---|---|---|---|---|---|
| a SBET: specific BET surface area (m2 g−1), Rct: charge-transfer resistance (Ω), DLi+: lithium-ions diffusion coefficient (×10−11 cm2 s−1), DNa+: sodium-ions diffusion coefficient (×10−12 cm2 s−1). | |||||||
| Graphene⅚(MoS2)⅙ | 491 | 56% | 90.23 | 3.73 | 111.68 | 5.21 | 3.7 |
| Graphene⅔(MoS2)⅓ | 401 | 52% | 68.79 | 4.81 | 90.42 | 7.92 | 3.7 |
| Graphene½(MoS2)½ | 322 | 48% | 48.90 | 5.70 | 76.27 | 9.15 | 3.7 |
| Graphene¼(MoS2)¾ | 174 | 43% | 125.59 | 3.13 | 133.12 | 2.66 | 3.7 |
| Graphene⅙(MoS2)⅚ | 111 | 39% | 223.02 | 0.24 | 249.53 | 0.31 | 3.7 |
This irreversible charge is due to the formation of a solid electrolyte interphase (SEI). It is generally accepted that the formation of SEI consumes the lithium-ions during the intercalation on all the surface areas exposed to the electrolyte.8,12 Therefore, the irreversible charge greatly depends on the specific surface area of the electrode. As shown in Fig. 4c, the irreversible charge in the first cycle was plotted as a linear function of the specific surface areas. This result was consistent with a previous study on graphite anode.12 To note that to achieve the complete formation of the SEI layer and maximize the irreversible capacity in the experiment, we chose a small current density of 50 mA g−1 at room temperature for galvanostatic charge and discharge. Due to the effect of specific surface area on the irreversible charge, Graphene⅙(MoS2)⅚ seems to show a better performance in lithium storage. However, the diffusion study showed that tendency of lithium-ions diffusion kinetics was different, as the following discussion in Section 3.4.
3.3 Pore size distribution
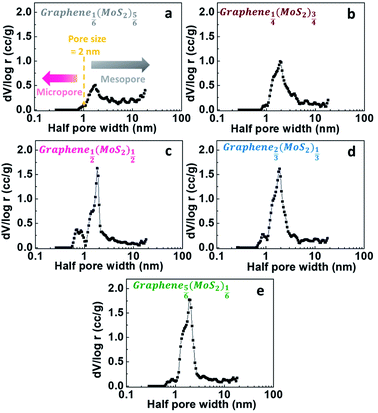
For a better characterizing of porous structural properties, differential-porosity measurements were performed. The pore size distributions are shown in Fig. 5. The pore-size distributions obtained with the porosity model indicated the micro-mesopore structure of graphene1−x(MoS2)x samples. The main pore size was 3.7 nm, which was like the pore size of graphene (reduced graphite oxide) as discussed in our previous report.27 The DFT porosity calculation results indicated that for Graphene⅙(MoS2)⅚ and Graphene¼(MoS2)¾ (Fig. 5a and b), most of the pores were bigger than 2 nm, since MoS2 flakes were dominant in these two samples. With the decrease of MoS2, there were more contact points between graphene and MoS2 flakes, resulting in a fuller combination, and then formed more micropores between the graphene and MoS2 nano-sheets in Graphene½(MoS2)½. Therefore, micropores (half pore width < 1 nm, pore size < 2 nm) were more pronounced in this combination (Fig. 5c). However, with the excess of graphene, the amount of micropores was deduced as shown in Fig. 5d and e. This was due to the excess graphene with mesopores (3.7 nm).3.4 Diffusion study in lithium-ions storage
To understand the kinetics of lithium ions transport in a graphene1−x(MoS2)x electrode, Fig. 6 compared the electrochemical impedance spectroscopy at 50% state of charge (SOC) of the 10th cycle. All the electrodes shown a characteristic linear relation between the real and imaginary parts of the impedance at low frequencies, and a semicircle in the high frequencies, as shown in Fig. 6a. The impedance in the low-frequency region corresponds to a Warburg process.1,13 The impedance at the high-frequency region is related to the lithium-ions migration process. This process corresponds to the charge-transfer resistance Rct and an electric double-layer capacitance on nonhomogeneous systems Cdl. Here, an equivalent circuit for this model (Fig. 6d) was used to explain the impedance behaviors.13,30,34,35 As shown in Table 1 and Fig. 6c, with the increase of exfoliated-MoS2 amount, the DLi+ increased and reached a peak when x = ½ in graphene(1−x)(MoS2)x, and then decrease rapidly. DLi+ for Graphene½(MoS2)½ was 5.70 × 10⁻¹¹ cm2 s−1, which was about twice that of Graphene¼(MoS2)¾, and about 24 times that of Graphene⅙(MoS2)⅚. The value was consistent with the literature.36 The electrode Graphene½(MoS2)½exhibited the highest lithium-diffusion coefficient, which might be the result of pronounced micropores (<2 nm) shown in Fig. 5c.Although larger pore size can improve the delivery of ions,8 pores smaller than 2 nm seem to contribute to the lithium-ion kinetics, as discussed by Li et al.16 and Wang et al.37 It is due to that the micropore can: (1) cause the desolventizing of the electrolyte ions,38 leading to a decrease of dissolution of polysulfide. This is because the concentration of solvent in these micropores is very low compared with that in mesopores. (2) Nearly reversible reaction for sulfur confined in sub-nanometre micropores. However, for the sulfur located in mesopores, the formation of insulation layer on the electrode surface lead to absolute loss of reversibility.39 (3) Near-perfect confinement level (96.9%) of micropores system compared with other systems with mesopores or micropores.39,40 This work systematically studied the effect of pore size on lithium-ion diffusion and added experimental evidence to the discussion.
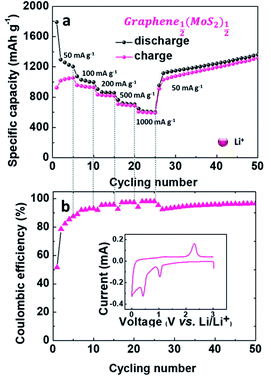
As shown in Fig. 7, Graphene½(MoS2)½ exhibited good rate capability. The electrode delivered specific charge capacities of 1054.42, 929.29, 819.67, 688.24 and 592.23 mA h g−1 at current densities of 50, 100, 200, 500 and 1000 mA g−1. With the decrease of current density, the specific capacity increased back to 1030.33 mA h g−1 and slowly increased to 1319.02 mA g−1 at the 50th cycle with coulombic efficiency of 97%.
3.5 Diffusion study in sodium-ion storage
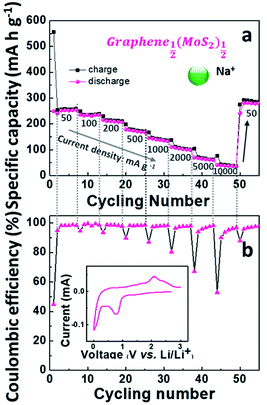
Although the lithium-ion battery has been greatly developed, the high cost and scarcity of lithium are driving research to develop alternatives to lithium-ion batteries, especially to meet future needs in energy storage. One potential alternative is sodium-ion batteries. Since Na+ is about 55% larger than Li+,41 a lot of electrode materials in lithium-ion batteries are not suitable in sodium-ion batteries. In this work, the electrochemical performance of graphene1−x(MoS2)x in a sodium-ion battery is summarized in Fig. 8.Fig. 8a depicts Nyquist plots of the impedance of the graphene1−x(MoS2)x electrodes in sodium-ion diffusion. The impedance of all the electrodes exhibited a semicircle behavior and a linear behavior in high and low-frequency regions, respectively. The behaviors were similar to those found in lithium-ion diffusion (Fig. 6). As summarized in Table 1, for these electrodes, Rct in sodium ions diffusion was larger than that in lithium ions diffusion. This phenomenon was caused by smaller sodium conductivity. The sodium ions diffusion coefficients DNa+ for all electrodes were much smaller than lithium ions diffusion coefficient DLi+ due to the larger sodium ion radius. Fig. 8c summarizes the sodium diffusion coefficients with the increase of MoS2 amount. The DNa+ reached a peak, 9.15 × 10⁻¹² cm2 s−1, when x= ½ (Graphene½(MoS2)½), and then decreased to 2.66 × 10⁻¹² cm2 s−1 and 0.31 × 10⁻¹² cm2 s−1 when x increased to ¾ and ⅚, respectively. Fig. 9 shows the rate capability of Graphene½(MoS2)½. The specific charge capacity was 252.29, 235.24, 206.74, 168.61, 134.17 mA h g−1 at current densities of 50, 100, 200, 500, and 1000 mA g−1. To note that to evaluate the stability of electrode in sodium ions intercalation and de-intercalation, the current density is increased to 10![[thin space (1/6-em)]](https://www.rsc.org/images/entities/char_2009.gif) 000 mA g−1 (10 A g−1). The specific charge capacity was 36.09 mA h g−1. When the current density decreased back to 50 mA g−1, the specific charge capacity of Graphene½(MoS2)½ was 282.37 mA g−1(coulombic efficiency: 96%), indicating the stability of this electrode.
000 mA g−1 (10 A g−1). The specific charge capacity was 36.09 mA h g−1. When the current density decreased back to 50 mA g−1, the specific charge capacity of Graphene½(MoS2)½ was 282.37 mA g−1(coulombic efficiency: 96%), indicating the stability of this electrode.
4. Conclusions
In this work, we studied the performance of micro-mesoporous graphene1−x(MoS2)x as anode in lithium-ion and sodium-ion batteries. We show that although large specific surface area provides more active sites to contact with electrolyte, it leads to increase of the irreversible capacity during the formation of solid electrolyte interphase. The pore size distributions of all micro-mesoporous graphene1−x(MoS2)x samples appear to be similar, with the averaged pore size being about 3.7 nm. The lithium diffusion coefficient of Graphene½(MoS2)½ electrode with pronounced micropores smaller than 2 nm is about twice that of Graphene¼(MoS2)¾ with scanty micropores. Graphene½(MoS2)½ achieves a specific charge capacity of 1319.02 mA h g−1 at the 50th cycle in lithium ion batteries. The discussion in this work may provide a clue of electrode material structural design.Conflicts of interest
There are no conflicts to declare.Acknowledgements
This work was supported by NIMS microstructural characterization platform as a program of “Nanotechnology Platform” of the Ministry of Education, Culture, Sports, Science and Technology (MEXT), Japan. Da-Ming Zhu is supported by a Funding for Excellence grant from University of Missouri-Kansas City and by a University of Missouri Research Board grant.References
- M. Wakihara and O. Yamamoto-Weinheim, Lithium Ion Batteries: Fundamentals and Performance, Wiley-VCH, Berlin, New York, Chichester, Brisbane, Singapore, Toronto, 1998 Search PubMed.
- X.-X. Yuan, H.-S. Liu and J.-J. Zhang, Lithium-ion Batteries: Advanced Materials and Technologies, CRC Press, Boca Raton, London, New York, 2011 Search PubMed.
- J. B. Goodenough and K.-S. Park, J. Am. Chem. Soc., 2013, 135, 1167–1176 CrossRef CAS PubMed.
- J. B. Goodenough and Y. Kim, Chem. Mater., 2010, 22, 587–603 CrossRef CAS.
- Y. Li, B. Xu, H. Xu, H. Duan, X. Lü, S. Xin, W. Zhou, L. Xue, G. Fu, A. Manthiram and J. B. Goodenough, Angew. Chem., 2017, 129, 771–774 CrossRef.
- Y. Ren, L. J. Hardwick and P. G. Bruce, Angew. Chem., Int. Ed., 2010, 49, 2570–2574 CrossRef CAS PubMed.
- J.-Y. Luo, J.-J. Zhang and Y.-Y. Xia, Chem. Mater., 2006, 18, 5618–5623 CrossRef CAS.
- A. D. Roberts, X. Li and H. Zhang, Chem. Soc. Rev., 2014, 43, 4341–4356 RSC.
- Y.-P. Wu, C.-R. Wan, C.-R. Wan, C.-Y. Jiang, S.-B. Fang and Y. Y. Jiang, Carbon, 1999, 37, 1901–1908 CrossRef CAS.
- B. Fang, M.-S. Kim, J. H. Kim, S. Lim and J.-S. Yu, J. Mater. Chem., 2010, 20, 10253–10259 RSC.
- T. Takamura, H. Awano, T. Ura and K. Sumiya, J. Power Sources, 1997, 68, 114–119 CrossRef CAS.
- F. Joho, B. Rykart, A. Blome, P. Novák, H. Wilhelm and M. E. Spahr, J. Power Sources, 2001, 97–98, 78–82 CrossRef CAS.
- V. Ramar, K. Saravanan, S. R. Gajjela, S. Hariharan and P. Balaya, Electrochim. Acta, 2013, 105, 496–505 CrossRef CAS.
- P. Novák, F. Joho, M. Lanz, B. Rykar, J.-C. Panitz, D. Alliata, R. Küta and O. Haas, J. Power Sources, 2001, 97–98, 39–46 CrossRef.
- D. Saikia, T.-H. Wang, C.-J. Chou, J. Fang, L.-D. Tsai and H.-M. Kao, RSC Adv., 2015, 5, 42922–42930 RSC.
- J. Li, L. Wang, X. He and J. Wang, ACS Sustainable Chem. Eng., 2016, 4, 4217–4223 CrossRef CAS.
- Y. Jeong, K. Lee, K. Kim and S. Kim, Materials, 2016, 9, 995 CrossRef PubMed.
- T. Dominko, J. M. Goupil, M. Bele, M. Gaberscek, M. Remskar, D. Hanzel and J. Jamnik, J. Electrochem. Soc., 2005, 152, A858–A863 CrossRef.
- H. Yu, C. Ma, B. Ge, Y. Chen, Z. Xu, C. Zhu, C. Li, Q. Ouyang, P. Gao, J. Li, C. Sun, L. Qi, Y. Wang and F. Li, Chem.–Eur. J., 2013, 19, 5818–5823 CrossRef CAS PubMed.
- W. Fang, C. Hua, X. Guo, Y. Hu, Z. Wang, X. Gap, F. Wu, J. Wang and L. Chen, Electrochim. Acta, 2012, 81, 155–160 CrossRef.
- T. S. Saha and S. Mitra, Sci. Rep., 2015, 5, 12571 CrossRef PubMed.
- C. Zhai, N. Du, H. Zhang, J. Yu, P. Wu, C. Xiao and D. Yang, Nanoscale, 2011, 3, 1798–1803 RSC.
- J. Jamnik and J. Maier, Phys. Chem., 2003, 5, 5215–5218 CAS.
- Y. S. Su and A. Manthrram, Chem. Commun., 2012, 48, 8817–8823 RSC.
- Y. Xu, Y. Huang, W. Yan, L. Zhang and Y. Chen, J. Nanosci. Nanotechnol., 2013, 13, 1116–1119 CrossRef CAS PubMed.
- X. Cao, Y. Shi, W. Shi, X. Rui, Q. Yan, J. Kong and H. Zhang, Small, 2013, 9, 3433–3438 CrossRef CAS PubMed.
- Y. Sun, J. Tang, K. Zhang, J. Yuan, J. Li, D.-M. Zhu, K. Ozawa and L.-C. Qin, Nanoscale, 2017, 9, 2585–2595 RSC.
- Q. Cheng, J. Tang, J. Ma, H. Zhang, N. Shinya and L.-C. Qin, Phys. Chem. Chem. Phys., 2011, 13, 17615–17624 RSC.
- X. Wang, H. Hao, J. Liu, T. Huang and A. Yu, Electrochim. Acta, 2011, 56, 4065–4069 CrossRef CAS.
- Y. Sun, C. Xu, B. Li, J. Zao, Y. He, H. Du and F. Kang, Int. J. Electrochem. Sci., 2014, 9, 6387–6401 Search PubMed.
- S. Lowerll and J. E. Shields, Powder surface area and porosity, Chapmen & Hall, 3rd edn, New York, 1991 Search PubMed.
- J. C. Groen, L. A. A. Peffer and J. Pérez-Ramírez, Micropor. Mesopor. Mat., 2003, 60, 1–17 CrossRef CAS.
- T. Stephenson, Z. Li, B. Olsen and D. Mitlin, Energy Environ. Sci., 2014, 7, 209–231 RSC.
- K. Dokko, M. Mohamedi, Y. Fujita, T. Itoh, M. Nishizawa, M. Umeda and I. Uchida, J. Electrochem. Soc., 2001, 148, A422–A426 CrossRef CAS.
- L. Wang, J. Zhao, X. He, J. Gao, J. Li, C. Wang and C. Jiang, Int. J. Electrochem. Sci., 2012, 7, 345–353 CAS.
- M. A. S. Ana, E. Benavente, P. Gómez-Romero and G. González, J. Mater. Chem., 2006, 16, 3107–3113 RSC.
- D.-W. Wang, Q. Zeng, G. Zhou, L. Yin, F. Li, H.-M. Cheng, I. T. Gentle and G. Q. M. Lu, J. Mater. Chem. A, 2013, 1, 9382–9394 RSC.
- J. Chmiola, G. Yushin, Y. Gogotsi, C. Portet, P. Simon and P. L. Taberna, Science, 2006, 313, 1760–1763 CrossRef CAS PubMed.
- S.-E. Cheon, K.-S. Ko, J.-H. Cho, S.-W. Kim, E.-Y. Chin and H.-T. Kim, J. Electrochem. Soc., 2003, 150, A800–A805 CrossRef CAS.
- G. Zhou. Design, Fabrication and electrochemical performance of nanostructured carbon based materials for high-energy lithium-sulfur batteries, Springer Singapore, Singapore, 2017 Search PubMed.
- D. A. Stevens and J. R. Dahn, J. Electrochem. Soc., 2001, 148, A803–A811 CrossRef CAS.
Footnote |
| † Current address: Department of Materials, University of Oxford, Parks Road, Oxford OX1 3PH, UK; The Faraday Institution, Quad One, Harwell Science and Innovation Campus, Didcot OX11 0RA, UK. |
| This journal is © The Royal Society of Chemistry 2021 |

