 Open Access Article
Structural, morphological, Raman, dielectric and electrical properties of La1−2xBaxBixFeO3 (0.00 ≤ x ≤ 0.20) compounds
E. M. Benali *ab,
A. Benaliabc,
M. Bejar
 a,
E. Dhahri
 a,
M. P. F. Graca
 c,
M. A. Valentec and
B. F. O. Costab
aLaboratoire de Physique Appliquée, Faculté des Sciences, Université de Sfax, B.P. 1171, 3000 Sfax, Tunisie. E-mail: benaliemna93@gmail.com
bUniversity of Coimbra, CFisUC, Physics Department, Rua Larga, P-3004-516 Coimbra, Portugal
cI3N and Physics Department, University of Aveiro, 3810-193, Aveiro, Portugal
First published on 10th November 2021
Abstract
La1−2xBaxBixFeO3 (0.00 ≤ x ≤ 0.20) nanoparticles were prepared by the auto-combustion method using glycine as a combustion fuel. X-ray diffractometry (XRD) measurements confirmed the orthorhombic structure of the synthesized compounds with the Pnma space group as a principal majority phase and showed the presence of a very minor secondary phase when x > 0.1. The nanosize criterion of the prepared compounds was confirmed from the crystallite size values calculated using the Williamson–Hall formalism. The relaxation process has been studied by the frequency dependence of the imaginary parts of impedance and modulus (Z′′ and M′′) which satisfied the Arrhenius law. Nyquist plots allowed us to obtain an adequate equivalent circuit involving the grains and grain boundary contributions. The activation energies calculated from Z′′, M′′ and the resistance of both contributions deduced from the Nyquist plots are found to be very similar. The conduction mechanism has been analyzed using the temperature dependence of the exponent Jonscher's power law parameter which confirms the NSPT conduction mechanism type for all compounds with an enhancement of the binding energy of the charge carrier (WH) with the substitution.
1 .Introduction
Lanthanum ferrite (LaFeO3) perovskite structures with the general formula ABO3 are considered as promising materials due to their interesting physico-chemical properties which make them potential candidates for a wide range of application areas.1–4 These physico-chemical properties depend not only on the composition but also on various parameters, such as the porosity and the particle size which are directly related to the synthesis method. Accordingly, pure and doped lanthanum ferrites have been prepared by several preparation processes such as microwave,5 hydrothermal,6 polymer pyrolysis,7 sonochemical methods,8 sol–gel methods,9–11 the solid-state route,12 sonoelectro-chemical synthesis methods13 and the chemical spin coating method.14Several studies have been focused on the dielectric and electrical properties of the Lanthanum ferrite. In this context, C. Chen et al.15 displayed that the LaFeO3 material exhibits a Debye relaxation with the activation energy of 0.237 eV. Besides, Mizusaki et al.16 reported that this compound presents an oxygen excess structure and p-type conductivity.
On the other side, previous researcher works have shown that the substitution of the La-site with divalent metals and/or Fe-site with transition metals has an important impact on the structural, magnetic, dielectric, electrical and gas sensing properties.17–19 For instance, it has been confirmed that the ‘‘Sr’’ ions substituted at the A-site of the LaFeO3 compound increase its electrical conductivity.20 Moreover, E. Cao et al.21 confirmed that the ‘‘Na’’ substitution in the La-site of LaFeO3 enhances this dielectric constant. Another study reported that the Ba substitution at the A-site reduces the electrical resistance.22 In addition, some studies reported that the substitution of La3+ ions by the Bi3+ ones leads to an improvement of the conductivity and the electrochemical performance.23,24
Moreover, we have previously studied the effect of substituting 20% of La ions by Ba and Bi-ones (10% for each ion), and we confirmed a decrease in electrical resistance and particle size as compared to literature which allowed the use of such material for gas sensing applications.25
It is important to mention that we early studied the substitution effect of La3+ ions by both Ba2+ and Bi3+ ones on structural, morphological, and ethanol and H2S gas sensing. The compound with x = 0.10 presents the lowest particle size with highest response to both gases.26 It was well confirmed that the gas sensing properties of semiconductor materials are highly dependent on both particle size and resistance properties. In the present work we highlighted the substitution effects on conduction mechanism, dielectric relaxation, and electrical properties.
La1−2xBaxBixFeO3 (x = 0.00, 0.05, 0.10, 0.15, and 0.20) compounds were synthesized by the auto-combustion method where an adequate glycine amount was used as combustible agent.
2. Experimental details
2.1. Characterization tools
The X-ray diffraction (XRD) of the samples was done at room temperature using a Siemens D5000 Diffractometer with Cu-Kα (λ = 0.154184 nm) radiation source and the data were collected in the range of 2θ = 10°–100°. Raman spectroscopy was recorded under the backscattering configuration using a Jobin Yvon HR800 system with 520 nm laser excitation source. The morphology of the powder was examined by a TESCAN VEGA3 SBH scanning electron microscope (SEM) equipped with an EDS detector Bruker XFlagh 410 M for elemental composition and the homogeneity of the compounds. For the electrical measurements, two conducting silver layers were coated on both sides of the pellets. Then, the transport properties of the studied materials were measured using an Agilent 4294A in the frequency range 80 Hz–1 MHz and the temperature range 150 K–400 K.2.2. Materials synthesis
La1−2xBaxBixFeO3 (x = 0.00, 0.05, 0.10, 0.15 and 0.20) compounds were synthesized by the auto-combustion method described in our previous study.25Stoichiometric amount of high-purity (≥ 99.9%) of iron nitrate Fe(NO3)3·9H2O, lanthanum nitrate La(NO3)3·6H2O, barium nitrate Ba(NO3)2 and bismuth nitrate Bi(NO3)3·5H2O are firstly dissolved in distilled water and an appropriate amount of glycine as fuel agent (C2H5NO2) was added to the solution and heated at 70 °C with a continuous stirring until getting dark brown viscos gel. The gel was then heated at 170 °C until it automatically ignited and burnt in some few seconds (with very glowing flints) yielding black ashes (fine powder). The obtained powders are sintered at 700 °C for 30 min to obtain the required samples.
2.3. Methodology and calculations equations
 | (1) |
| Γ = 7Ag + 7B1g + 5B2g + 5B3g | (2) |
 | (3) |
 | (4) |
 | (5) |
 | (6) |
The Jonscher's power law used to adjust the conductivity:32
| σ = σdc + Aωs | (7) |
According to the NSPT model, the exponent s is given by the following equation:33
 | (8) |
 | (9) |
3. Results and discussion
3.1 Structural properties
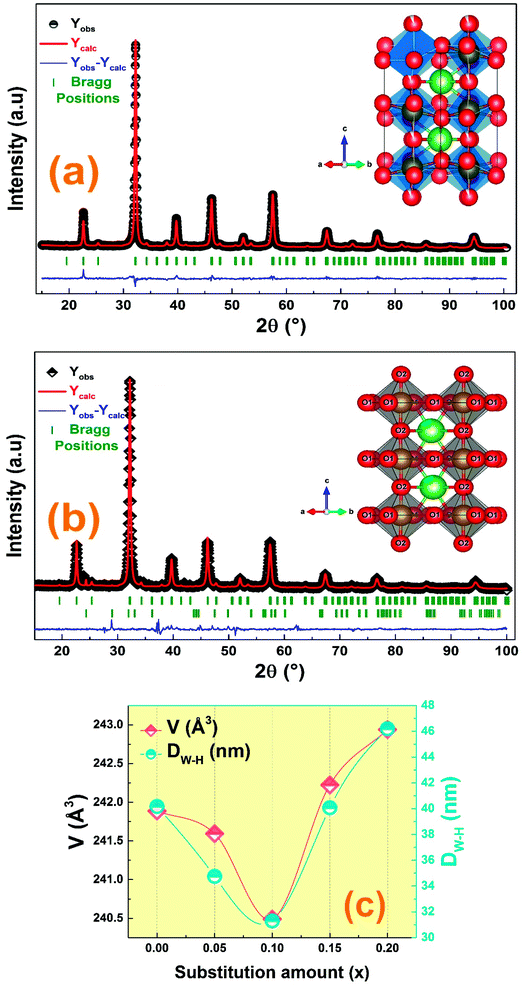
Fig. 1 denotes the X-ray room temperature diffraction patterns of the prepared La1−2xBaxBixFeO3 (x = 0.00, 0.05, 0.10, 0.15 and 0.20) compounds. As shown in this figure, the XRD patterns of all prepared compounds present the same diffraction peaks of the LaFeO3 compound34 which confirms that they crystallized in an orthorhombic structure with Pnma space group. Moreover, some additional diffraction peaks have been detected for compounds with a high amount of Bi3+ and Ba2+ ions (>10%). Using the X'pert-High score software, these minoritarian secondary phases have been identified to be the “Bi2O2.7” and “BaFeLaO4” phases. To better understand the effect of simultaneous substitution of La3+ ions by Bi3+ and Ba2+ ones on structural parameters, we performed the adjustment of the XRD patterns of all compounds according to the Rietveld method35 using the Fullprof software36. The Rietveld refinement results for all compounds are presented in Fig. 2 and the resulting cell parameters and volume are regrouped in Table 1. As the goodness of refinement is evaluated by the χ2 values (Table 1), which were found to be of low values confirming the high quality of refinement for all compounds.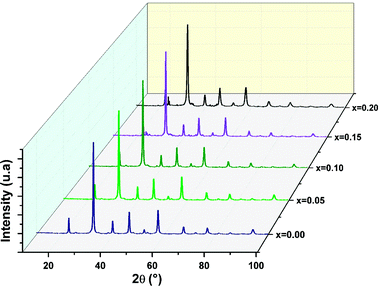 | ||
| Fig. 1 Comparison of XRD patterns of the La1−2xBixBaxFeO3 (x = 0.00, 0.05, 0.10, 0.15 and 0.20) compounds. | ||
| 0.00 | 0.05 | 0.10 | 0.15 | 0.20 | |
|---|---|---|---|---|---|
| a (Å) | 5.548 | 5.545 | 5.5401 | 5.553 | 5.559 |
| b (Å) | 7.848 | 7.846 | 7.820 | 7.831 | 7.832 |
| c (Å) | 5.555 | 5.553 | 5.551 | 5.5702 | 5.579 |
| V (Å3) | 241.886 | 241.593 | 240.489 | 242.223 | 242.938 |
| χ2 | 2.049 | 2.214 | 2.756 | 2.932 | 2.660 |
| Fe–O1 (Å) | 1.962 | 1.970 | 1.862 | 1.971 | 1.962 |
| Fe–O2 (Å) | 2.106 | 2.396 | 2.385 | 2.259 | 2.157 |
| Fe–O1–Fe (°) | 150.961 | 139.514 | 137.853 | 136.588 | 138.701 |
| Fe–O2–Fe (°) | 174.517 | 169.263 | 177.243 | 178.274 | 178.357 |
| DW–H (nm) | 40.170 | 34.749 | 31.298 | 40.072 | 46.200 |
| DSEM (μm) | 0.769 | 0.704 | 0.628 | 0.893 | 0.967 |
From the detailed structural analysis, the Rietveld refinement parameters of Ba and Bi doped LaFeO3 nanoparticles are carried out by assuming the orthorhombic structure with the Pnma space group. The parameters obtained from the structural refinement of the X-ray patterns are collected in Table 1. The ionic positions allow us to draw the graphical model of our prepared sample Fig. 2(c).
From Table 1, we can notice that the insertion of Ba and Bi ions in the A-site leads to a variation of all the obtained structural parameters. Also, we observe a variation of the Fe–O–Fe angle and the Fe–O distance, which can be explained by the difference in the size of the cations in the A-site, since the ions radius of Ba2+ (1.42 Å) and Bi3+ (1.17 Å) are larger than that of La3+ (1.16 Å) one.37 Normally, the increase of substitution amount should be accompanied by an increase in the cell parameters and cell volume which is not the case. All the structural parameters are found to decrease with the substitution amount to reach minimum values for x = 0.1 sample and increase for further substitution. In fact, this behavior has been studied in previous work, and has been found to be related to the decrease of the formation of oxygen vacancies and the presence of the secondary phases for the compounds with the substitution amount with x > 0.1.38
Furthermore, the average crystallite size of the La1−2xBaxBixFeO3 nanoparticles was calculated using the Williamson Hall's method eqn (1).27
The value of DW–H was calculated using the intercept of the linear fit of (β![[thin space (1/6-em)]](https://www.rsc.org/images/entities/char_2009.gif) cos(θ)) vs. (4
cos(θ)) vs. (4![[thin space (1/6-em)]](https://www.rsc.org/images/entities/char_2009.gif) sin(θ)) (Fig. 3). Accordingly, the calculated crystallite size values of the studied compounds were presented in Table 1. The variation of the crystallite size values is quite similar to the structural parameter trend with substitution.
sin(θ)) (Fig. 3). Accordingly, the calculated crystallite size values of the studied compounds were presented in Table 1. The variation of the crystallite size values is quite similar to the structural parameter trend with substitution.
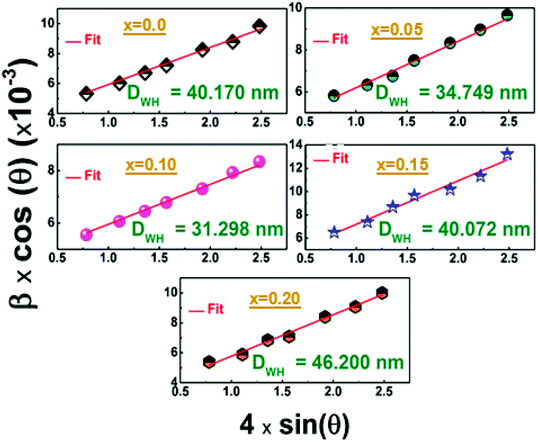 | ||
| Fig. 3 Williamson–Hall plots of the of the La1−2xBixBaxFeO3 (x = 0.0, 0.05, 0.1, 0.15 and 0.2) compounds. | ||
3.2 Morphological study
The morphologies of the La1−2xBaxBixFeO3 nanostructures compounds obtained by the auto-combustion reaction are examined by the SEM analysis (Fig. 4), which is a very useful tool to characterize the surface morphology and microstructure of our synthesized samples. The porous structure is seen in the SEM images; one can see that the grains show an irregular morphology.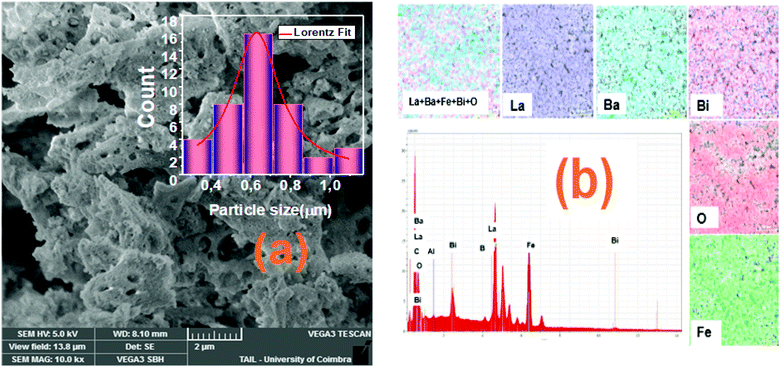 | ||
| Fig. 4 (a) SEM image and histogram plot for particle size distribution of sample with x = 0.10 and (b) the EDS spectrum with the mapping of chemical elements. | ||
The grain size distribution was calculated based on the SEM images and using the “Image-J” software. The obtained histogram for the La0.8Ba0.1Bi0.1FeO3 (x = 0.1) compound is illustrated in Fig. 4a. A Lorentzian adjustment was used to calculate the grain size of all samples. All the obtained grain size values are collected in Table 1, and the trend of these values with the substitution amount is in good agreement with that of crystallite size obtained from the structural study. However, we can note that the grain size values are much higher than those of crystallites which confirms that one grain is composed by several crystallites. On the other side, in order to confirm the existence of the elemental composition of our prepared ceramics, an Energy Dispersive X-ray Spectroscopy (EDS) has been used. The spectra illustrated in Fig. 4b shows the presence of the peaks corresponding to all starting elements for the preparation of La1−2xBaxBixFeO3 compounds (La, Ba, Bi, Fe and O). One can see that the carbon (C) and aluminum (Al) elements are also present in the spectrum of all samples. The presence of these two elements can be explained by the carbon tape used in the EDS analysis and the Al peak it comes from the aluminum used to cover the beaker during the auto-combustion reaction. These results confirm well the absence of chemical element losses during the preparation steps.
Furthermore, the atomic weight percentages of our compounds are given in Table 2. The elemental composition values are almost in good agreement with stoichiometric chemical composition.
| x | La (%)EDS | Fe (%)EDS | O (%)EDS | Bi (%)EDS | Ba (%)EDS |
|---|---|---|---|---|---|
| 0.00 | 17.96 | 17.31 | 56.23 | — | — |
| 0.05 | 18.37 | 20.15 | 61.26 | 0.95 | 1.02 |
| 0.10 | 14.62 | 17.70 | 54.82 | 1.78 | 1.83 |
| 0.15 | 14.22 | 19.31 | 60.96 | 3.02 | 3.04 |
| 0.20 | 11.89 | 19.27 | 59.48 | 3.89 | 3.95 |
3.3. Raman scattering spectra
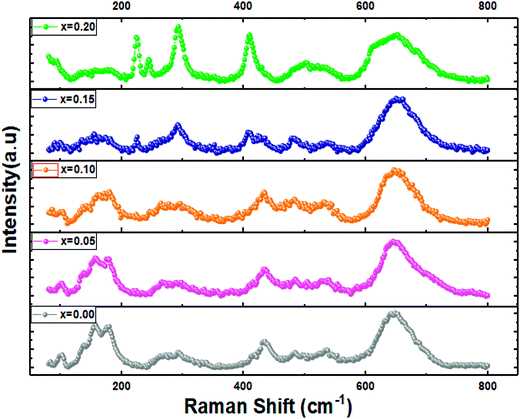
Raman spectroscopy is known as a powerful tool for phase structural analysis and it is more sensitive than the XRD because its excitation energy is less penetrating than X-ray.39 It was reported that the Raman spectra of pure and doped LaFeO3 compounds with the orthorhombic structure and Pnma space group present 24 active Raman modes given by eqn (2).28Fig. 5 shows the RT Raman spectra of La1−2xBaxBixFeO3 (x = 0.0, 0.05, 0.10, 0.15 and 0.20) materials, which reveals the presence of almost the Raman actives modes of the pure LaFeO3 (x = 0.0) sample. Also, these observed Raman peaks are in good agreement with those reported in our previous work for the case of LBBFO-AC and LBBFO-SG compounds25.
The four Raman modes selected above are: the modes present below 200 cm−1 which are caused by the La vibrations and are known as mode (A), modes between 200 cm−1 and 300 cm−1 related to the oxygen octahedral tilt modes (T) in La, modes present between 400 cm−1 and 450 cm−1 attributed to the oxygen octahedral bending vibrations (B) and finally the modes above 500 cm−1 identified by the oxygen stretching vibrations (S).40 However, we must note that no other additional peaks corresponding to the secondary phase were found like in XRD patterns.
The Raman peaks of the prepared samples were fitted using the Lorentzian functions (Fig. 6). As we can see, the Ba2+ and Bi3+ doping ions affect the ‘‘La’’ vibration modes (A). Further, the shift of some Raman signals towards the lower or the higher wavenumber and the variation in their intensities are influenced by the crystallite size, lattice size and defects.41
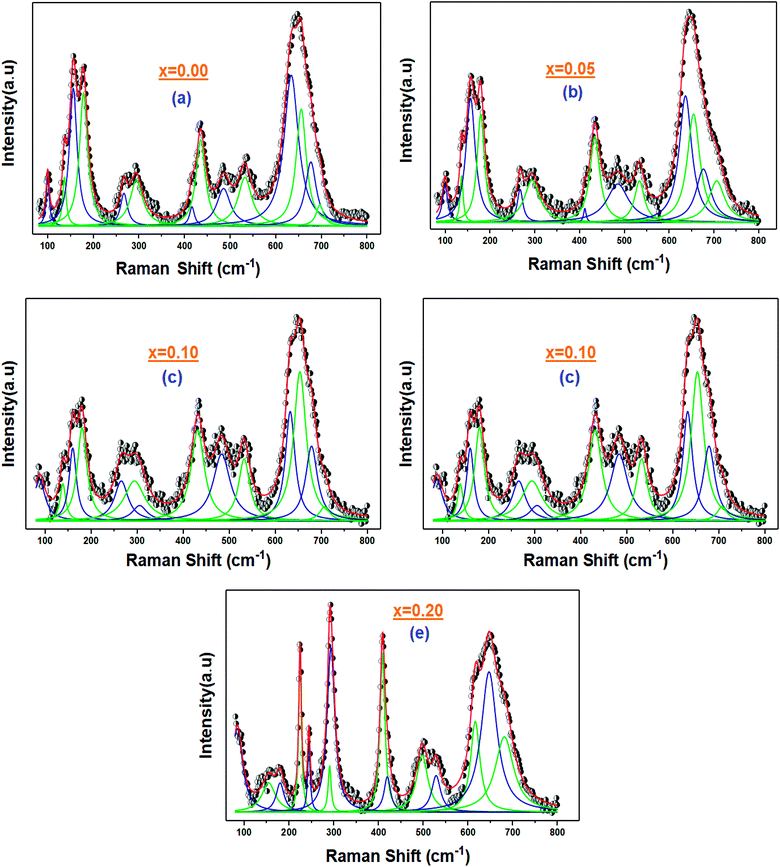 | ||
| Fig. 6 (a–e) Fitting curves of the Raman signal for the La1−2xBaxBixFeO3 (x = 0.0, 0.05, 0.10, 0.15 and 0.20) ceramic samples with the Lorentzian line shapes. | ||
3.4. Complex impedance spectra
We have measured the reel and imaginary parts of the complex electrical impedance of all La1−2xBaxBixFeO3 (x = 0.0, 0.05, 0.10, 0.15 and 0.20) compounds at several temperatures in the frequency range of 100 Hz to 1 MHz in order to study their relaxation process. Fig. 7 illustrates the variation of real part of the impedance (Z′) of La1−2xBaxBixFeO3 (x = 0.0, 0.05, 0.1, 0.15 and 0.2) compounds with respect to frequency at selected temperature range. For all temperatures, the (Z′) values are found to decrease with increasing frequency. The maximum values of Z′ of all compounds have been recorded at low-frequency range which may indicate an accumulation of a space charge polarization.42 Moreover, it was also noticed that the (Z′) values decrease with the increase of temperature, indicating the existence of a negative thermal coefficient of resistance (NTCR) behavior at the lower frequency region.43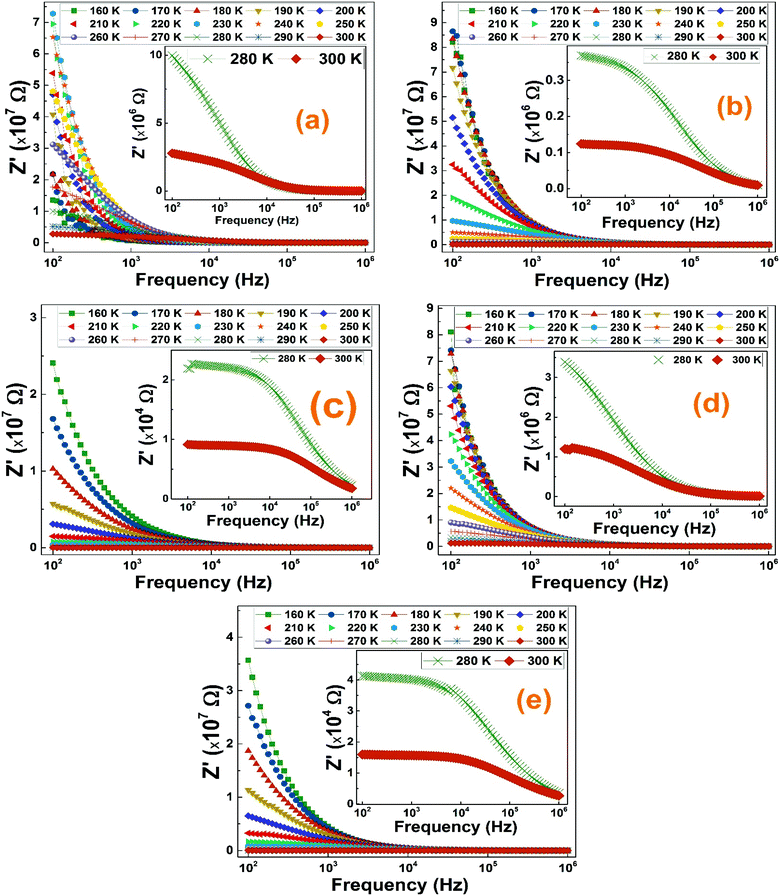 | ||
| Fig. 7 (a–e) The frequency dependence of the real part of impedance at serval temperature of La1−2xBaxBixFeO3 (x = 0.0, 0.05, 0.10, 0.15 and 0.20) ceramic samples. | ||
The merging trend of all compounds graphs at high frequencies reveals the release of space charge and a reduction of barrier in materials which is always accompanied by an increase of the electrical conductivity as it will be proved in the ac-conductivity section.44 Normally, for known temperature, the increasing trend of the Z′ values with increasing frequency presents an inflexion point where the imaginary part graph shows a relaxation peak.45
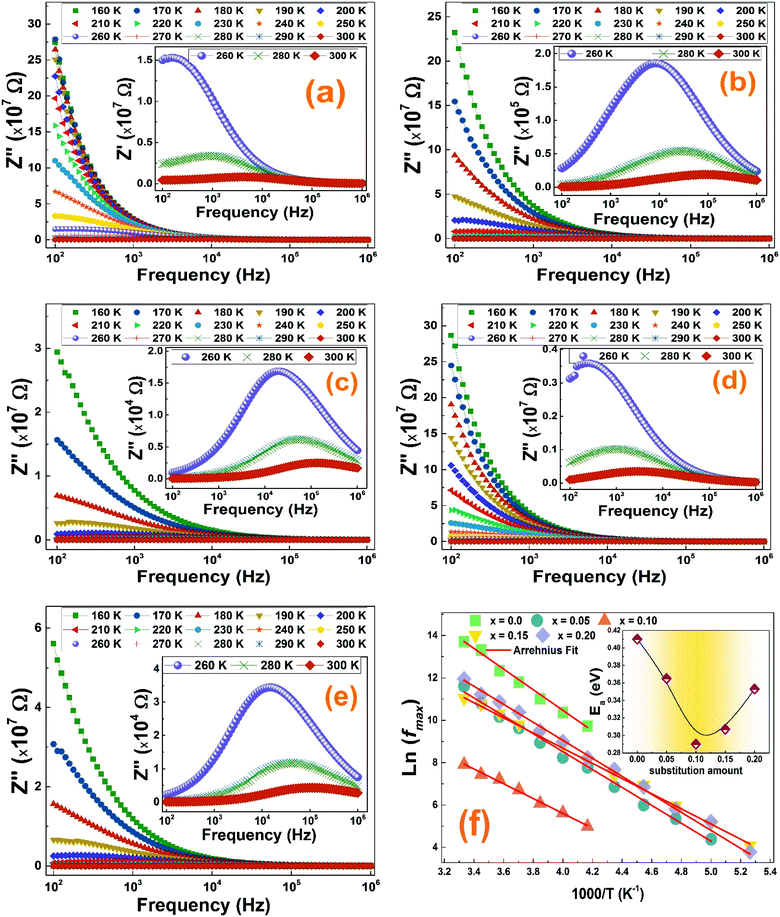
To better understand the relaxation process throughout the La1−2xBaxBixFeO3 (x = 0.0, 0.05, 0.1, 0.15 and 0.2) compounds, we plotted in Fig. 8 the frequency and temperature dependence of the imaginary part of the complex electrical impedance Z′′.
As we can see in Fig. 8, for all compounds, Z′′ increases when increasing the frequency to reaches a maximum value, indicating the presence of relaxation phenomenon in these nanoparticles, before it decreases quickly.46 The merging of all curves at high frequency shows a possible release of space charge.47 Furthermore, two characteristic phenomena have been noticed in Z′′ graphs of all compounds: the increase in temperature is accompanied by a decrease of the peak heights and alongside, a shift of the peak positions towards higher frequency. This can be related to the existence of a thermally activated dielectric relaxation in the studied compounds.
For all compounds, the activation energy (Ea) was extracted by plotting the change of ln(fmax) versus the inverse of temperature (1/T) as shown in Fig. 8(f) with respect to the Arrhenius equation described by eqn (3).
The extracted activation energy (Ea) values, from the slope of linear adjustment of the ln(fmax) vs. (1/T) curves, and the calculated Ea values are collected in Table 3. As presented in the inset of Fig. 8(f), the activation energy was affected by the substitution amount: it decreases until a minimum for the compound with x = 0.10 and then increases for further substitution amount.
| Contribution | Ea (eV) | |||||
|---|---|---|---|---|---|---|
| x = 0.00 | x = 0.05 | x = 0.10 | x = 0.15 | x = 0.20 | ||
| (Z”) vs. frequency | 0.410 | 0.365 | 0.29 | 0.307 | 0.353 | |
| (M”) vs. frequency | Grain boundary | 0.401 | 0.341 | 0.278 | 0.282 | 0.302 |
| Grain | — | 0.162 | 0.142 | 0.179 | 0.246 | |
| (Z”) vs. (Z′) | Grain boundary | 0.413 | 0.281 | 0.181 | 0.258 | 0.266 |
| Grain | 0.117 | 0.223 | 0.146 | 0.228 | 0.246 | |
| ln(σac × T) vs. 1000/T | 0.396 | 0.358 | 0.289 | 0.324 | 0.353 | |
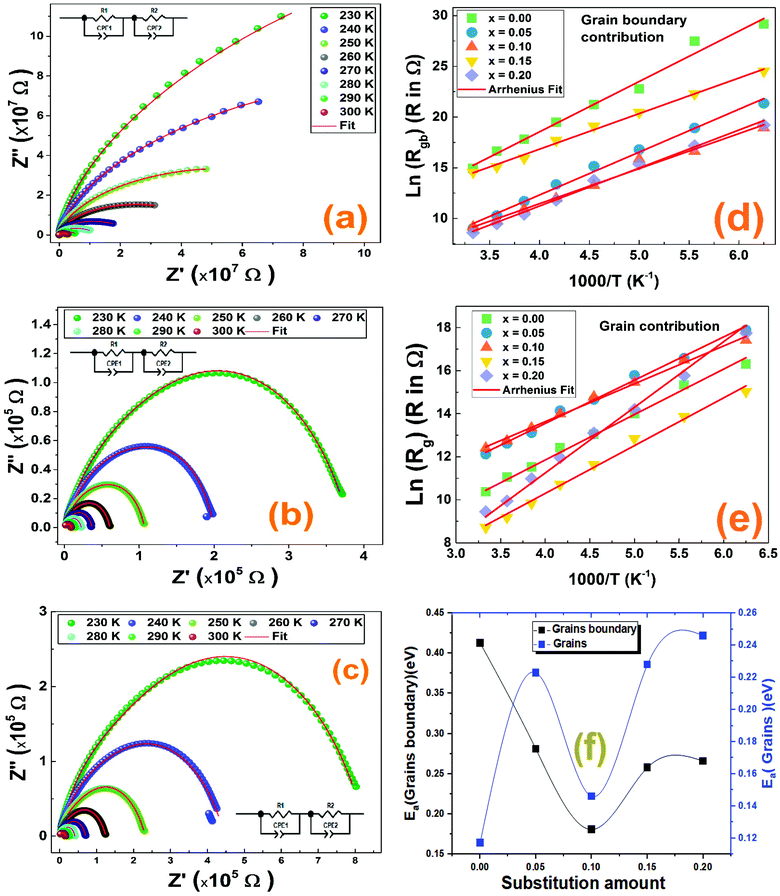
In order to know the origin of the relaxation peaks that appeared in the imaginary part of the impedance curves and to better study separately the dielectric properties of all contributions of the studied compounds, we modeled our systems using an equivalent electrical circuit to adjust the Nyquist Cole/Cole plots at different temperatures. The Nyquist plots of La1−2xBaxBixFeO3 (x = 0.0, 0.05, 0.10, 0.15 and 0.20) compounds are presented in Fig. 9. It is clearly seen that, for all compounds, when increasing temperature, the diameter of semicircles decreases indicating an increase of the total electrical conductivity.48 Obviously, the Nyquist plots are consistent of more than semicircle proving the existence of more than one contribution. We have used the Z-view software to adjust these Nyquist plots for all compounds.49 The adequate electrical circuit consists of series combination of two resistors R1 and R2, where each one is in parallel with constant phase element (Q1 and Q2) as presented in the inset of all Nyquist plots in Fig. 9. This confirms well the existence of the grain and grain boundary contributions in the studied compounds at low and high frequency ranges, respectively.
Thus, the total conductivity has both the grain and grain boundary contributions. These results are quite similar to those of doped lanthanum ferrite systems50.
The values of the obtained fitting parameters are listed in Tables 4 and 5. As one can see, the resistance of both contributions decreases with increasing temperature proving the semiconducting criteria of the studied materials. Moreover, the resistance of the grain boundary contribution is higher than of the grain one which is in good agreement with previous results of ferroic perovskite materials.51,52 Also, we can deduce that the values of the alpha (α) parameter are around the unite for all compounds at the used temperature range which means that the QPE element is very close to a capacitance. We have plotted the logarithmic resistance values of both contributions as function of the inverse of temperature (1/T) with respect of the Arrhenius power law eqn (4), in order to evaluate the effect of the substitution on the activation energy corresponding to grain and grain boundary contributions.
| Grain contribution | ||||||||||||||||
|---|---|---|---|---|---|---|---|---|---|---|---|---|---|---|---|---|
| T (K) | x = 0.00 | x = 0.05 | x = 0.10 | x = 0.15 | x = 0.20 | |||||||||||
| Rg (105 Ω) | QPEg (10−10) | α | Rg (105 Ω) | QPEg (10−10) | α | Rg (105 Ω) | QPEg (10−10) | α | Rg (105 Ω) | QPEg (10−10F) | α | Rg (105 Ω) | QPEg (10−10) | α | ||
| 160 | 120.549 | 1.25 | 1 | 589.884 | 0.052 | 0.85 | 364.214 | 0.24 | 1.03 | 33.556 | 2.42 | 1.02 | 508.993 | 1.16 | 1.02 | |
| 180 | 45.975 | 1.15 | 1.03 | 159.152 | 0.019 | 1 | 145.526 | 0.86 | 1 | 10.576 | 0.273 | 0.86 | 70.538 | 1.96 | 1 | |
| 200 | 11.984 | 1.85 | 1 | 71.452 | 0.099 | 0.78 | 51.810 | 0.0612 | 0.86 | 3.761 | 0.956 | 0.56 | 14.701 | 0.064 | 0.81 | |
| 220 | 4.616 | 0.19 | 1 | 23.316 | 0.012 | 0.76 | 26.372 | 0.105 | 0.78 | 1.124 | 0.010 | 0.73 | 4.913 | 0.056 | 0.77 | |
| 240 | 2.479 | 0.30 | 0.97 | 13.864 | 0.077 | 0.72 | 11.940 | 0.92 | 0.77 | 0.453 | 0.053 | 0.69 | 1.555 | 0.33 | 0.83 | |
| 260 | 1.018 | 15.06 | 1 | 4.975 | 0.28 | 0.73 | 6.204 | 0.74 | 0.71 | 0.187 | 0.015 | 0.71 | 0.588 | 0.16 | 0.78 | |
| 280 | 0.634 | 13.10 | 0.86 | 3.015 | 7.26 | 0.74 | 3.410 | 0.97 | 0.74 | 0.096 | 0.40 | 0.77 | 0.207 | 1.03 | 0.85 | |
| 300 | 0.321 | 14.89 | 0.87 | 1.839 | 0.10 | 0.72 | 2.428 | 0.142 | 0.75 | 0.061 | 0.043 | 0.73 | 0.126 | 1.48 | 0.84 | |
| Grain boundary contribution | |||||||||||||||
|---|---|---|---|---|---|---|---|---|---|---|---|---|---|---|---|
| T (K) | x = 0.00 | x = 0.05 | x = 0.10 | x = 0.15 | x = 0.20 | ||||||||||
| Rgb (107 Ω) | QPEgb (10−12) | α | Rgb (107 Ω) | QPEgb (10−12) | α | Rgb (107 Ω) | QPEgb (10−12) | α | Rgb (107 Ω) | QPEgb (10−12F) | α | Rgb (107 Ω) | QPEgb (10−12) | α | |
| 160 | 463![[thin space (1/6-em)]](https://www.rsc.org/images/entities/char_2009.gif) 000 000 |
2.417 | 0.750 | 187.239 | 0.416 | 0.919 | 16.718 | 0.5276 | 0.66 | 4470.142 | 0.809 | 0.550 | 22.142 | 0.277 | 0.611 |
| 180 | 85![[thin space (1/6-em)]](https://www.rsc.org/images/entities/char_2009.gif) 480 480 |
2.370 | 0.689 | 16.501 | 0.886 | 0.655 | 1.642 | 0.769 | 0.72 | 474.9927 | 1.698 | 0.570 | 2.84 | 0.496 | 0.620 |
| 200 | 779 | 6.188 | 0.591 | 1.967 | 2.308 | 0.577 | 0.774 | 1.233 | 0.72 | 76.4 | 2.330 | 0.604 | 0.47 | 1.470 | 0.593 |
| 220 | 164.8 | 7.950 | 0.550 | 0.381 | 4.909 | 0.591 | 0.057 | 2.842 | 0.65 | 19.9 | 2.241 | 0.722 | 0.0948 | 3.297 | 0.587 |
| 240 | 29.43 | 9.661 | 0.529 | 0.062 | 6.890 | 0.560 | 0.016 | 3.639 | 0.61 | 4.81 | 3.833 | 0.744 | 0.0134 | 4.170 | 0.605 |
| 260 | 5.41 | 13.822 | 0.508 | 0.012 | 8.540 | 0.589 | 0.0054 | 4.652 | 0.60 | 0.84 | 4.244 | 0.713 | 0.00336 | 6.940 | 0.611 |
| 280 | 1.7 | 15.161 | 0.516 | 0.00294 | 9.651 | 0.583 | 0.00162 | 5.761 | 0.58 | 0.36 | 4.976 | 0.629 | 0.00132 | 7.050 | 0.639 |
| 300 | 0.31 | 18.830 | 0.527 | 8.225 × 10⁻⁴ | 10.840 | 0.632 | 9.539 × 10⁻⁴ | 52.76 | 0.66 | 0.21 | 6.036 | 0.717 | 5.420 × 10⁻⁴ | 10.508 | 0.608 |
Where R0 is the characteristic resistance and Ea is the activation energy. Related to eqn (4), the plots of ln(Rg/ bg) vs. 1000/T (Fig. 9) would be linear and one can estimate the Ea using the slope of the linear fit. The calculated activation energy values of grain and grain boundary contributions are collected in Table 3. It was reported that the insertion of Bi3+ in the A site of LaFeO3 acts to decrease the activation energy values.53 The behavior of activation energy (Fig. 9(f)) and resistance are quite similar to the crystallite size behavior previously calculated by the Williamson–Hall formalism; the compound with x = 0.10 presents the lowest value of resistance and activation energies of both grain and grain boundary contributions. We have previously proved the high utility of the La0.8Ba0.1Bi0.1FeO3 compound (x = 0.10) for gas sensing applications.26
3.5. Complex electrical modulus analysis
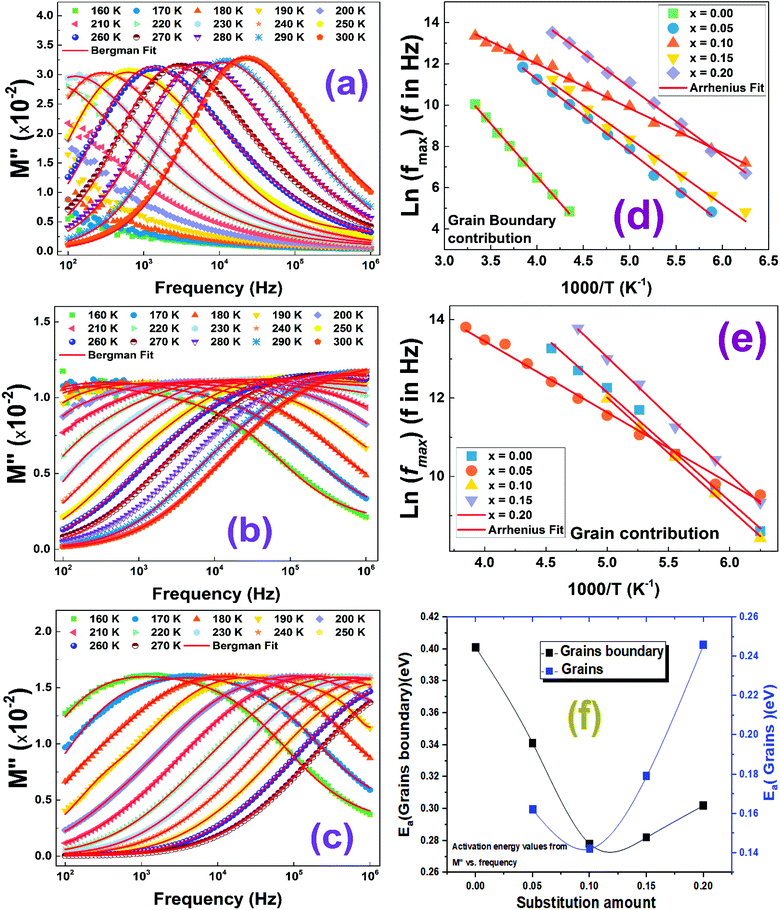
The complex modulus analysis is a very useful characterization technique used to differentiate the dielectric relaxations of grain (bulk) and grain boundary contributions. The variation of the imaginary parts of the modulus (M′′) of all compounds as function of the frequency, over the 150–300 K temperature range, are shown in Fig. 10.It is important to notice that for the compound with x = 0.00 (Fig. 10(a)), only one relaxation peak has been detected in the selected temperature range, while when introducing barium and bismuth ions in A-site of the lanthanum ferrite material, a second relaxation has been identified. We can mention also that all relaxation peaks shift towards higher frequencies when increasing the temperature which confirms well the thermally activated relaxation processes.54 It is important to note the existence of a pure conduction process occurring generally at low frequencies where ions move freely on long-distance.55 When relaxation peaks shift to high frequencies, almost ions will be confined in the localized motion corresponding to the short-distance carriers hopping process.56–58
To further qualify the relaxation process of different contributions on the La1−2xBaxBixFeO3 (x = 0.0, 0.05, 0.10, 0.15 and 0.20) compounds, we have adjusted the M′′ experimental data using eqn (5).29
To calculate the activation energies of both contributions, we used the obtained values of fmax and we plotted the variation of ln(fmax) as function of 1000/T as shown in Fig. 10(d) and (e). The calculated activation energy values are plotted in Fig. 10(f). We found that these values are in good agreement with those previously deduced from the resistance value (Fig. 9(f)). Once again, the compound with x = 0.10 presents the lowest activation energy for grain and boundary grain contributions. Accordingly, we confirm the important utility of substituting La3+ ions by together Ba2+ and Bi3+ ones with a substitution amount lower than 10% that decreases the activation energy and the crystallite size values.
3.6. The electrical conductivity
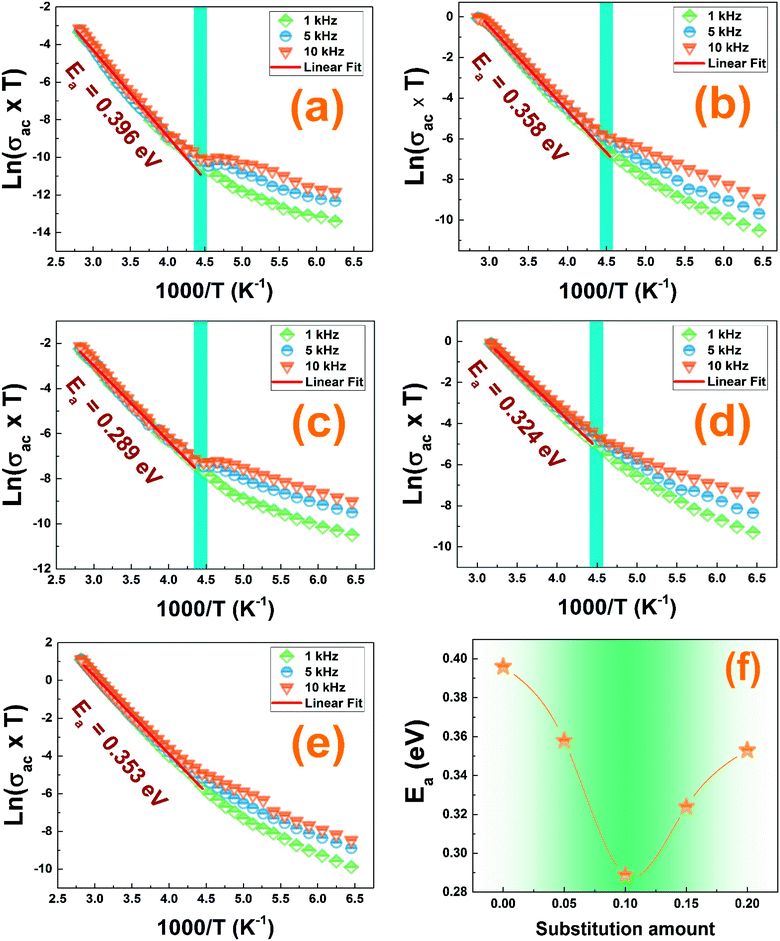
The electrical conductivity is helpful to reveal more information about the nature of the conduction mechanism. We plotted in Fig. 11 the logarithmic variation of the ac-conductivity multiplied by temperature (ln(σac*T)) as function of 1000/T at the selected frequencies. Two distinguish regions are clearly seen for all studied compounds; low and high temperature ranges. At high temperature region, the ac-conductivity of all compounds was found to depend only on temperature; does not depend on the frequency and it increases when increasing temperature indicating a thermally activated conduction mechanism.59 While at low temperature region, the ac-conductivity depends on both temperature and frequency. It increases with the rise in temperature for each frequency and also it rises when increasing frequency for a given temperature as shown in Fig. 11. As known, for the large polaron hopping process, the ac conductivity decreases with frequency while it increases for the small polaron hopping process.60,61 For T < 222 K, one can see that the increase of frequency results in an enhancement of the ac-conductivity. This confirms well that at low temperatures, the conduction process occurs essentially by the small polaron hopping between localized states as we will study in detail in the following part using Jonscher's power law.In the high temperature region, the plots of all the frequencies seem to merge into a single curve. We have calculated the activation energy in the region of temperature T > 222 K using the Arrhenius' law given by eqn (6).31
The activation energy values, deduced from the slopes of each linear adjustment, are collected in Table 3. These obtained values are in good agreement with those previously calculated which suggests that the relaxation process and the electrical conductivity are attributed to the same type of charge carriers, specifically the jump of electrons between the states of iron. The decrease of the activation energy values, when introducing less than 10% of barium and bismuth ions, can be correlated with the decrease of crystallites size. When the substitution amount is higher than 10%, the increase of the crystallites size is followed by an enhancement of the activation energies.
Fig. 12 shows the frequency dependence of the electrical conductivity for our prepared ceramics at selected temperatures. It is observed that the ac conductivity curves increase with the rise of the frequency for all the samples which confirms that the conduction is due to the small polaron hopping process.60,61 We can distinguish two regions with the variation of the frequency: (R1) is a plateau region and (R2) is a dispersion region. For the plateau, detected at low frequency region and corresponding to σdc, the conductivity increase, with the rise of the temperature, indicates that the electrical conductivity is a thermally activated process and the conductivity is independent of frequency. The dispersion region at high frequency range corresponds to the ac conductivity σac. Related to Jonscher's power law, this frequency dependence behavior in this region can be due to the relaxation phenomena arising due to the hopping of mobile charge carriers.62 For more information about the conduction process in our compounds, the analysis is done by Jonscher's power law given by eqn (7).32
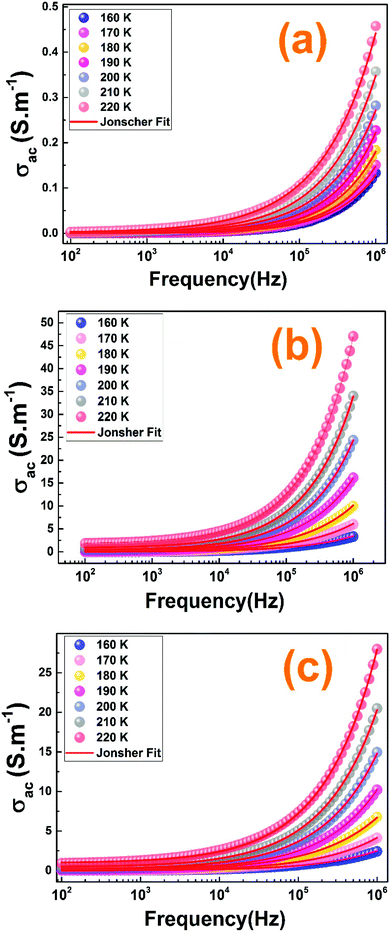 | ||
| Fig. 12 (a–c) The ac-conductivity adjustment results with the Jonscher's power law of the La1−2xBaxBixFeO3 (x = 0.00, 0.10 and 0.20) compounds, respectively. | ||
Fig. 12 shows the well-fitting curves of the conductivity. The value s ≤ 1 indicates a translational motion with a sudden hopping and the value s > 1 means the presence of a localized hopping.63 For our samples, the s values are found to vary in the range of 0–1. So, we can confirm the presence of a translational motion with a sudden hopping in our compounds.
To determine the predominant conduction process for our compounds, we examined the variation of the parameter “s” as function of the temperature plotted as shown in Fig. 13. Different models have been suggested to describe the behavior of the exponent ‘‘s’‘, for instance, the Small Polaron Tunneling (NSPT) model, where the exponent ‘‘s’’ increases with the rise of the temperature,64 for the Quantum Mechanical Tunneling (QMT) model, the exponent ‘‘s’’ is independent of temperature and is almost equal to 0.8,65 the Correlated Barrier Hopping (CBH) model where ‘‘s’’ decreases with the rise of the temperature66 and the Overlapping Large-Polaron Tunneling (OLPT),67 where the exponent s decreases with the rise of temperature predicting a minimum value and then increases again. For our samples, from the increase of the s values with the increase of the temperature, we can deduce that the most appropriate model for describing conductivity is the NSPT one.
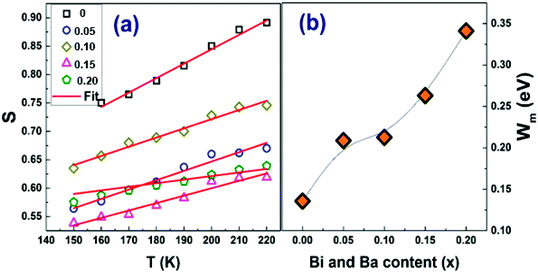 | ||
| Fig. 13 (a) Variation of the exponent of Jonscher's power law S vs. T and (b) the Wm activation energies of the La1−2xBixBaxFeO3 (x = 0.0, 0.05, 0.1, 0.15 and 0.2) compounds. | ||
According to the NSPT model, the exponent s is given by eqn (8).33 For large values of  ,the equation given the exponent “s” eqn (8) is replaced by eqn (9).
Using the linear fit of the variation of “s” as function of the temperature, shown in Fig. 13(a), we have determined the values of WH for our samples. From Fig. 13(b) illustrating the variation of the WH values as function of the amount of substitution, it is clearly seen that the binding energy increases with the rise of the Ba and Bi contents.
4. Conclusion
In our study, the Bi and Ba doped La1−2xBaxBixFeO3 (x = 0.00, 0.05, 0.10, 0.15 and 0.2) compounds were synthesized by the auto-combustion route. The structural study by XRD measurements showed a Pnma orthorhombic structure with two secondary phases corresponding to the same space I4/mmm group for the compounds with x = 0.15 and 0.2. The XRD and SEM analyses revealed that the average crystallites and grains sizes of our samples change with the rise of the amount of the Bi and Ba. The vibrational study means by Raman spectroscopy, revealed the presence of all the vibration modes related to the Pnma space group. The impedance, the modulus and the ac conductivity data were carried out over a frequency and temperature range of (102 to 106 Hz) and (150 K to 300 K). The impedance analysis confirmed the presence of the relaxation phenomena and the contribution of grain boundary in transport properties. The evolution of the ac conductivity has proven a Jonscher's behavior where the exponent s showed an increasing trend for all samples (NSPT model). Besides, the activation energies obtained from the impedance, modulus and conductivity process are very close.The study of the doping of barium and bismuth ions in the A site of LaFeO3 helps us to explore this compound with improved structural, morphological and dielectric properties to be employed in modern-day applications like the gas sensor application which is already mentioned by our previous work.
Conflicts of interest
There are no conflicts to declare.Acknowledgements
This work was supported by national funds from FCT – Fundação para a Ciência e a Tecnologia, I.P., within the projects UIDB/04564/2020 and UIDP/04564/2020.References
- L. B. Kong, Y. S. Shen and M. T. Wu, Study on sintering and gas sensing property of LaFeO3 ceramics, in Proceedings of the National 3rd Sensor Technology Conference, Beijing, China, 1993, vol. 15–18, pp. 129–131 Search PubMed.
- F. J. Berry, X. Ren, J. R. Gancedo and J. F. Marco, 57Fe Mössbauer Spectroscopy Study of LaFe1−xCoxO3 (x = 0 and 0.5) Formed by Mechanical Milling, Hyperfine Interact., 2004, 156, 335–340 CrossRef.
- S. Nakayama, LaFeO3 perovskite-type oxide prepared by oxide-mixing, co-precipitation and complex synthesis methods, J. Mater. Sci., 2001, 36, 5643–5648 CrossRef CAS.
- Q. Zhang and F. Saito, Effect of Fe2O3 crystallite size on its mechanochemical reaction with La2O3 to form LaFeO3, J. Mater. Sci., 2001, 36, 2287–2290 CrossRef CAS.
- E. M. Kostyukhin, A. L. Kustov and L. M. Kustov, One-step hydrothermal microwave-assisted synthesis of LaFeO3 nanoparticles, Ceram. Int., 2019, 45, 14384–14388 CrossRef CAS.
- W. J. Zheng, R. H. Liu and D. K. Peng, Mater. Lett., 2000, 43, 19–22 CrossRef CAS.
- S. Phokha, S. Pinitsoontorn, S. Rujirawat and S. Maensiri, Polymer pyrolysis synthesis and magnetic properties of LaFeO3 nanoparticles, Physica B, 2015, 476, 55–60 CrossRef CAS.
- M. Sivakumar, A. Gedanken, W. Zhong, Y. H. Jiang, Y. W. Du, I. Brukental, D. Bhattacharya, Y. Yeshurun and I. Nowik, Sonochemical synthesis of nanocrystalline LaFeO3, J. Mater. Chem., 2004, 14, 764–769 RSC.
- W. Azouzi, W. Sigle, H. Labrim and M. Benaissa, Mater. Sci. Semicond. Process., 2019, 104, 1046823 CrossRef.
- A. Benali, M. Bejar, E. Dhahri, M. Sajieddine, M. P. F. Graça and M. A. Valente, Magnetic, Raman and Mössbauer properties of double-doping LaFeO3 perovskite oxides, Mater. Chem. Phys., 2015, 149–150, 467–472 CrossRef CAS.
- I. Purnamasari, I. Farida, N. Nanang and A. Zhafirah, Crystal structure analysis of Lanthanum Orthoferrite doped Zirconium with sol–gel method for solar cell candidate, J. Phys.: Conf. Ser., 2021, 1869, 012197 CrossRef CAS.
- N. A. Sazelee, N. H. Idris, M. F. Md Din, M. S. Yahya, N. A. Ali and M. Ismail, LaFeO3 synthesised by solid-state method for enhanced sorption properties of MgH2, Results Phys., 2020, 16, 102844 CrossRef.
- S. Ahmadi, M. Mesbah, C. Adaobi Igwegbe, C. Daniel Ezeliora, C. Osagie, N. A. Khan, G. L. Dotto and M. Hadi Dehghani, Sono electro-chemical synthesis of LaFeO3 nanoparticles for the removal of fluoride: Optimization and modeling using RSM, ANN and GA tools, J. Environ. Chem. Eng., 2021, 9, 105320 CrossRef CAS.
- P. B. Koli, K. H. Kapadnis, U. G. Deshpande, B. P. More and U. J. Tupe, Mater. Sci. Res. India, 2020, 17, 70–82 CAS.
- C. Chen, K. B. Xu, Y. M. Cui and C. C. Wang, Polaronic relaxation in LaFeO3, Mater. Lett., 2012, 89, 153 CrossRef CAS.
- J. Mizusaki, T. Sasamo, W. R. Cannon and H. K. Bowen, Electronic Conductivity, Seebeck Coefficient, and Defect Structure of LaFeO3, J. Am. Ceram. Soc., 1982, 65, 363–368 CrossRef CAS.
- F. H. Taylor, J. Buckeridge, C. Richard and A. Catlow, Screening Divalent Metals for A- and B-Site Dopants in LaFeO3, Chem. Mater., 2017, 29, 8147–8157 CrossRef CAS.
- N. Karthikeyan, R. Ramesh Kumar, G. Jaiganesh and K. Sivakumar, Thermoelectric power factor of La0.9M0.1FeO3 (M = Ca and Ba) system: Structural, band gap and electrical transport evaluations, Physica B, 2018, 529, 1–8 CrossRef CAS.
- D. Triyono, I. Purnamasari and R. A. Rafsanjani, Effect of the Zr-Substitution on the Structural and Electrical Properties of LaFeO3: XRD, Raman Scattering, SEM, and Impedance Spectroscopy Study, Crystals, 2020, 10, 399 CrossRef CAS.
- C. Xueying, L. Shengli and Z. Xinde, Microstructure and electrical properties of La1−xSrxFeO3 (x = 0–0.6) film by a screen-printing method, Mater. Lett., 2014, 130, 267–270 CrossRef.
- E. Cao, Y. Qin, T. Cui, L. Sun, W. Hao and Y. Zhang, Influence of Na doping on the magnetic properties of LaFeO3 powders and dielectric properties of LaFeO3 ceramics prepared by citric sol–gel method, Ceram. Int., 2017, 43, 7922–7928 CrossRef CAS.
- L. Li, H. Qin, C. Shi, L. Zhang, Y. Chen and J. Hu, CO2 sensing properties of La1−xBaxFeO3 thick film and packed powder sensors, RSC Adv., 2015, 5, 103073–103081 RSC.
- C. Yao, J. Meng, X. Liu, X. Zhang, F. Meng, X. Wu and J. Meng, Effects of Bi doping on the microstructure, electrical and electrochemical properties of La2−xBixCu0.5Mn1.5O6 (x = 0, 0.1 and 0.2) perovskites as novel cathodes for solid oxide fuel cells, Electrochim. Acta, 2017, 229, 429–437 CrossRef CAS.
- J. Meng, X. Liu, C. Yao, X. Liu, X. Zhang, F. Meng and J. Meng, Bi-doped La2ZnMnO6−δ and relevant Bi-deficient compound as potential cathodes for intermediate temperature solid oxide fuel cells, Solid State Ionics, 2015, 279, 32–38 CrossRef CAS.
- E. M. Benali, A. Benali, M. Bejar, E. Dhahri, M. P. F. Graca, M. A. Valente and B. F. O. Costa, Effect of synthesis route on structural, morphological, Raman, dielectric, and electric properties of La0.8Ba0.1Bi0.1FeO3, J. Mater. Sci.: Mater. Electron., 2020, 31, 3197–3214 CrossRef CAS.
- E. M. Benali, A. Benali, M. Bejar, E. Dhahri, V. A. Khomchenko, L. Peng, J. Wu and B. F. O. Costa, Structural, morphological and excellent gas sensing properties of La1–2xBaxBixFeO3 (0.00 ≤ x ≤ 0.20) nanoparticles, J. Alloys Compd., 2021, 883, 160856 CrossRef CAS.
- N. S. Goncalves, J. A. Carvalho, Z. M. Lima and J. M. Sasaki, Size–strain study of NiO nanoparticles by X-ray powder diffraction line broadening, Mater. Lett., 2012, 72, 36–38 CrossRef CAS.
- I. S. Smirnova, Physica B, 1999, 262, 247–261 CrossRef CAS.
- R. Bergman, General Susceptibility Functions for Relaxations in Disordered Systems, J. Appl. Phys., 2000, 88, 1356–1365 CrossRef CAS.
- V. Thakur, A. Singh, A. M. Awasthi and L. Singh, Temperature dependent electrical transport characteristics of BaTiO3 modified lithium borate glasses, AIP Adv., 2015, 5, 087110 CrossRef.
- M. Ganguli, M. Harish Bhat and K. J. Rao, Lithium ion transport in Li2SO4–Li2O–B2O3 glasses, Phys. Chem. Glasses, 1999, 40, 297 CAS.
- A. K. Jonscher, Dielectric relaxation in solids, J. Phys. D: Appl. Phys., 1999, 32, 57–70 CrossRef.
- A. Kahouli, A. Sylvestre, F. Jomni, B. Yangui and J. Legrand, Experimental and Theoretical Study of AC Electrical Conduction Mechanisms of Semicrystalline Parylene C Thin Films, J. Phys. Chem. A, 2012, 116, 1051–1058 CrossRef CAS PubMed.
- L. Sangaletti, L. E. Depero, B. Allieri, P. Nunziante and E. Traversa, An X-ray study of the trimetallic LaxSm1−xFeO3 orthoferrites, J. Eur. Ceram. Soc., 2001, 21, 719 CrossRef CAS.
- H. M. Rietveld, A profile refinement method for nuclear and magnetic structures, J. Appl. Crystallogr., 1969, 2, 65–71 CrossRef CAS.
- J. Rodriguez-Carvajal, Recent advances in magnetic structure determination by neutron powder diffraction, Phys. B, 1993, 192, 55–69 CrossRef CAS.
- Q. Yao, C. Tian, Z. Lu, J. Wang, H. Zhou and G. Rao, Ceram. Int., 2020, 46, 20472–20476 CrossRef CAS.
- P. Song, H. Qin, L. Zhang, K. An, Z. Lin, J. Hu and M. Jiang, The structure, electrical and ethanol-sensing properties of La1−xPbxFeO3 perovskite ceramics with x ≤ 0.3, Sens. Actuators, B, 2005, 104, 312–316 CrossRef CAS.
- J. Feng, T. Liu, Y. Xu, J. Zhao and Y. He, Effects of PVA content on the synthesis of LaFeO3 via sol–gel route, Ceram. Int., 2011, 37, 1203–1207 CrossRef CAS.
- M. Romero, R. W. Gómez, V. Marquina, J. L. Pérez-Mazariego and R. Escamilla, Synthesis by molten salt method of the AFeO3 system (A = La, Gd) and its structural, vibrational and internal hyperfine magnetic field characterization, Physica B, 2014, 443, 90–94 CrossRef CAS.
- M. Scepanovic, M. Grujic-Brojcin, Z. Dohcevic-Mitrovic and Z. V. Popovic, Investigation of vibrational and electronic properties of oxide nanopowders by spectroscopic methods, J. Phys.: Conf. Ser., 2010, 253, 012015 CrossRef.
- P. Dhak, D. Dhak, M. Das, K. Pramanik and P. Pramanik, Impedance spectroscopy study of LaMnO3 modified BaTiO3 ceramics, J. Mater. Sci. Eng. B, 2009, 164, 165–171 CrossRef CAS.
- B. Bechera, P. Nayak and R. N. P. Choudhary, Impedance spectroscopy study of NaBa2V5O15 ceramic, J. Alloys Compd., 2007, 436, 226–232 CrossRef.
- S. Gowreesan and A. R. Kumar, Effects of Mg2+ ion substitution on the structural and electric studies of spinel structure of Co12xMgxFe2O4, J. Mater. Sci.: Mater. Electron., 2017, 28, 4553–4564 CrossRef CAS.
- S. B. Amor, A. Benali, M. Bejar, E. Dhahri, K. Khirouni, M. A. Valente, M. P. F. Graça, F. Al-Turjman, J. Rodriguez and A. Radwane, Modulation of magnetism and study of impedance and alternating current conductivity of Zn0.4Ni0.6Fe2O4 spinel ferrite, J. Mol. Struct., 2019, 1184, 298–304 CrossRef CAS.
- U. Hanifah and D. Triyono, AIP Conference Proceedings, Dielectric properties enhancement of Mg doped LaFeO3 perovskite materials at room temperature, 2020, vol. 2242, p. 020004 Search PubMed.
- B. Behera, P. Nayak and R. N. P. Choudhary, Structural and electrical properties of KCa2Nb5O15 ceramics, Cent. Eur. J. Phys., 2008, 6, 289 CAS.
- B. C. Sutar, R. N. P. Choudhary and P. R. Das, Dielectric and impedance spectroscopy of Sr(Bi0.5Nb0.5)O3 ceramics, Ceram. Int., 2014, 40, 7791–7798 CrossRef CAS.
- D. Johnson and Z. Plot, ZView Electrochemical Impedance Software, Version 2.3b, Scribner Associates Inc., Southern Pines, 2000 Search PubMed.
- A. Benali, M. Bejar, E. Dhahri, M. F. P. Graça and L. C. Costa, Electrical conductivity and ac dielectric properties of La0.8Ca0.2−xPbxFeO3 (x = 0.05, 0.10 and 0.15) perovskite com-pounds, J. Alloys Compd., 2015, 653, 506–512 CrossRef CAS.
- H. Issaoui, A. Benali, M. Bejar, E. Dhahri, B. F. O. Costa, M. P. F. Graca and M. A. Valente, RSC Adv., 2020, 10, 16132–16146 RSC.
- R. A. De Souza, J. Fleig, J. Maier, Z. Zhang, W. Sigle and M. Rühle, Electrical resistance of low-angle tilt grain boundaries in acceptor-doped SrTiO3 as a function of misorientation angle, J. Appl. Phys., 2005, 97, 053502 CrossRef.
- D. Triyono, S. N. Fitria and U. Hanifah, Dielectric analysis and electrical conduction mechanism of La1−xBixFeO3 ceramics, RSC Adv., 2020, 10, 18323–18338 RSC.
- O. Polat, M. Coskun, F. M. Coskun, B. Zengin, K. Durmus, Y. Caglar, M. Caglar and A. Turut, J. Alloys Compd., 2019, 787, 1212–1224 CrossRef CAS.
- K. Holderna-Natkaniec, M. O. M. Sghaier, P. Ławniczakc, M. Zdanowska-Fraczek, A. Wozniak-Braszak and S. Chaabouni, Electric properties and internal dynamics of the [C6H18N2] SbCl5 [C6H18N2] Cl2 in intermediate temperature phase (part II), Polyhedron, 2015, 85, 131–136 CrossRef CAS.
- A. K. Jonscher, Dielectric Relaxation in Solids, Chelsea Dielectric Press, London, 1983, vol. 658 Search PubMed.
- J. S. Kim, Electric Modulus Spectroscopy of Lithium Tetraborate (Li2B4O7) Single 660 Crystal, J. Phys. Soc. Jpn., 2001, 70, 3129–3133 CrossRef CAS.
- H. Felhi, R. Lahouli, M. Smari, H. Rahmouni, K. Khirouni and E. Dhahri, Study of the structural, electric and dielectric proprieties of Bi1−xNdxMn2O5 (x = 0, x = 0.1 and x = 0.2), J. Mol. Struct., 2019, 1179, 1–10 CrossRef CAS.
- A. Shukla and R. N. P. Choudhary, Study of aliovalent modification on dielectric and ac conductivity properties in lead titanate nanoceramics, J. Mater. Sci.: Mater. Electron., 2011, 22, 1222–1228 CrossRef CAS.
- R. S. Devan and B. K. Chougule, Effect of composition on coupled electric, magnetic, and dielectric properties of two-phase particulate magnetoelectric composite, J. Appl. Phys., 2007, 101, 014109 CrossRef.
- R. P. Mahajan, K. K. Patankar, M. B. Kothale and S. A. Patil, Conductivity, dielectric behavior and magnetoelectric effect in copper ferrite–barium titanate composites, Bull. Mater. Sci., 2000, 23, 273–279 CrossRef CAS.
- E. Barsoukov and J. Ross Macdonald, Impedance Spectroscopy Theory, Experiment and Applications, Wiley Interscience, New York, 2nd edn, 2005, pp. 14–41 Search PubMed.
- B. N. Parida, S. Behera, P. R. Das, R. Padhee and R. N. P. Choudhary, Structural, dielectric and electrical properties of a new tungsten bronze ferroelectric ceramics, J. Mater. Sci.: Mater. Electron., 2014, 25, 2618–2626 CrossRef CAS.
- J. T. Gudmundsson, H. G. Svavarsson, S. Gudjonsson and H. P. Gislason, Phys. B, 2003, 340, 324–328 CrossRef.
- M. Pollak, On the frequency dependence of conductivity in amorphous solids, Philos. Mag., 1971, 23, 519–542 CrossRef CAS.
- S. Mollah, K. K. Som, K. Bose and B. K. Chaudhuri, ac conductivity in Bi4Sr3Ca3CuyOx (y = 0–5) and Bi4Sr3Ca3−zLizCu4Ox (z = 0.1–1.0) semiconducting oxide glasses, J. Appl. Phys., 1993, 74, 931 CrossRef CAS.
- A. R. Long, Frequency-dependent loss in amorphous semiconductors, Adv. Phys., 1982, 31, 553–637 CrossRef CAS.
| This journal is © The Royal Society of Chemistry 2021 |

