 Open Access Article
Hierarchical NaFePO4 nanostructures in combination with an optimized carbon-based electrode to achieve advanced aqueous Na-ion supercapacitors†
Sudipta Biswas *a,
Debabrata Mandal
 b,
Trilok Singh
 c and
Amreesh Chandra
 abd
abd
aDepartment of Physics, Indian Institute of Technology Kharagpur, Kharagpur-721302, India. E-mail: sudiptabiswas@gmail.com; sbiswas@iitkgp.ac.in
bSchool of Nano Science and Technology, Indian Institute of Technology Kharagpur, Kharagpur-721302, India
cFunctional Materials and Device Laboratory, School of Energy Science & Engineering, Indian Institute of Technology Kharagpur, Kharagpur-721302, India
dSchool of Energy Science & Engineering, Indian Institute of Technology Kharagpur, Kharagpur-721302, India
First published on 8th September 2021
Abstract
Recent trends in sodium-ion-based energy storage devices have shown the potential use of hollow structures as an electrode material to improve the performance of these storage systems. It is shown that, in addition to the use of hierarchical structures, the choice of the complementary carbon electrode determines the final performance of Na-ion-based devices. Here, we present simple synthesis strategies to prepare different structured carbonaceous materials that can be upscaled to an industrial level. Individual carbon materials deliver specific capacitance ranges from 120 to 220 F g−1 at a current density of 1 A g−1 (with excellent capacity retention). These structures, when combined with hollow NaFePO4 microspheres to fabricate an aqueous supercapacitor, show as high as a 1.7 V working potential window and can deliver a maximum energy density of 25.29 W h kg−1 capacity retention. These values are much higher than those reported by NaFePO4 solid particles and randomly chosen carbon structure-based supercapacitors.
Introduction
Na-ions, with chemistry similar to Li-ions, were always expected to deliver characteristics that could be useful for storage technologies.1 Their limited use today is mostly linked with the difficulties associated with obtaining the single-phase Na-based materials, with high cycling stability.2,3 Over the last few years, there has been a steady growth in the expertise to stabilize Na-based systems, with simple morphologies and reasonable electrochemical performance.4 To date, particles with solid morphologies have been normally used in Na-ion supercapacitors. To bring a significant jump in the performance, hierarchical structures will now have to be investigated.5,6 Additionally, one should be mindful of the fact that Na+, with a larger ionic radius than Li+, will not combine with any randomly chosen anode. The complementary electrode must be such that it allows space for efficient ion intercalation and deintercalation. It has also been suggested that to obtain the desired performance from Na-ion storage devices, carbon-based electrodes will have to be carefully tuned.7One of the materials that is being investigated is NaFePO4 (NFP). The hope is that, NFP can deliver performance parameters like LiFePO4 (a famous material in Li-ion battery) and make Na-ion technology competitive with the other similar yet established systems. The formation of single-phase NaFePO4 and its use in Na-ion batteries have been reported over the last few years.8–11 Being a battery-type material, NaFePO4 has not been investigated much for supercapacitor application. The high-rate capability and structural stability of the olivine phosphates makes these structures useful for energy storage devices. There are many studies present in the literature that deal with conductive coating and metal ion doping to improve the performance.12 In the current work, the strategy of using morphology driven changes Na-ion supercapacitors was employed.
Many recent studies related to metal oxides suggesting the use of hierarchical nanostructures as a basic ingredient in the next generation supercapacitors.13,14 Therefore, it is now imperative that hierarchical structures are tested in Na-ion supercapacitors and batteries. This paper deals with the use of hierarchical NaFePO4 in Na-ion supercapacitors. Most studies in literature have remained focus on one combination of Na-based electrodes with a particular carbon-based electrode. Here, it is established that unless a proper combination with a suitable carbon structure-based electrode is determined, the device does not deliver the required characterization. Using a combination of NFP with activated carbon (AC), carbon microsphere (CMS), carbon nanosphere (CNS), graphene oxide (GO), reduced graphene oxide (rGO), graphene quantum dots, and nitrogen-doped graphene quantum dots, it is shown that NFP//rGO is the best option. Reasons are given to explain the properties of rGO, which helps it to supersede others. The studies clearly show that Na-ion supercapacitors can only become useful if the carbon-based negative electrode is carefully chosen. Further, for different Na-ion-based electrode materials, the desired carbon structures would be different.
Experimental
Material synthesis
AC was purchased from Merck Industries Pvt. Ltd. and used without any further modifications. CMS and CNS were synthesized by the hydrothermal method by controlling the precursor concentration and reaction time. For GO, a modified Hummer's method was used. Then these GOs were reduced with the help of the NaBH4 to obtain rGO. GQD was prepared by the pyrolysis technique utilizing citric acid and later it was nitrogen-doped by ammonia solution. Hollow NaFePO4 was synthesized by a one-pot hydrothermal facile route.15 Detailed synthesis procedures for obtaining materials used in this study are discussed in the ESI.†16,17Electrode preparation and characterization
Slurries were prepared using active material, polyvinylidene fluoride-co-hexafluoropropylene (PVDF) binder in acetone (for carbon structures), and N-methyl-2-pyrrolidone (for NaFePO4) as a mixing media. The ratio was 8![[thin space (1/6-em)]](https://www.rsc.org/images/entities/char_2009.gif) :
:![[thin space (1/6-em)]](https://www.rsc.org/images/entities/char_2009.gif) 1
1![[thin space (1/6-em)]](https://www.rsc.org/images/entities/char_2009.gif) :
:![[thin space (1/6-em)]](https://www.rsc.org/images/entities/char_2009.gif) 1 for active material, PVDF, and AC, respectively. The obtained slurries were drop casted onto the graphite sheets (with 1 cm × 1 cm) and vacuum dried at 80 °C for 12 h. All electrochemical measurements were performed using 2 M aqueous NaOH as an electrolyte.18 Current collecting graphite sheet coated with slurries containing the active materials was used. Platinum wire and Ag/AgCl (in 3.0 M KCl) were used as the counter and reference electrodes, respectively. CR2032 type asymmetric cells were fabricated using a Whatman glass fiber as the separator and the respective electrodes on either side. 3-electrode measurements were performed to optimize the electrochemical window of each electrode. The best performing electrolyte was also selected by the performance obtained from the 3-electrode measurements. After optimizing the electrodes, NFP and carbon electrodes were used the positive and negative electrodes, respectively, in a device.
1 for active material, PVDF, and AC, respectively. The obtained slurries were drop casted onto the graphite sheets (with 1 cm × 1 cm) and vacuum dried at 80 °C for 12 h. All electrochemical measurements were performed using 2 M aqueous NaOH as an electrolyte.18 Current collecting graphite sheet coated with slurries containing the active materials was used. Platinum wire and Ag/AgCl (in 3.0 M KCl) were used as the counter and reference electrodes, respectively. CR2032 type asymmetric cells were fabricated using a Whatman glass fiber as the separator and the respective electrodes on either side. 3-electrode measurements were performed to optimize the electrochemical window of each electrode. The best performing electrolyte was also selected by the performance obtained from the 3-electrode measurements. After optimizing the electrodes, NFP and carbon electrodes were used the positive and negative electrodes, respectively, in a device.
Result and discussion
Physiochemical results
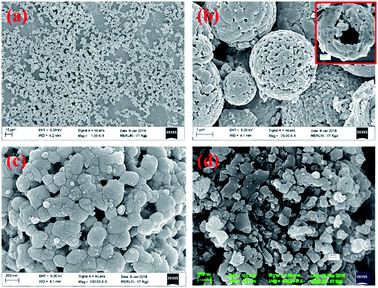
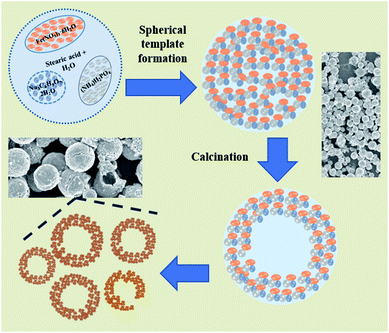
The X-ray diffraction pattern of NaFePO4 (NFP) could be indexed using the JCPDS card no. 04-012-9665, representing an orthorhombic unit cell with Pnmb space group as shown in Fig. S1(a).† Fig. 1(a–c) shows the SEM images of NFP, where a distinct hollow cavity is visible. The size of the synthesized NFP microspheres varied in the range of 1–3 μm. Corresponding TEM micrographs are shown in Fig. S1(b).† Such structures are known to have advantages of higher surface area, large pore size, and transport channels in comparison to their solid counterparts.19 The growth of these spherical particles is the resultant of reagent reaction and kinetically controlled diffusion (Scheme 1). The details are given in ESI.†To prove the advantage of hollow hierarchical structure, solid nanostructures were also synthesized using an auto combustion route. A typical solid disc-type morphology of NFP is shown in Fig. 1(d). The lattice parameters listed in Table 1, clearly showed that the two morphologies had similar dimensions. Therefore, any change in electrochemical performance would primarily originate from the change in the surface area.
| Parameter | a (Å) | b (Å) | c (Å) | Cell volume (Å3) |
|---|---|---|---|---|
| Hollow NFP | 7.67 | 8.76 | 5.12 | 343.84 |
| Solid NFP | 7.62 | 8.78 | 5.11 | 341.89 |
BET measurement showed that the surface area of hollow particles was 20.1 m2 g−1, with an average pore size of 6 nm (see Fig. S2†). In comparison, solid structures had a surface area of 6.1 m2 g−1, with an average pore size of 1.58 nm. The particle size was further confirmed by the SEM analysis, which indicated the average particle size was 1.527 μm (see Fig. S3(a)†). FTIR spectra of the sample also supported the presence of the [PO4]3− group in the material. This would provide stability to the structure (see Fig. S3(c and d)†).20 The atomic ratio of Na![[thin space (1/6-em)]](https://www.rsc.org/images/entities/char_2009.gif) :
:![[thin space (1/6-em)]](https://www.rsc.org/images/entities/char_2009.gif) Fe
Fe![[thin space (1/6-em)]](https://www.rsc.org/images/entities/char_2009.gif) :
:![[thin space (1/6-em)]](https://www.rsc.org/images/entities/char_2009.gif) P
P![[thin space (1/6-em)]](https://www.rsc.org/images/entities/char_2009.gif) :
:![[thin space (1/6-em)]](https://www.rsc.org/images/entities/char_2009.gif) O was found to be 1.05
O was found to be 1.05![[thin space (1/6-em)]](https://www.rsc.org/images/entities/char_2009.gif) :
:![[thin space (1/6-em)]](https://www.rsc.org/images/entities/char_2009.gif) 1
1![[thin space (1/6-em)]](https://www.rsc.org/images/entities/char_2009.gif) :
:![[thin space (1/6-em)]](https://www.rsc.org/images/entities/char_2009.gif) 1.08
1.08![[thin space (1/6-em)]](https://www.rsc.org/images/entities/char_2009.gif) :
:![[thin space (1/6-em)]](https://www.rsc.org/images/entities/char_2009.gif) 3.57 from the EDAX analysis, which confirmed the formation of NaFePO4 (see Fig. S4†). Further, the average zeta potential, obtained from the material dispersed in methanol, was −41 mV (see Fig. S3(b)†). This indicated that the NaFePO4 could be used as a promising positive electrode.
3.57 from the EDAX analysis, which confirmed the formation of NaFePO4 (see Fig. S4†). Further, the average zeta potential, obtained from the material dispersed in methanol, was −41 mV (see Fig. S3(b)†). This indicated that the NaFePO4 could be used as a promising positive electrode.
Fig. S5(a)† shows the X-ray diffraction pattern of all the carbon structures used during this work. The peak near 25° is the characteristic (002) plane of graphite.21 The broadness of the peak qualitatively showed the amorphous nature of the material. Phase purity and crystallinity of GO were also checked by XRD, where it exhibited a sharp peak near 10.52°, corresponding to the (001) basal plane with a d spacing of 0.422 nm.21 This is due to the presence of hydroxyl, epoxy and carbonyl groups are present in the GO structure.
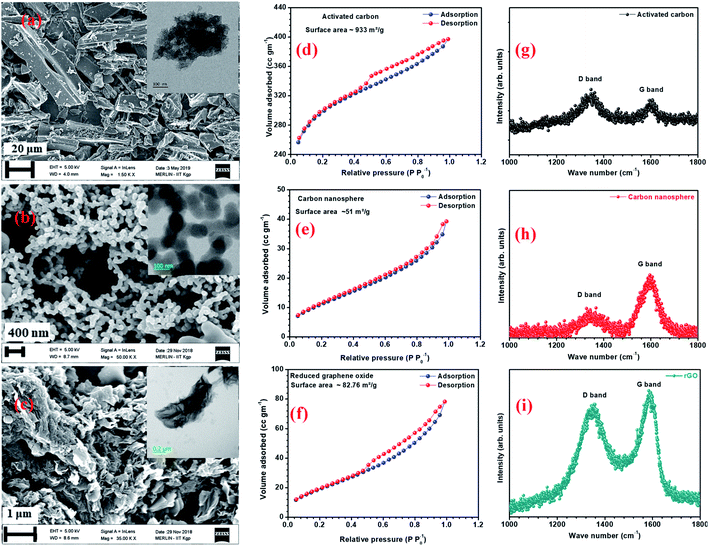
AC has a higher surface area due to surface modification and the availability of smaller pores.22 Fig. 2(a–c) and inset of Fig. 2(a–c) show the SEM and TEM micrographs of the different carbon structures. Fig. S6(a1, a2, b1 and b2)† show the SEM and TEM of other carbon structures. The micrographs showed that the flake-type structures remained the same, even after reduction. AFM images of the graphene quantum dots (GQDs) and nitrogen-doped graphene quantum dots (NGQDs) were taken on mica sheets and are shown in Fig. S6(a3 and a4).† AFM surface profiles showed that the GQDs were in the size range of 5–10 nm. TEM micrographs of GQD and NGQDs are shown in Fig. S6(b3 and b4).† The BET surface area isotherms for AC, CNS, rGO are shown in Fig. 2(d–f) and corresponding BET surface area isotherms for CMS, GO, GQD, nGQD are shown in Fig. S6(c1–c4).† AC and rGO showed type IV hysteresis isotherm, CMS and GO showed the type III isotherms, while CNS had type II like isotherm.23,24 The calculated surface areas for AC, CMS, CNS, GO, rGO were 933, 24, 51, 52, and 82 m2 g−1, respectively. Barrett–Joyner–Halenda (BJH) pore size distribution is shown in Fig. S5(b).†
The Raman spectra of AC, CNS and rGO are shown in Fig. 2(g–i) had two characteristic peaks viz., one near 1595 cm−1 (G peak), which is the characteristic scattering peak of graphite and the second peak at 1350 cm−1 (D peak), that is caused by lattice defects, disordered arrangement, and the low symmetry.25 The corresponding curves for CNS, GO, GQD and nGQD are shown in Fig. S6(d1–d4).† Particle size distribution for all the carbon structures are shown in Fig. S7.† The degree of graphitization can be calculated using the ratio of intensities of the D and G peaks. It is inversely proportional to the in-plane crystallite sizes (Lα) and is given by the Tuinstra–Koenig (TK) formula.26
where R is the degree of graphitization of different carbon materials, IG is the intensity of the G peak and ID is the intensity of the D peak. A small value of the R indicates higher graphitization. λ is the Raman excitation wavelength. The G-band represents the C–C vibrational mode of the sp2 hybridized carbon materials.27 The G band forms due to the in-plane vibration of the carbon atom in E2g symmetry.28 The small peak at 1575 cm−1 can be linked to the oxidation of the graphite structure. The formation of broad D peaks near 2455 cm−1 for GO pointed towards the stacking of GO and rGO flakes. The blue shift was observed in the G band of the rGO, in comparison to the GO flakes.29 The randomly stacked layers would promote the formation of a disordered array of multilayer GO and rGO. The formation of the multilayer GO and rGO were calculated by the intensity ratio of the G band and D band.30 The ratio of the peak intensity of D- and G bands was 0.98, which is a measure of the defects present in the layer.31 For GO and rGO, multilayer stacking was found to be 2 and 24, respectively.16 Table 2 shows the degree of graphitization for each of the carbon structures. Further, Raman spectra of nitrogen-doped graphene quantum dot showed the characteristic peak of D band (1346 cm−1) and G band (1596 cm−1). The ratio of the peak intensity of D- and G bands was 1.34. In the case of NGQDs, the ID/IG ratio was slightly higher. This can be attributed to the hetero atom doping. The FTIR analysis is shown and discussed in ESI (Fig. S8(a)†).
| Sample Name | AC | CMS | CNS | GO | rGO | GQDs | nGQDs |
|---|---|---|---|---|---|---|---|
| Degree of graphitization | 1.02 | 0.086 | 0.45 | 0.96 | 0.87 | 0.77 | 1.97 |
Electrochemical results
The electrochemical performances of all the electrodes were investigated using 2 M NaOH aqueous electrolyte in 3-electrode configuration. Before the electrochemical measurements, to ensure complete soaking, the electrodes were pre-dipped in the electrolyte (2 M NaOH) solution for 20 min. NaFePO4 was studied in the three-electrode in the potential window of −0.3 V to 0.5 V.32 The CV and CD for NaFePO4 are shown in Fig. 3(a and b). The specific capacitance of hollow NaFePO4 structures was 125 F g−1. In the charge–discharge study, these structures could deliver 142 F g−1 capacitance, at 1 A g−1 discharge current density. Variation of specific capacitance with scan rate and current density is shown in Fig. 3(d). The cycling stability test showed that the electrodes only lost 7% of the initial capacitance after 1500 cycles (Fig. 3(c)). This material showed higher performance than the other aqueous-based Na-ion electrode materials.33,34 As the scan rate increased to 150 mV s−1, the specific capacitance decreased to 40 F g−1. Therefore, the capacitance retention was only 29%. When the discharging current increased by 5-folds, 55% specific capacitance was retained. This can happen because, when the scan rate or discharge current increases, the material has less time for storage or transfer, leading to reduced performance. The charge transport kinetics of the electrode was studied by the analysis of electrochemical impedance spectroscopy (EIS). Nyquist plots also give information about electrode–electrolyte interactions and equivalent series resistance (ESR). The ESR value for the hollow microsphere was 0.78 Ω (Fig. S9†).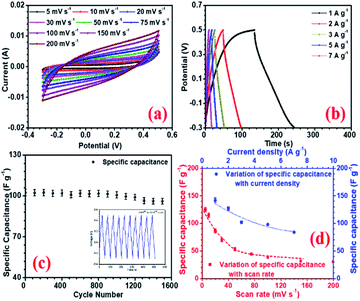 | ||
| Fig. 3 (a) CV profiles at different scan rates, (b) CD profiles at different current density, (c) capacity fade with scan rate and current density and (d) cycling stability of NaFePO4 in 2 M NaOH. | ||
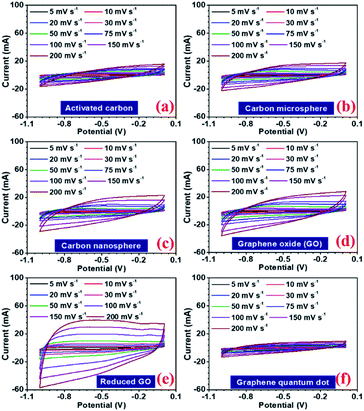
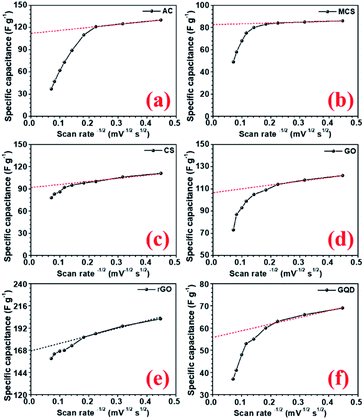
In a hybrid device, there are two types of electrochemical charge storage mechanisms, which must be considered viz., electric double layer capacitance (EDLC) and pseudocapacitance.35 The total storage capacity for an electrode is a convoluted picture of both these mechanisms, which are mainly controlled by (a) surface area, (b) porosity, (c) number of active sites, (d) presence of the functional group, and (e) availability of the redox-active sites in the electrode.36,37 In this study, all the carbon structures showed a stable voltage window of −1 to 0 V, as shown in Fig. 4(a–f). Maximum specific capacitance values obtained from the CV curves at 5 mV s−1, were 130, 86, 111, 122, 202, 69, and 77 F g−1 for AC, CMS, CNS, GO, rGO, GQD, and NGQD, respectively. The calculated specific capacitance, with increasing scan rates, is listed in Table 3.
| Scan rate (mV s−1) | Specific capacitance (F g−1) | ||||||
|---|---|---|---|---|---|---|---|
| AC | CMS | CNS | GO | rGO | GQD | NGQD | |
| 5 | 130 | 86 | 111 | 122 | 202 | 69 | 77 |
| 10 | 125 | 85 | 106 | 118 | 194 | 66 | 55 |
| 20 | 121 | 84 | 100 | 114 | 186 | 63 | 49 |
| 30 | 110 | 83 | 98 | 109 | 182 | 60 | 46 |
| 50 | 89 | 80 | 95 | 105 | 173 | 55 | 42 |
| 75 | 73 | 75 | 92 | 99 | 168 | 53 | 38 |
| 100 | 62 | 68 | 86 | 93 | 167 | 48 | 34 |
| 150 | 47 | 58 | 83 | 87 | 164 | 41 | 31 |
The specific capacitance values decrease with the increase in scan rate, which is a normal behaviour in supercapacitor electrode materials. As the scan rate increases, the electrodes have less time to exploit the voltage window. Hence, the charge storage capacity decreases. Additionally, the electrochemical kinetics of the electrostatic adsorption in EDLC is slower than that of the pseudocapacitive faradaic reactions.38 Consequently, the specific capacitance decreases as the material has less time to exchange charges i.e. faradaic reactions.39 The quantification curves for the carbon structures are shown in Fig. 5. This allowed the estimation of the pseudocapacitance contribution in the electrode. Most of the curves showed a plateau region, which signifies materials having EDL type storage behaviour. Capacity retention was 36, 67, 74, 71, 81, 20, and 40% for AC, CMS, CNS, GO, rGO, GQD and NGQD, respectively (calculated from CV profiles). It can be seen from the quantification curves that reduced GO had highest pseudocapacitive contribution, in comparison to the other carbon structures.
The AC showed lower capacity retention compared to others. Modifying the carbon to micro and nanostructured spheres improved capacity retention, but the specific capacitance values remained lower than that of rGO. The highest specific capacitance value of AC material can be attributed to the largest surface area.40 The higher capacitance retention for carbon nanostructure can be attributed to the higher zeta potential value.41 The zeta potential values for different carbon structures are shown in Fig. S8(b).† GO flakes also showed EDLC type storage, but the higher surface area and zeta potential make this structure useful for supercapacitor applications. In the case of rGO, there are additional oxygen functional groups present amongst which carboxyl and phenol groups actively participate in the faradaic redox reactions, when placed in the alkaline electrolyte with hydroxyl ions (OH−).42 Therefore, rGO can show both EDLC, as well as pseudocapacitance. This induced higher specific capacitance values, in comparison to other carbonaceous materials. The corresponding charge transfer equations can be written as follows:43
| −COOH + OH− ↔ −COO− + H2O + e− |
![[triple bond, length as m-dash]](https://www.rsc.org/images/entities/char_e002.gif) C–OH + OH− ↔ C–OH + OH− ↔ ![[double bond splayed left]](https://www.rsc.org/images/entities/char_e009.gif) C–O− + H2O + e− C–O− + H2O + e− |
The electrochemical performance of GQD and NGQD are shown in ESI.† The specific capacitance values determined from the charge–discharge profiles are listed in Table 4. The maximum specific capacitance was observed for rGO, which could deliver up to 220 F g−1 at 1 A g−1. Maximum specific capacitance for the AC, CMS, CNS, GO, GQD and NGQD were 124, 78, 110, 109, 70, and 73 F g−1, at 1 A g−1 current density. CD curves, variations in specific capacitance, as a function of increasing scan rate and current densities, are shown in Fig. S10–S12,† respectively. It was observed that, as the current density or scan rate increased, the specific capacitance decreased rapidly at first, and thereafter the rate slowed down. This behaviour also supports the hypothesis, which suggested the coexistence of EDLC and pseudocapacitance.
| Current density (A g−1) | Specific capacitance (F g−1) | ||||||
|---|---|---|---|---|---|---|---|
| AC | CMS | CNS | GO | rGO | GQD | nGQD | |
| 1 | 124 | 78 | 110 | 109 | 202 | 70 | 73 |
| 2 | 121 | 63 | 95 | 109 | 194 | 66 | 53 |
| 3 | 118 | 60 | 90 | 108 | 186 | 63 | 47 |
| 4 | 116 | 58 | 85 | 106 | 173 | 60 | 40 |
| 5 | 114 | 55 | 83 | 105 | 168 | 55 | 35 |
| 8 | 106 | 47 | 72 | 93 | 167 | 53 | 25 |
| 10 | 94 | 43 | 64 | 83 | 164 | 48 | 15 |
The performance of the carbon electrodes was also investigated by electrochemical impedance spectroscopy (EIS). Fig. S13† shows the EIS curve for the different carbon electrodes. rGO had the lowest electrochemical series resistance (ESR) value of 0.59 Ω. It also showed low charge transfer resistance, which again supports the increase in pseudocapacitance of the material.44 The ESR values, Warburg resistance and the charge transfer resistance are listed in Table S1.† GQD and NGQD showed a dominant EDLC type behaviour.
Following the 3-electrode performance of the electrodes, asymmetric hybrid devices were also fabricated. Fabrication of asymmetric supercapacitor device needs charge balancing of the electrode materials. The optimal charge balance condition was estimated using the mass balance formula:32
NaFePO4//AC showed stable performance in the 1.3 V voltage window. CV curves for all the devices fabricated using carbon structures (except NFP//rGO) are shown in Fig S15.† As the structures changed to CMS and CNS, the voltage window increased to 1.7 V. NFP//AC device could deliver 23 F g−1 specific capacitance at a 5 mV s−1 scan rate. So, shifting from microstructures of AC to spherical structures helped to achieve asymmetric supercapacitors with a higher voltage window. The highest specific capacitance observed in the NFP//CMS and NFP//CNS devices were 29 F g−1 and 39 F g−1, respectively, at 5 mV s−1.
Charge discharge results also corroborated the CV studies. CD curves, at increasing current densities, in devices with different carbon structures (except NFP//rGO), are shown in Fig S16.† NFP//AC could deliver up to 23 F g−1 specific capacitance at 1 A g−1 discharging current density. In comparison, NFP//CNS could deliver up to 32 F g−1 at 1 A g−1 current density. NFP//GO based asymmetric device delivered a maximum specific capacitance of 44 F g−1 and 40 F g−1 at 5 mV s−1 scan rate and 1 A g−1 current density, respectively. Higher specific capacitance can be attributed to the layered structures of the GO, where it can accommodate more Na-ions in the bulk of the material and provides a greater number of channels for the ions to interact with material and store charge. The electrochemical results for n-GQD are shown in Fig. S14.†
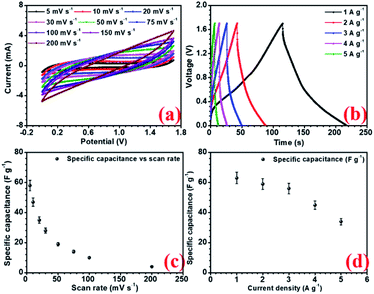
Amongst all the asymmetric device configurations, the NFP//rGO combination gave the best results. Corresponding CV and CD curves at increasing scan rate and current density are shown in Fig. (6a and b). Here the device could deliver up to 58 F g−1 and 63 F g−1 specific capacitance at 5 mV s−1 scan rate and 1 A g−1 current density, respectively, without compromising the voltage window, which has been found to be 1.7 V. rGO provided improved EDLC nature owing to higher surface area and positive higher zeta potential value, which enhances the charge storage.
Again, the layered structures of the rGO can accommodate a higher amount of Na+ ions on the surface as well as in the interior of the layered structures. So, compared to the other carbon structures with simpler morphologies, layered rGO can suitably combine with the NFP electrode and provide the required performance to achieve a well-performing device with high charge storage. This device can compete well with some of the suggested Na-ion or metal oxide-based supercapacitors, as shown in Table 5. GQD and NGQD showed reduced performance as they could show only 25 and 30 F g−1 specific capacitance in device configuration with NaFePO4. The electrochemical impedance spectroscopy (EIS) was investigated within a frequency range of 50 mHz to 1 MHz. The corresponding results are shown in SI (Fig. S14†). Among the carbon structures, the NFP//rGO device showed low ESR (Rs) and the lowest charge transfer resistance (Rct) at the electrode–electrolyte interface (EEI). Low Rct signifies that NFP//rGO had low resistance, and rGO facilitates solvated Na+ ions to intercalation into the interlayer spacing while ensuring efficient charge transfer from the electrolyte to the bulk of the material. NFP//rGO based asymmetric device also had the lowest ESR values (Table 5).
| Material | 3 electrode CV | 3 electrode CD | 2 electrode CV with NFP | 2 electrode CD with NFP | ESR value of the device | Rct values of the device |
|---|---|---|---|---|---|---|
| AC | 130 | 124 | 23 | 23 | 2.43 | 15.53 |
| Micro sphere | 86 | 78 | 29 | 23 | 1.45 | 7.72 |
| Nano sphere | 111 | 110 | 39 | 32 | 1.06 | 7.02 |
| GQD | 69 | 70 | 24 | 25 | 1.43 | 6.17 |
| NGQD | 77 | 73 | 34 | 30 | 1.89 | 6.62 |
| GO | 122 | 109 | 44 | 40 | 2.1 | 5.54 |
| rGO | 202 | 180 | 58 | 63 | 3.56 | 5.42 |
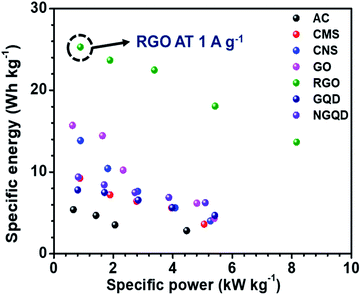
The ESR and charge transfer resistance values for all the combinations are shown in Table 5. The Ragone plot for the different combinations is shown in Fig. S17.† The highest energy density was achieved by the NaFePO4//rGO device and the value was 25.29 W h kg−1 and power density was 0.894 kW kg−1 (Table 6). The comparison of power density and energy density for all the device configurations are listed in Table S4† (Fig. 7).
| Work | Energy density (W h kg−1) | Reference |
|---|---|---|
| NaMnO2//AC | 19.5 | 33 |
| NaMnO2//AC | 28.56 | 45 |
| Na0.21MnO2//AC | 31.8 | 46 |
| NaMnPO4//AC | 10.7 | 47 |
| CuO//AC | 19.7 | 48 |
| RuO2//rGO | 26.3 | 49 |
| MnO2//Graphene | 6.8 | 50 |
| Na2Ti2O5−x//rGO-AC film | 15.6 | 51 |
| NaMn1/3Ni1/3Co1/3PO4//AC | 15 | 52 |
| NaMn1/3Ni1/3Co1/3PO4//AC | 50 | 53 |
| NaFePO4//rGO | 25.29 | This work |
To investigate the performance of the supercapacitor cycling stability of the electrode and the devices were also tested. All carbon-based electrodes were subjected to a cycling stability test for 2000 cycles and the corresponding results, for different electrodes are, presented in Fig. 8. rGO electrodes showed 94% capacity retention after 2000 cycle with the highest specific capacitance. The device with hollow NaFePO4//rGO showed 87% capacity after 2000 cycles.
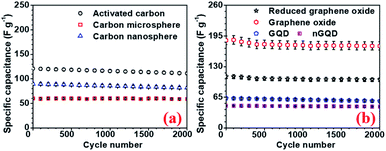 | ||
| Fig. 8 Cycling stability test for (a) AC, CMS, CNS and (b) GO, rGO, GQD, nGQ electrodes, respectively. | ||
Conclusions
Hollow NaFePO4 structures, with various carbon structures, can be utilized to fabricate Na-ion supercapacitors. Carbon structures (1-, 2-, 3-D types) are tested as negative electrodes in the device. Different combinations lead to varied performance, which indicates that the choice of complementary carbon electrodes is critical in Na-ion-based storage technologies. Reduced GO showed the best performance in devices with NFP structures. NaFePO4//rGO combination can deliver specific capacitance 63 F g−1 at 1 A g−1 current density, which is nearly three times higher than the NFP//AC based device. The device also retained 87% cycling stability after 2000 cycles of charge–discharge. An optimized device can deliver energy and power density values, which can make Na-ion supercapacitors a competitive technology with good cycling stability.Conflicts of interest
There are no conflicts to declare.Acknowledgements
The authors acknowledge the central research facility, Indian Institute of Technology Kharagpur for the all support for acquiring experimental data. (AC) would like to acknowledge DST (India) for supporting the establishment of experimental facilities under its Materials for Energy Storage (MES) scheme for the project entitled, “Hierarchically nanostructured energy materials for next generation Na-ion based energy storage technologies and their use in renewable energy systems”.Notes and references
- J. Nai and X. W. D. Lou, Adv. Mater., 2019, 31, e1706825 CrossRef PubMed.
- M. Minakshi and D. Meyrick, J. Alloys Compd., 2013, 555, 10–15 CrossRef CAS.
- V. Aravindan, M. Ulaganathan and S. Madhavi, J. Mater. Chem. A, 2016, 4, 7538–7548 RSC.
- Y. Yuan, C. Wang, K. Lei, H. Li, F. Li and J. Chen, ACS Cent. Sci., 2018, 4, 1261–1265 CrossRef CAS PubMed.
- S. Biswas, V. Sharma, T. Singh and A. Chandra, J. Mater. Chem. A, 2021, 9, 6460–6468 RSC.
- D. Mandal, S. Biswas, A. Chowdhury, D. De, C. S. Tiwary, A. N. Gupta, T. Singh and A. Chandra, Nanotechnology, 2021, 32, 025504 CrossRef CAS PubMed.
- X. Li, Y. Chen, H. Huang, Y.-W. Mai and L. Zhou, Energy storage materials, 2016, 5, 58–92 CrossRef.
- M. Galceran, V. Roddatis, F. J. Zúñiga, J. M. Pérez-Mato, B. Acebedo, R. Arenal, I. Peral, T. Rojo and M. Casas-Cabanas, Chem. Mater., 2014, 26, 3289–3294 CrossRef CAS.
- M. R. Bonilla, A. Lozano, B. Escribano, J. Carrasco and E. Akhmatskaya, J. Phys. Chem. C, 2018, 122, 8065–8075 CrossRef CAS.
- W. Tang, X. Song, Y. Du, C. Peng, M. Lin, S. Xi, B. Tian, J. Zheng, Y. Wu, F. Pan and K. P. Loh, J. Mater. Chem. A, 2016, 4, 4882–4892 RSC.
- K. T. Lee, T. N. Ramesh, F. Nan, G. Botton and L. F. Nazar, Chem. Mater., 2011, 23, 3593–3600 CrossRef CAS.
- S. Kandhasamy, K. Nallathamby and M. Minakshi, Prog. Solid. State Ch., 2012, 40, 1–5 CrossRef CAS.
- C. Kanade, S. Arbuj, K. Kanade, K. S. Kim, G. Y. Yeom, T. Kim and B. Kale, RSC Adv., 2018, 8, 39749–39755 RSC.
- A. Chandra, A. J. Roberts and R. C. T. Slade, Solid State Commun., 2008, 147, 83–87 CrossRef CAS.
- S. Biswas, V. Sharma, D. Mandal, A. Chowdhury, M. Chakravarty, S. Priya, C. C. Gowda, P. De, I. Singh and A. Chandra, CrystEngComm, 2020, 22, 1633–1644 RSC.
- S. Ghosh, D. Mandal, A. Chandra and S. N. B. Bhaktha, J. Light. Technol., 2019, 37, 2380–2385 CAS.
- D. De, C. K. Das, D. Mandal, M. Mandal, N. Pawar, A. Chandra and A. N. Gupta, ACS Appl. Bio Mater., 2020, 3, 6284–6296 CrossRef CAS.
- A. Chowdhury, A. Dhar, S. Biswas, V. Sharma, P. S. Burada and A. Chandra, J. Phys. Chem. C, 2020, 124, 26613–26624 CrossRef CAS.
- R. Heimbockel, F. Hoffmann and M. Froba, Phys. Chem. Chem. Phys., 2019, 21, 3122–3133 RSC.
- C. Murugesan, S. Lochab, B. Senthilkumar and P. Barpanda, ChemCatChem, 2018, 10, 1122–1127 CrossRef CAS.
- X. Jiao, Y. Qiu, L. Zhang and X. Zhang, RSC Adv., 2017, 7, 52337–52344 RSC.
- D. Bergna, T. Varila, H. Romar and U. Lassi, C, 2018, 4, 41 Search PubMed.
- H. Li, L. Sun, Y. Zhang, T. Tan, G. Wang and Z. Bakenov, J. Energy Chem., 2017, 26, 1276–1281 CrossRef.
- R. Liu, T. Gong, K. Zhang and C. Lee, Sci. Rep., 2017, 7, 9761 CrossRef PubMed.
- J. B. Wu, M. L. Lin, X. Cong, H. N. Liu and P. H. Tan, Chem. Soc. Rev., 2018, 47, 1822–1873 RSC.
- P. Mallet-Ladeira, P. Puech, C. Toulouse, M. Cazayous, N. Ratel-Ramond, P. Weisbecker, G. L. Vignoles and M. Monthioux, Carbon, 2014, 80, 629–639 CrossRef CAS.
- F. Negri, E. di Donato, M. Tommasini, C. Castiglioni, G. Zerbi and K. Mullen, J. Chem. Phys., 2004, 120, 11889–11900 CrossRef CAS PubMed.
- J. H. Kaufman, S. Metin and D. D. Saperstein, Phys. Rev. B. Condens. Matter., 1989, 39, 13053–13060 CrossRef CAS PubMed.
- K. Tsirka, A. Katsiki, N. Chalmpes, D. Gournis and A. S. Paipetis, Front. Mater., 2018, 5, 37 CrossRef.
- S. Pei and H.-M. Cheng, Carbon, 2012, 50, 3210–3228 CrossRef CAS.
- A. Dey, S. Krishnamurthy, J. Bowen, D. Nordlund, M. Meyyappan and R. P. Gandhiraman, ACS Nano, 2018, 12, 5473–5481 CrossRef CAS PubMed.
- S. Biswas, A. Chowdhury and A. Chandra, Front. Mater., 2019, 6, 54 CrossRef.
- Q. T. Qu, Y. Shi, S. Tian, Y. H. Chen, Y. P. Wu and R. Holze, J. Power Sources, 2009, 194, 1222–1225 CrossRef CAS.
- B. Senthilkumar, K. V. Sankar, L. Vasylechko, Y.-S. Lee and R. K. Selvan, RSC Adv., 2014, 4, 53192–53200 RSC.
- Poonam, K. Sharma, A. Arora and S. K. Tripathi, J. Energy Storage, 2019, 21, 801–825 CrossRef.
- C. Zheng, X. F. Zhou, H. L. Cao, G. H. Wang and Z. P. Liu, J. Mater. Chem. A, 2014, 2, 7484 RSC.
- M. A. Akhtar, A. Chowdhury and A. Chandra, J. Phys. D Appl. Phys., 2019, 52, 155501 CrossRef.
- J.-S. M. Lee, M. E. Briggs, C.-C. Hu and A. I. Cooper, Nano Energy, 2018, 46, 277–289 CrossRef CAS.
- S. N. Khatavkar and S. D. Sartale, New J. Chem., 2020, 44, 6778–6790 RSC.
- O. Barbieri, M. Hahn, A. Herzog and R. Kötz, Carbon, 2005, 43, 1303–1310 CrossRef CAS.
- Z. Lei, Z. Liu, H. Wang, X. Sun, L. Lu and X. S. Zhao, J. Mater. Chem. A, 2013, 1, 2313 RSC.
- N. H. Khdary, M. E. Abdesalam and G. El Enany, J. Electrochem. Soc., 2014, 161, G63–G68 CrossRef CAS.
- Q. Li, M. Horn, Y. Wang, J. MacLeod, N. Motta and J. Liu, Materials, 2019, 12 Search PubMed.
- M. R. Hasyim and R. Rajagopalan, J. Electrochem. Soc., 2020, 167, 013536 CrossRef.
- S. Xu, T. Wan, K.-b. Zhou, G.-m. Zhu, Z.-q. He, H.-b. Huang, T. Zhou, W.-q. Mao, J.-j. Wu, S.-k. Gong and Y.-x. Qiao, Mater. Res. Express, 2020, 7, 035508 CrossRef CAS.
- N. Karikalan, C. Karuppiah, S. M. Chen, M. Velmurugan and P. Gnanaprakasam, Chemistry, 2017, 23, 2379–2386 CrossRef CAS PubMed.
- A. Chowdhury, S. Biswas, T. Singh and A. Chandra, Electrochem. Sci. Adv., 2021, e2100030 Search PubMed.
- S. E. Moosavifard, M. F. El-Kady, M. S. Rahmanifar, R. B. Kaner and M. F. Mousavi, ACS Appl. Mater. Interfaces, 2015, 7, 4851–4860 CrossRef CAS PubMed.
- J. T. Zhang, J. W. Jiang, H. L. Li and X. S. Zhao, Energy Environ. Sci., 2011, 4, 4009–4015 RSC.
- Y. He, W. Chen, X. Li, Z. Zhang, J. Fu, C. Zhao and E. Xie, ACS Nano, 2013, 7, 174–182 CrossRef CAS PubMed.
- L.-F. Que, F.-D. Yu, K.-W. He, Z.-B. Wang and D.-M. Gu, Chem. Mater., 2017, 29, 9133–9141 CrossRef CAS.
- M. Minakshi, D. Meyrick and D. Appadoo, Energy Fuels, 2013, 27, 3516–3522 CrossRef CAS.
- M. M. Sundaram, T. Watcharatharapong, S. Chakraborty, R. Ahuja, S. Duraisamy, P. T. Rao and N. Munichandraiah, Dalton Trans., 2015, 44, 20108–20120 RSC.
Footnote |
| † Electronic supplementary information (ESI) available. See DOI: 10.1039/d1ra05474k |
| This journal is © The Royal Society of Chemistry 2021 |

