 Open Access Article
Eco-benign PVA/aluminum phosphate as an alternative to formaldehyde-based adhesives in wood-based panels†
Zhenzeng Wu *a,
Tingjie Chenb,
John Tosin Aladejanac,
Zhutao Zhanga,
Shengwei Lianga,
Yuanjiao Xiaoa,
Jiahui Lina,
Xiaodong(Alice) Wangd and
Yongqun Xie*c
aThe College of Ecology and Resource Engineering, Wuyi University, No. 16, Wuyi Avenue, Wuyishan City, Fujian 354300, P. R. China. E-mail: zhenzeng.wu@wuyiu.edu.cn
bThe College of Materials Science and Engineering, Fujian University of Technology, Fuzhou, Fujian 350002, P. R. China
cThe College of Material Engineering, Fujian Agriculture and Forestry University, 15 Shangxiadian Road, Fuzhou, Fujian 350002, P.R. China. E-mail: fjxieyq@hotmail.com; Tel: +86 591 83789307
dThe Department of Wood and Forest Sciences, Laval University, Quebec G1V 0A6, Canada
First published on 25th October 2021
Abstract
Aluminum phosphate (AP) shows great potential to replace formaldehyde-based adhesives in the wood industry, except for its weak hygroscopic resistance and low wet bonding strength. This study chose PVA as an AP modifier to prepare a PVA–AP organic–inorganic hybrid adhesive (PAP). The preparation, bonding mechanism and heat resistant property of PAP were studied by using X-ray photoelectron spectroscopy (XPS), Fourier transforms infrared spectroscopy (FTIR), X-ray diffraction (XRD), thermogravimetry-differential scanning calorimetry (TG-DSC), nuclear magnetic resonance (NMR) and scanning electron microscopy (SEM). The result showed that covalent bonds between PVA and AP were built. The mechanical properties of PAP improved remarkably; the dry and wet bonding strength are 2.28 and 0.79 MPa with 15.2% and 690% increment, respectively, compared to the control samples. The thermostabilities of PAP and plywood samples were improved. In conclusion, PVA could effectively improve the hygroscopic resistance and low wet bonding strength of AP adhesives.
1. Introduction
Indoor air pollution from formaldehyde-based adhesives has attracted extensive attention because of their adverse health effects.1 Nowadays, “green” or biomaterials are considered for the interior walls of buildings due to their environmental sustainability and carbon impact,2,3 Using wood and wood-based products is considered to be more sustainable compared to concretes and steels. Adhesives used in wood-based board manufacturing play a key role in determining the bond quality and mechanical strength.4 Aluminum phosphate (AP) materials have been used as binders for about 60 years.5 They exhibited outstanding properties such as simple preparation technology, low-cost production, slight curing shrinkage, short production cycle, high-temperature resistance, abrasion resistance and excellent bonding strength.6–8 Phosphoric acid undergoes three ionization steps associated with the three phosphate ions; namely, H2PO4−, HPO42− and PO43−, and they are known as ligands of monodentate, chelating or bridging forms.9 The strengthening of the binder is due to the chemical bonding of phosphate phases and a change in the stress state.10 AP binder has been used for various purposes such as coatings,11,12 adhesives,13 anti-freeze and paints.14 However, incompletely cured samples were found to be chemically unstable with respect to rehydration in air.15 Water molecules were absorbed and formed hydrogen-bonds between two phosphates due to the wet interface layer and weak hygroscopic resistance.16 Additionally, during the hot water dipping treatment, the moisture could penetrate the glue interface and the bonding between the fiber and the AP interface could be broken, thereby weakening the wet bonding strength.Many methods have been explored to overcome these problems. Titanium dioxide and alkylsilane were used to modify the AP, with the inorganic adhesive possessing robust, self-healing and superhydrophobic surfaces.12 Magnesium as a modifier was added to avoid the strength decrease of wood composites under the high humidity condition.17 Si and B4C as the inorganic fillers were added to the formation of borosilicate glass.8 CrO3 was added into aluminum phosphate binder, which could achieve excellent rehydration resistance with low thermal conductivity.9,18 AlN, NH4F, MgO and ZrO2 were added to AP, lowered the hardening-temperature, and improved rehydration resistance.7,19 However, most of these techniques require high-temperature treatment (over 200 °C) and long curing time (1–5 hours), in some cases, inert atmosphere protection, thus reducing the process feasibility.18,20 And the use of chromium as a cancer-suspect agent is limited in industrial applications due to potential environmental pollution. These chemical agents are not suitable for wood-based boards. Organic–inorganic hybrids combine the desirable properties of the inorganic phase (thermal stability, and strength) with organic phase (flexibility, processability, and ductility).21 There are varieties of applications, including catalysis,22 adsorption,23 pervaporation,24 sensors,25 and enzyme encapsulation.26 Polyvinyl alcohol (PVA) is the most favorite organic phase material for manufacturing organic–inorganic hybrids.27,28 It has excellent properties such as superior water solubility, good film-forming ability, high strength and biocompatibility.28–31 PVA is non-toxic, non-carcinogenic, showing similar characteristics to bio-adhesives; it is most commonly used in areas such as membranes,32 adhesives,33 paints, and coatings.31
Bonding wood-based materials using PVA/aluminum phosphate (PAP) organic–inorganic hybrid adhesive has not been reported. The knowledge of PAP would be useful in developing new eco-friendly wood composites. In this study, PVA was chosen as a modifier for aluminum phosphate for preparing the organic–inorganic hybrid adhesive in order to overcome its weak hygroscopic resistance and low wet bonding strengthen. The investigation was carried out on the preparation, bonding mechanism and heat resistant property using X-ray photoelectron spectroscopy (XPS), Fourier transform infrared spectroscopy (FTIR), X-ray diffraction (XRD), Thermogravimetry-Differential Scanning Calorimetry (TG-DSC), nuclear magnetic resonance (NMR) and Scanning Electron Microscope (SEM). Also, the bonding strength was evaluated by measuring the shear strength of fabricated plywood samples.
2. Materials and methods
2.1 Materials
Masson pine veneers and fiber (∼10% moisture content, Fujian Furen Wood Industry Co., Ltd, Fuzhou, China) were used to prepare three layers of plywood. Al(OH)3, H3PO4 (concentration of 85%) and ferric oxide (Fe2O3) were purchased from Tianjin Zhiyuan Chemical Reagents Factory (Tianjin, China). PVA-1799 (44.5 MW) were bought from Shanghai Aladdin Bio-Chem Technology Co., Ltd. Urea was bought from Shanghai Jiuyi Chemical Reagent Co. Ltd. Tributyl phosphate was received from Sinopharm Chemical Reagent Co. Ltd.2.2 Methods
![[thin space (1/6-em)]](https://www.rsc.org/images/entities/char_2009.gif) :
:![[thin space (1/6-em)]](https://www.rsc.org/images/entities/char_2009.gif) 100, 1.5
100, 1.5![[thin space (1/6-em)]](https://www.rsc.org/images/entities/char_2009.gif) :
:![[thin space (1/6-em)]](https://www.rsc.org/images/entities/char_2009.gif) 100, 2
100, 2![[thin space (1/6-em)]](https://www.rsc.org/images/entities/char_2009.gif) :
:![[thin space (1/6-em)]](https://www.rsc.org/images/entities/char_2009.gif) 100, 2.5
100, 2.5![[thin space (1/6-em)]](https://www.rsc.org/images/entities/char_2009.gif) :
:![[thin space (1/6-em)]](https://www.rsc.org/images/entities/char_2009.gif) 100, 3.0
100, 3.0![[thin space (1/6-em)]](https://www.rsc.org/images/entities/char_2009.gif) :
:![[thin space (1/6-em)]](https://www.rsc.org/images/entities/char_2009.gif) 100, and 3.5
100, and 3.5![[thin space (1/6-em)]](https://www.rsc.org/images/entities/char_2009.gif) :
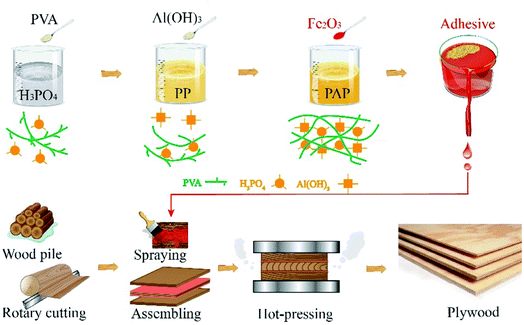
:![[thin space (1/6-em)]](https://www.rsc.org/images/entities/char_2009.gif) 100]. The PVA/APs with the different ratios were referred to as PAP-1.0, PAP-1.5, PAP-2.0, PAP-2.5, PAP-3.0, PAP-3.5, respectively. The PAPs were cooled at room temperature, after which they were mixed with Fe2O3 (curing agent, 1.5% of total adhesive weight). The mixtures were used to prepare PAP plywood (PAPW), coating each veneer layer with 200g m−2 of the adhesives. The hot-pressing temperature, pressure, and time are 160 °C, 1.0 MPa, and 5 min, respectively. Details are shown in Fig. 1.
100]. The PVA/APs with the different ratios were referred to as PAP-1.0, PAP-1.5, PAP-2.0, PAP-2.5, PAP-3.0, PAP-3.5, respectively. The PAPs were cooled at room temperature, after which they were mixed with Fe2O3 (curing agent, 1.5% of total adhesive weight). The mixtures were used to prepare PAP plywood (PAPW), coating each veneer layer with 200g m−2 of the adhesives. The hot-pressing temperature, pressure, and time are 160 °C, 1.0 MPa, and 5 min, respectively. Details are shown in Fig. 1.
3. Results and discussion
3.1 Rheological and chemical property of PAP
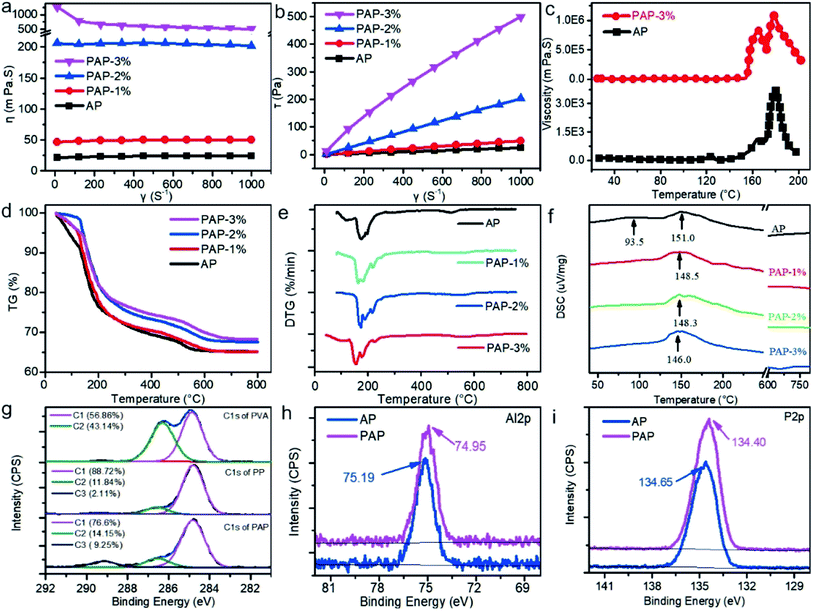
The digital images of AP and PAP are shown in Fig. S1,† and the different proportions of PVA. The adhesives color became darker, which indicates that the degree of esterification between PVA and H3PO4 was enhanced. In order to investigate the rheological properties of PAPs with different proportions of PVAs, the viscosity and sheering strength were tested, and the results are showed in Fig. 2(a)–(c).As could be seen in Fig. 2(a), with the increase of velocity gradient (γ), the viscosity (η) of AP, PAP-1% and PAP-2% almost remain constant, with an average value of 24, 50, and 205 mPa s, respectively, which indicates that the η increases as the various proportion of PVA were added. In Fig. 2(b), the shearing stress (τ) increased with the velocity gradient, which means it could be modelled with the equation eqn (1).
| τ = ηγ | (1) |
| η = Kγn−1 | (2) |
![[thin space (1/6-em)]](https://www.rsc.org/images/entities/char_2009.gif) <
<![[thin space (1/6-em)]](https://www.rsc.org/images/entities/char_2009.gif) n
n ![[thin space (1/6-em)]](https://www.rsc.org/images/entities/char_2009.gif) <
< ![[thin space (1/6-em)]](https://www.rsc.org/images/entities/char_2009.gif) 1. Under velocity gradient conditions at 10γ s−1 and 25–200 °C, the viscosity of AP and PAP-3 are shown in Fig. 2(c). The peak of AP showed in Fig. 2(c) is the reason why oligomers of aluminophosphates condensed to form orbicular structures and then break to form catenulate structures at this temperature range.13,34 A sharp peak appeared around 165 °C on the PAP-3% curve in Fig. 2(c). The PVA chains hooked, intertwined, and interlocked each other with the temperature, which increased the viscosity of PAP-3%. When the system temperature continues to go up, the internal energy gradually increases, and the molecular thermal motion becomes active, which expands the molecular spacing, free volume, and decreases viscosity. A similar peak found in PAP-3% could also be seen in AP curve around 180 °C. That was the reason for the interconnection between PVA and AP.
1. Under velocity gradient conditions at 10γ s−1 and 25–200 °C, the viscosity of AP and PAP-3 are shown in Fig. 2(c). The peak of AP showed in Fig. 2(c) is the reason why oligomers of aluminophosphates condensed to form orbicular structures and then break to form catenulate structures at this temperature range.13,34 A sharp peak appeared around 165 °C on the PAP-3% curve in Fig. 2(c). The PVA chains hooked, intertwined, and interlocked each other with the temperature, which increased the viscosity of PAP-3%. When the system temperature continues to go up, the internal energy gradually increases, and the molecular thermal motion becomes active, which expands the molecular spacing, free volume, and decreases viscosity. A similar peak found in PAP-3% could also be seen in AP curve around 180 °C. That was the reason for the interconnection between PVA and AP.
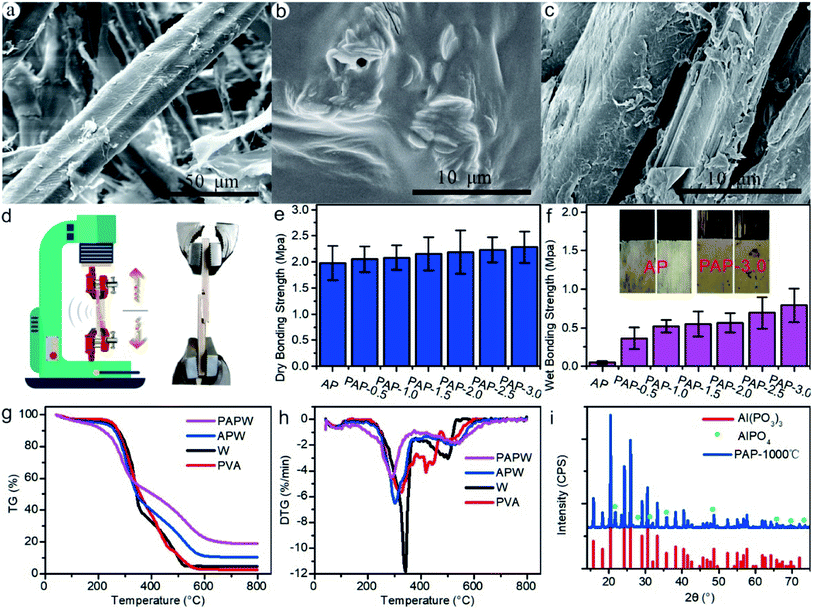
The thermostability of PAP was tested. The TG and DTG curves are presented in Fig. 2(d) and (e). As can be seen in the graphs, AP and PAP samples experience four stages of thermal decomposition. In the first stage, from room temperature (RT) to onset temperature (OT, shown in Table S4†), the mass loss refers to the evaporation of physically adsorbed water in the samples. At the second stage, from OT to 290 °C, the mass loss was resulted from the thermal decomposition of the aluminium dihydrogen phosphate into aluminum oxide, phosphorus pentoxide and water. In the third stage, from 290 to 505 °C, the decomposers in the previous stage reacted to form AlH3P3O10 and released the same vapor. In the final stage (i.e. between 505 to 800 °C), the AlH3P3O10 decomposed to form Al(PO3)3 and AlPO4 (XRD profile of PAP after 1000 °C calcination is presented in Fig. 5(i)). As shown in Fig. 2(e) and Table S4,† compared to AP, the OT, first peak temperature of thermal decomposition (PT1), the second peak temperature of thermal decomposition (PT2) and the ratio of residual weight (RW) of PAP-1% was lower than AP with 5, 15, 5 °C, and 0.12% respectively. As the proportions of PVA increases, the OT, PT and RW were significantly increased. For example, the OT, PT1, PT2, PT3, and RW of PAP-3% were 8.6 °C, 19 °C, 56 °C and 3.07% respectively. At approximately 150 °C, there was a prominent endothermic peak (EP) of AP and PAP, which resulted in the dehydration condensation process (Fig. 2f). As the proportions of PVA increases, the EP decreased from 151.0 to 146.0 °C, which indicates that the PVA could affect the EP of PAP.
In order to explore the reaction mechanism between PVA and AP, the chemical form of pure PVA, PP, and PAP were examined. As shown in Fig. S4,† there were two elements of C and O in the pure PVA survey curve, and the ratio of C/O was 2.37 instead of 2 in theory. The reason may be due to the dehydroxylation, and the degradation of the polymer under X-ray irradiation changed from C–OH of PVA to C![[double bond, length as m-dash]](https://www.rsc.org/images/entities/char_e001.gif) O, COOH or C–O–C.35,36 In PP and PAP curves, apart from C and O, new elements of P and Al were discovered. Moreover, there were two peaks in C1s curve of PVA, which presented as C1 (–CH2–) and C2 (–CH–OH) of two types carbon atoms in 284.8 and 286.4 eV with the ratio of 56.86 and 43.14%, respectively (Fig. 2g). In contrast, the ratio of C2 in PP dramatically dropped to 11.84%, which indicates that the –OH groups were substantially consumed during esterification. Small peaks found around 289 eV (2.11%) and 292 eV (2.11%) were C
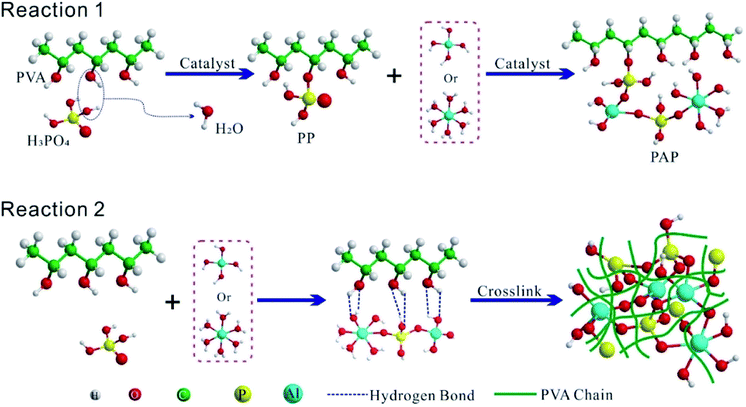
O, COOH or C–O–C.35,36 In PP and PAP curves, apart from C and O, new elements of P and Al were discovered. Moreover, there were two peaks in C1s curve of PVA, which presented as C1 (–CH2–) and C2 (–CH–OH) of two types carbon atoms in 284.8 and 286.4 eV with the ratio of 56.86 and 43.14%, respectively (Fig. 2g). In contrast, the ratio of C2 in PP dramatically dropped to 11.84%, which indicates that the –OH groups were substantially consumed during esterification. Small peaks found around 289 eV (2.11%) and 292 eV (2.11%) were C![[double bond, length as m-dash]](https://www.rsc.org/images/entities/char_e001.gif) O and COOH, respectively. This results in the degradation of the X-ray irradiation or oxidation of –OH group in an acidic medium. Additionally, in C1s curve of PAP, the ratio of C2 continue to drop to 6.42%, which indicates that some of C–OH groups on the PVA took part in the polymerization reaction with Al(OH)3. The characteristic Al 2p and P 2p peaks of PAP are 74.95 and 134.40 eV, lower than AP with a difference of 0.24 and 0.25 eV, respectively (Fig. 2(h) and (i)). As a result, P–O–C and Al–O–C covalent bonds may form between PVA and AP.13,37 The reaction process could be described as presented in Fig. 3 Reaction 1. At the same time, C–OH groups of PVA chain could interact with AP through hydrogen bond and crosslink with each other, as shown in Fig. 3 Reaction 2.
O and COOH, respectively. This results in the degradation of the X-ray irradiation or oxidation of –OH group in an acidic medium. Additionally, in C1s curve of PAP, the ratio of C2 continue to drop to 6.42%, which indicates that some of C–OH groups on the PVA took part in the polymerization reaction with Al(OH)3. The characteristic Al 2p and P 2p peaks of PAP are 74.95 and 134.40 eV, lower than AP with a difference of 0.24 and 0.25 eV, respectively (Fig. 2(h) and (i)). As a result, P–O–C and Al–O–C covalent bonds may form between PVA and AP.13,37 The reaction process could be described as presented in Fig. 3 Reaction 1. At the same time, C–OH groups of PVA chain could interact with AP through hydrogen bond and crosslink with each other, as shown in Fig. 3 Reaction 2.
To further investigate the framework of PAP, the 27Al MAS NMR and 31P MAS NMR spectra of PAP are presented in Fig. 4. Two peaks at 33.56 and −23.74 ppm could be seen at the 27Al NMR MAS curve (Fig. 4(a)), implying tetracoordinated and octacoordinated Al were present, respectively. The tetracoordinated and octacoordinated Al combined with P atom to form tetrahedral Al[OP]4 and Al[OP]6 through oxygen bridge, respectively.38–40 In Fig. 4(b) only one peak at −24.02 ppm belonged to tetrahedral P species.41 According to the XRD spectra of PAP, the formation of PAP crystal belonged to Al(H2PO4) (JCPDS no. 44-0724, showed in Fig. 4(c)). As a result, the possible structure of PAP is illustrated in Fig. 4(d).
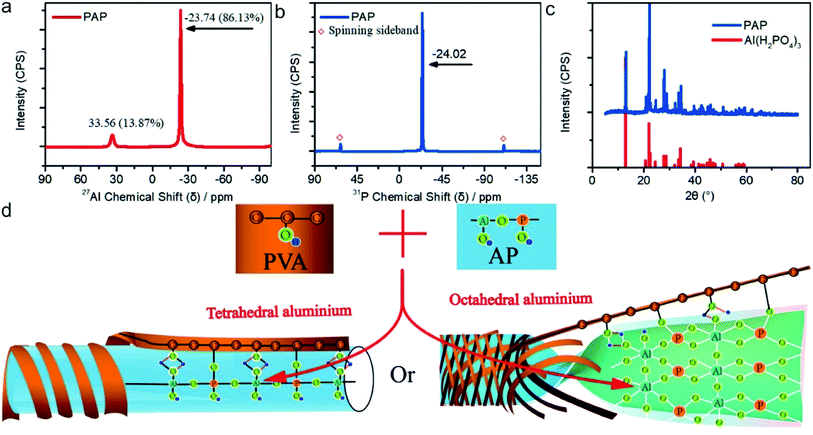 | ||
| Fig. 4 (a) 27Al MAS NMR spectra; (b) 31P MAS NMR spectra; (c) XRD spectra of PAP and Al(H2PO4) (JCPDS no. 44-0724) and (d) possible structure of PAP. | ||
3.2 Micromorphology, mechanical property and thermostability of PAP plywood
As shown in Fig. 5(a), the surface of wood fiber without adhesive exhibited a distinct smooth surface. The appearance of lines and wrinkles surface and densified structure could be seen in the PAP film since the polymerization process was under heat (Fig. 5(b)). This structure could help to improve the mechanical strength and water resistance property. A thin film and some adhesive bundles are closely packed on the surface of the wood fiber (Fig. 5(c)). The tensile test schematic diagram is shown in Fig. 5(d). The plywood's dry bonding strength and tensile curves are also shown in Fig. 5(e) and S5b.† IB of samples gradually increased as different proportions of PVAs were used (Fig. 5(e)). Compared to AP sample (1.98 MPa), the PAP-3% increased to 2.28 MPa with a 15.2% increment. There was a substantial difference between the wet bonding strength of AP and PAP samples (Fig. 5(f) and S5a†). The wet bonding strength of AP sample was as low as 0.1 MPa, which could easily be broken by hand. There were plenty of –O– structures with high electronegativity in the cured phosphate adhesive, which could connect to H molecule of moisture to form –OH groups, resulted in some nodes failure of 3D net structure.17,42 As a result, in wet bonding strength tests or samples in high humidity, the bonding strength could decrease dramatically. The wet bonding strength of the PAP-0.5 sample greatly increased to 0.36 MPa, 3.6 times that of the AP sample. Moreover, the bonding strength of the PAP-3.0 sample reached as high as 0.79 MPa, which increased by 690% compared to the AP sample. After assessing the bond interface of the tested samples, the interface showed there was an adhesive failure in AP samples. In contrast, PAP-3.0 samples revealed tearing and destruction on the bond interfaces between different layers of the wood veneer, which indicates a highly cohesive force between PAP adhesive and veneers (Fig. 5(f)). PVA took part in the polycondensations reaction with AP. The –OH groups of PVA and AP dehydrated to form hydrophobic nodes and decreased the chance of creating hydrated molecules with moisture.43 This could be verified by the contact angle tests of AP and PAP (Fig. S6†). The organic and inorganic hydration could reduce the brittleness of cured AP adhesive and increase the film-forming property. Meanwhile, they lessen the –OH groups inside the cured adhesive and create a barrier composed of organic C–C long chain to keep moisture away from breaking the P–O bond and increase the wet bonding strength.42In order to investigate the thermostability of PAPW; TG, DTG and DSC were tested, and results showed in Fig. 5(g) and (h). As can be seen in Fig. 5(g) and (h), the thermostability of wood fiber (W) experienced three stages of degradation. At the first stage (below 110 °C), the mass loss resulted from the evaporation of free water in the wood fiber, which was 3.72%. In the second stage (110–380 °C), there was a mass loss of 58.30% because of the decomposed hemicellulose and lignin. At the last stage (380–800 °C), the mass loss was 30.62% due to the deteriorated cellulose. The onset and second peak temperature of thermal decomposition (PT2) of PAPW increased by 19.9 °C and 25.4 °C, respectively (Table S5†). The RW of PAPW was 18.89, which increased by 8.37% and 14.04% for APW and W, respectively. Aluminum orthophosphate (AlPO4) and aluminum metaphosphate (Al(PO3)3) were formed when heating (Fig. 5(i)), which could improve the thermostability and fire resistance.44,45 Therefore, the introduction of PVA into PAPW could bring forward decomposition and shorten the time to PT, which promoted the char forming in the surface of the sample, reducing the production of organic volatiles and prevented heat from transferring into inner area. Increasing PT2 implied that it needs a higher temperature for thermo-decomposition and for the char layer's thermostability to improve. As a result, the PAP promoted the catalytic charring effect and decreased the organic volatiles production, resulting in increased thermostability.
In order to investigate the combination between PAP and wood, the XPS and XRD test was performed, and the results are showed in Fig. 6.
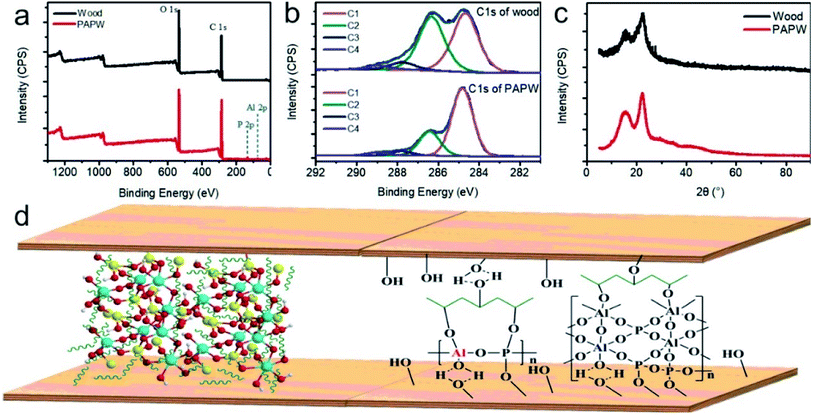 | ||
| Fig. 6 XPS curves: (a) survey and (b) C1s of wood and PAPW; (c) XRD profile of wood and PAPW; (d) combination mechanism between PAP and wood. | ||
As shown in Fig. 6(a), new elements of Al and P were found in PAPW sample, which signifies that the PAP was coated on the wood surface. The C2 (C–OH groups) percentage dramatically decreased from 43.1% wood to 24.4% PAPW (Fig. 6(b)). The same scenario was observed in C3 and C4 of PAPW with 1.8 and 0.3% reduction, respectively, compared to wood. There was no big difference in the XRD profile between wood and PAPW (Fig. 6(c)). The reason may be that there is a much smaller amount of PAP in the sample compared to wood fiber. The hydroxyl group consumption indicates that the PAP might connect to the wood surfaces with hydrogen bonds or even covalent bonds. The combination mechanism between PAP and wood is shown in Fig. 6(d). The adhesive crosslinked PVA with AP coated on the surface of wood veneer, which could closely combine with wood fiber and kept moisture from interacting with the bond interface.
4. Conclusion
In summary, PVA modified aluminum phosphate adhesive with non-formaldehyde, ecologically benign, and high cohesiveness was fabricated. Covalent bonds were formed between PVA and aluminum phosphate, enhancing the base adhesive and inhibiting moisture penetration. The dry and wet bonding strength increased to 2.28 and 0.79 MPa with a 15.2 and 690% increment, respectively. The thermostability of PAP and plywood sample were improved. Therefore, it could be concluded that this finding brings about high-performance of PAP adhesive and exhibit prospects for the preparation of non-formaldehyde wood-based panels.Conflicts of interest
The authors declare no competing financial interest.Acknowledgements
This work is financed by the Scientific Research Foundation of Wuyi University (YJ201913), Fujian Educational and Scientific Research Projects for Young and Middle-aged Teachers (JAT190785), Fujian Natural Science Foundation (Youth Innovation) (2020J05219), Undergraduate Innovation and Entrepreneurship Training Plan of Wuyi University (S202010397036) and Innovative Utilization of Characteristic Biomass Resources in Northern Fujian Province (2020-SSTD-09).References
- C. McGlade and P. Ekins, Nature, 2015, 517, 187 CrossRef CAS PubMed.
- A. Laurent, S. I. Olsen and M. Z. Hauschild, Environ. Sci. Technol., 2012, 46, 4100–4108 CrossRef CAS PubMed.
- Z. Zhang, D. J. Macquarrie, J. H. Clark and A. S. Matharu, ACS Sustainable Chem. Eng., 2015, 3, 2985–2993 CrossRef CAS.
- A. Salari, T. Tabarsa, A. Khazaeian and A. Saraeian, Ind. Crops Prod., 2013, 42, 1–9 CrossRef CAS.
- Z. Z. Wu, T. J. Chen, J. T. Aladejana, Y. Kouomo Guelifack, D. H. Li, X. J. Hou, X. Wang, M. Niu and Y. Q. Xie, J. Ind. Eng. Chem., 2021, 98, 180–188 CrossRef CAS.
- Z. X. Liu, R. N. Sun, Z. P. Mao and P. C. Wang, Surf. Coat. Technol., 2012, 206, 3517–3525 CrossRef CAS.
- L. Y. Hong, H. J. Han, H. Ha, J. Y. Lee and D. P. Kim, Compos. Sci. Technol., 2007, 67, 1195–1201 CrossRef CAS.
- M. Wang, J. Liu, H. Du, F. Hou, A. Guo, Y. Zhao and J. Zhang, RSC Adv., 2014, 4, 31821–31828 RSC.
- D. P. Kim, H. G. Woo, H. Ha, F. Cao, H. S. Myung, J. S. Rho and K. S. Han, Compos. Sci. Technol., 2003, 63, 493–499 CrossRef CAS.
- S. Ahmaniemi, M. Vippola, P. Vuoristo, T. Mäntylä, M. Buchmann and R. Gadow, Wear, 2002, 252, 614–623 CrossRef CAS.
- E. Leivo, M. S. Vippola, P. P. A. Sorsa, P. M. J. Vuoristo and T. A. Mäntylä, J. Therm. Spray Technol., 1997, 6, 205–210 CrossRef CAS.
- M. Liu, Y. Hou, J. Li, L. Tie, Y. Peng and Z. Guo, J. Mater. Chem. A, 2017, 5, 19297–19305 RSC.
- T. Chen, Z. Wu, X. A. Wang, W. Wang, D. Huang, Q. Wei, B. Wu and Y. Xie, ACS Sustainable Chem. Eng., 2018, 6, 6273–6280 CAS.
- R. K. Mukhutdinov, N. Samoilov and R. Perlov, Russ. J. Appl. Chem., 1998, 71, 447–451 Search PubMed.
- M. Vippola, J. Keränen, X. Zou, S. Hovmöller, T. Lepistö and T. Mäntylä, J. Am. Ceram. Soc., 2000, 83, 1834–1836 CrossRef CAS.
- J. H. Morris, P. G. Perkins, A. E. A. Rose and W. E. Smith, J. Appl. Chem. Biotechnol., 1976, 26, 385–390 CrossRef CAS.
- Y. S. Zhang, Y. Y. Xue, J. Huang, S. N. Li, L. Xia and C. H. Huang, J. Wuhan Univ. Technol., Mater. Sci. Ed., 2009, 24, 5–8 CrossRef CAS.
- H. J. Han and D. P. Kim, J. Sol-Gel Sci. Technol., 2003, 26, 223–228 CrossRef CAS.
- S. W. Lai and D. D. L. Chung, J. Mater. Sci., 1994, 29, 3128–3150 CrossRef CAS.
- M. C. Wang, J. C. Liu, H. Y. Du, F. Hou, A. R. Guo, S. Liu and X. Dong, Ceram. Int., 2014, 40, 11581–11591 CrossRef CAS.
- H. Zou, S. Wu and J. Shen, Chem. Rev., 2008, 108, 3893–3957 CrossRef CAS PubMed.
- G. Larsen, R. Velarde-Ortiz, K. Minchow, A. Barrero and I. G. Loscertales, J. Am. Chem. Soc., 2003, 125, 1154–1155 CrossRef CAS PubMed.
- S. Wu, F. Li, Y. Wu, R. Xu and G. Li, Chem. Commun., 2010, 46, 1694–1696 RSC.
- S. S. Kulkarni, A. A. Kittur, M. I. Aralaguppi and M. Y. Kariduraganavar, J. Appl. Polym. Sci., 2004, 94, 1304–1315 CrossRef CAS.
- L. J. Chen, J. D. Liao, S. J. Lin, Y. J. Chuang and Y. S. Fu, Polymer, 2009, 50, 3516–3521 CrossRef CAS.
- A. C. Patel, S. Li, J.-M. Yuan and Y. Wei, Nano Lett., 2006, 6, 1042–1046 CrossRef CAS PubMed.
- T. Pirzada, S. A. Arvidson, C. D. Saquing, S. S. Shah and S. A. Khan, Langmuir, 2012, 28, 5834–5844 CrossRef CAS PubMed.
- A. Li, Y. F. Jia, S. T. Sun, Y. S. Xu, B. B. Minsky, M. A. C. Stuart, H. Cölfen, R. von Klitzing and X. H. Guo, ACS Appl. Mater. Interfaces, 2018, 10, 10471–10479 CrossRef CAS PubMed.
- A. Papancea, A. J. M. Valente, S. Patachia, M. G. Miguel and B. Lindman, Langmuir, 2008, 24, 273–279 CrossRef CAS PubMed.
- C. M. Hassan and N. A. Peppas, in Biopolymers PVA Hydrogels, Anionic Polymerisation Nanocomposites, Springer Berlin Heidelberg, Berlin, Heidelberg, 2000, vol. 153, pp. 37–65 Search PubMed.
- X. F. Wang, D. F. Fang, K. Yoon, B. S. Hsiao and B. Chu, J. Membr. Sci., 2006, 278, 261–268 CrossRef CAS.
- S. D. Xiao, X. S. Feng and R. Y. M. Huang, J. Membr. Sci., 2007, 302, 36–44 CrossRef CAS.
- A. Jenni, L. Holzer, R. Zurbriggen and M. Herwegh, Cem. Concr. Res., 2005, 35, 35–50 CrossRef CAS.
- M. V. Peskov, V. A. Blatov, G. D. Ilyushin and U. Schwingenschlögl, J. Phys. Chem. C, 2012, 116, 6734–6744 CrossRef CAS.
- S. Akhter, K. Allan, D. Buchanan, J. A. Cook, A. Campion and J. M. White, Appl. Surf. Sci., 1988, 35, 241–258 CrossRef CAS.
- S. Akhter, X. L. Zhou and J. M. White, Appl. Surf. Sci., 1989, 37, 201–216 CrossRef CAS.
- Z. Z. Wu, D. B. Huang, W. Wei, W. Wang, X. D. Wang, Q. H. Wei, M. Niu, M. Lin, J. P. Rao and Y. Q. Xie, J. Cleaner Prod., 2019, 209, 273–282 CrossRef CAS.
- M. Haouas, F. Taulelle and C. Martineau, Prog. Nucl. Magn. Reson. Spectrosc., 2016, 94–95, 11–36 CrossRef CAS PubMed.
- S. L. Qiu, W. Q. Pang, H. Kessler and J. L. Guth, Zeolites, 1989, 9, 440–444 CrossRef CAS.
- H. L. Zubowa, E. Alsdorf, R. Fricke, F. Neissendorfer, J. Richter-Mendau, E. Schreier, D. Zeigan and B. Zibrowius, J. Chem. Soc., Faraday Trans. 1, 1990, 86, 2307–2312 RSC.
- H. Li, G. S. Zhu, X. D. Guo, Y. Li, C. J. Li and S. L. Qiu, Microporous Mesoporous Mater., 2005, 85, 324–330 CrossRef CAS.
- Q. Li, N. Fu and G. Zhao, Hot Work. Technol., 2012, 41, 61–64 Search PubMed.
- N. Shi, L. Zhang, G. Zhao and Y. Wang, Hot Work. Technol., 2016, 45, 52–55 Search PubMed.
- J. A. Fernando and D. D. L. Chung, J. Mater. Sci., 2001, 36, 5079–5085 CrossRef CAS.
- J. M. Chiou and D. D. L. Chung, J. Mater. Sci., 1993, 28, 1447–1470 CrossRef CAS.
Footnote |
| † Electronic supplementary information (ESI) available. See DOI: 10.1039/d1ra05552f |
| This journal is © The Royal Society of Chemistry 2021 |

