 Open Access Article
First-principles study of Mn3 adsorbed on Au(111) and Cu(111) surfaces
E. E. Hernández-Vázquez a,
S. López-Moreno
 *ab,
F. Munoz
 cd,
J. L. Ricardo-Chaveze and
J. L. Morán-López
 af
af
aCentro Nacional de Supercómputo, IPICYT, Camino a la Presa San José 2055, Col. Lomas 4a sección, San Luis Potosí, S.L.P. 78216, Mexico
bCONACYT – División de Materiales Avanzados, IPICYT, Camino a la Presa San José 2055, Col. Lomas 4a sección, San Luis Potosí, S.L.P. 78216, Mexico. E-mail: sinhue.lopez@ipicyt.edu.mx
cDepartamento de Física, Facultad de Ciencias, Universidad de Chile, Santiago, Chile
dCentro para el Desarrollo de la Nanociencia y la Nanotecnología (CEDENNA), Santiago, Chile
eLaboratorio Nacional de Supercómputo, Benemérita Universidad Autónoma de Puebla, Calle 4 Sur No. 104, Col. Centro, C.P. 72000, Puebla, PUE, Mexico
fDivisión de Materiales Avanzados, IPICYT, Camino a la Presa San José 2055, Col. Lomas 4a sección, San Luis Potosí, S.L.P. 78216, Mexico
First published on 20th September 2021
Abstract
A theoretical study of the Mn trimer adsorbed on the noble metal surfaces Au(111) and Cu(111) is reported. The calculations were performed using first-principles methods within the density functional theory and the generalized gradient approximation in the collinear and non-collinear magnetic phases. The system was modeled by considering a surface unit cell of 25 atoms to improve the trimer's isolation on the surface. We evaluated the trimer as a linear chain and forming triangular structures. The triangular trimer can be adsorbed in two possible configurations, above an empty surface triangle site (Δ) or on a triangle with a surface atom at the center in a hexagonal structure (H). The difference is the coordination of the Mn with surface atoms. We studied the antiferromagnetic (AF), ferromagnetic (FM), and non-collinear (NC) magnetic cases. As a result, the lowest energy configuration on both metals is the AFΔ configuration, which has an isosceles triangle shape. In comparison, the NC and the FM configurations adopt an equilateral geometry. The same trend was observed for the H configurations, but they are less bonded. The results are supported by calculating the spin-polarized electronic structure and the electronic charge transfer. Finally, we computed the energy barriers that inhibit the transformation of the linear chain to a delta Mn trimer on both substrates.
1 Introduction
The 3d series magnetic elements, Mn, Fe, Co, and Ni, exhibit electronic and magnetic properties that are attractive in areas such as co-catalysts,1,2 and magnetic devices.3,4 Studies of these elements at the atomic level, in a free state, reveal that their physical properties depend on the cluster size, geometrical shape, and coordination number.5–9 In the case of Mn, which has the highest magnetic moment of all 3d elements, its magnetic behavior depends on the interatomic distances, the number of first neighbors, and the magnetic coupling between the Mn atoms in the cluster.10–13Experimental studies, based on resonance Raman spectroscopy (RS)14 and electron spin resonance, (ESR)15 have observed an antiferromagnetic (AF) ground state for Mn2 with a bond length of 3.17 Å and binding energy of 0.44 ± 0.30 eV per atom.16–18 Early all-electron density functional theory (AE-DFT) studies predicted that the base state of Mn2 must be FM with much lower energy and a bond length smaller than the experimental one (∼2.60 Å).10,19 First-principles calculations based on the local density approximation (LDA) reported that the equilibrium bond distance of Mn2 depends on the magnetic coupling. It is 2.890 Å in the AF state and 3.06 Å for the FM one.12 Other theoretical results found that the lowest energy state belongs to the AF configuration.10,19–21 Likewise, Mn3 is very interesting because it can adopt either a FM or a collinear frustrated AF state as a free molecule. It is reported that the AF state has an isosceles triangular structure.22 Similarly, resonance Raman spectra studies suggest that the ground state is the Jahn–Teller distorted D3h structure with an odd integer magnetic moment.14 Otherwise, a small magnetic interaction is expected when magnetic clusters are deposited on non-magnetic surfaces. Also, lattice parameters and first surface neighbors restrict the adsorption of atoms on a particular surface. In this sense, Bornemann et al. observed a significant polarization on Ir(111) and a smaller effect on Au(111).6 Although Mn, Fe, Co, and Ni are neighboring chemical elements, they exhibit different physical properties that depend on the geometrical shape and size of the cluster.23
To the best of our knowledge, there is no experimental evidence of the adsorption of Mn3 on Au(111) and Cu(111) surfaces, but there are a few reports on other systems. In a previous study, Scanning Tunnelling Microscopy (STM) was used to manipulate Mn atoms on the Ag(111) surface to form small Mnn clusters (n = 2–4),24 similar to the work done on the Cr3/Au(111) system.25 In another report from the same year, Hirjibehedin et al. manipulated Mn atoms with STM on a CuN island of Cu(111) surface. Together with spin-excitation spectroscopy, they focused on studying the spin interactions in the formed linear chains of Mnn (n = 1–10) to make an advance in the comprehension of the low-dimensional magnetism.26
Theoretical studies of Mn clusters deposited on substrates of transition metals have been performed within the linear muffin-tin orbital atomic sphere approximation (LMTO-ASA) without considering structural relaxation.23,27,28 However, it has been proven that structural relaxation can change the magnetic properties of supported clusters.29–35 In particular, it has been shown that the minimum energy magnetic state of manganese clusters is strongly related to the interatomic distances Mn–Mn,12,32 feature that is discussed in detail in the following sections. The results for Fe clusters deposited on Cu(111) showed an FM ordering.27 In the case of Fe clusters with n = 2–7 atoms showed magnetic moments of 3.45 μB per atom in the dimer, and 2.56 μB in the central atom of the seven atom cluster.27
The Mn trimer on the Cu(111) surface showed that the most favorable coupling is the non-collinear (NC), while those with ferromagnetic coupling are higher in energy.23 For example, it was reported that the most stable configuration is the equilateral triangle shape with angles of 120°. The energy difference between a non-collinear solution and a frustrated collinear AF solution is 13 meV per atom and 102 meV per atom for the FM solution.27 Also, it was demonstrated that the magnetic moment decreases when the number of atoms increases.23,27 In the case of AF coupling between the nearest-neighbor atoms, one finds either a collinear AF structure or a non-collinear magnetic structure due to frustration in the cluster's geometry of Mn on Cu(111).27
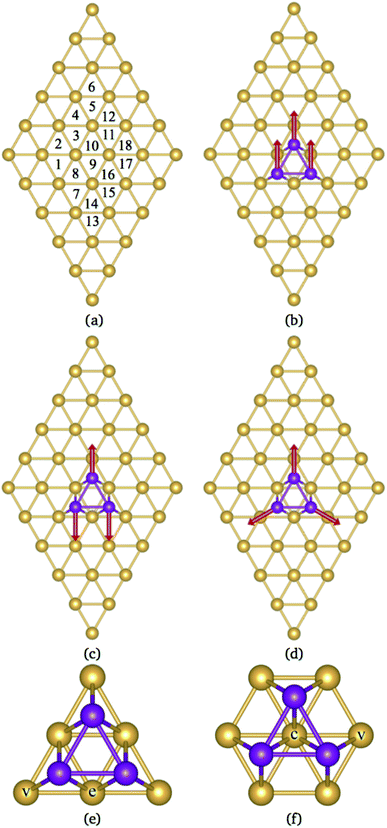
This paper reports a theoretical study of Mn3 adsorbed on Au(111) and Cu(111) surfaces. The calculations were performed within the collinear and non-collinear magnetism to accurately describe the lowest energy magnetic states of the Mn3 trimer on those substrates. Our results show that the lowest energy configurations for the Mn3 triangular trimer on these surfaces are those with AF coupling. There are two adsorption geometries on (111)-fcc surfaces, one located at the top of six surface atoms, called Δ, and the other above seven surfaces atoms, called Hexagon, H (see Fig. 1). We found that in the Δ configuration, the trimer is most strongly bonded. This effect is produced by more balanced coordination between Au and Mn atoms. Unlike previous studies, this work considers the structural relaxation of surfaces and Mn3, which has crucial effects on the geometries of these systems, the lowest energy magnetic state, and the electronic structure. We observed that the supercell's size has to be large enough to avoid interactions between trimer neighbors. The structural properties are accompanied by the analysis of the spin-polarized partial density of states in conjunction with the charge density redistribution. Furthermore, we calculate the energy barriers that block the movement of the atoms to change from a linear to a triangular arrangement Δ. These calculations could help to understand the results of STM experiments manipulating Mn atoms on noble metal surfaces.
The paper is organized as follows; a detailed description of the computational details is given in the next section. The results related to the Mn trimer adsorption on the Au(111) and Cu(111) surfaces are presented on Sec. 3.1 and 3.2, respectively. The information on the electronic structure characteristic of Mn3 on Au(111) and Cu(111) are given in Sec. 3.3 and 3.4, respectively. The energy barrier calculations are presented in Sec. 3.5. Finally, the conclusions are contained in Sec. 4.
2 Computational details
Calculations of the total energy were performed within the framework of the density functional theory (DFT) and the projector-augmented wave (PAW)36,37 method, as implemented in the Vienna Ab initio Simulation Package (VASP).38–41 The exchange–correlation energy was described within the generalized gradient approximation (GGA) in the Perdew–Burke–Ernzerhof (PBE)42 description. The wave functions are expanded in a plane-wave basis set with a cutoff energy of 400 and 290 eV for Cu and Au, correspondingly. This ensures that the forces are less than 0.01 eV Å−1 in each of the cartesian directions in the equilibrium configurations. We have considered a convergence criterion 10−7 eV in the total energy difference. The Monkhorst–Pack scheme was employed for the Brillouin-zone (BZ) integrations43 with the mesh 6 × 6 × 1.The lattice parameters for Cu and Au in bulk (aCu = 3.59 Å, and aAu = 4.166 Å) are in good agreement with experimental results from the literature.44 These lattice parameters were used to model a surface layer with a 5 × 5 × 1 supercell, and five surface layers thickness, 125 atoms. The two bottom layers were kept fixed to the bulk values, and the other three, together with the Mn atoms, were allowed to relax. Previously, some calculations were performed with a 4 × 4 × 1 supercell, as was reported in the literature.35 We found that in that case, the Mn trimer interacts with neighbor cells, as reflected on the adsorption energy. Thus, for comparison, we include the relative adsorption energies of Mn3 on 4 × 4 × 1 Au supercell. After the structural relaxation, the Au(111) surface layer expands 0.82%, and the second layer compresses 0.65%. In the case of the adsorption on the Cu(111) surface, the first layer expands 1.25%, and the second layer undergoes a compression of 1.71% in the [001] direction. A vacuum of 12 Å was considered in the direction perpendicular to the surface to avoid spurious interactions due to periodic conditions. We deposited three Mn atoms on the surface to form the trimer Mn3, representing coverage of 3/25. For this composition, the distance Mn3–Mn3 between images is 10 Å and 11.80 Å for Cu(111) and Au(111) surfaces, respectively. This distance ensures that the interaction between Mn trimer neighbors is negligible.
The adsorption energy Ead was calculated as follows:
| Ead = EMn3/surf − Esurf − EMn3, | (1) |
| Δρ(r) = ρMn3/surf(r) − ρsurf(r) − ρMn3(r), | (2) |
The dissociation paths and diffusion barriers are determined by using the nudged elastic band (NEB) method.45,46 The climbing image NEB (cNEB) method47,48 is commonly used to determine the saddle point in the energy barriers for the mobility of atoms and molecules on surfaces.31,32,49 Here, we used the cNEB to determine the saddle point in the energy barriers in the transformation of the Mn3 from a linear chain to the delta configuration by considering four images between the initial and final states.
3 Results and discussion
3.1 Mn trimer adsorption on Au(111)
According to the literature, the lowest adsorption energy for a Mn atom adsorbed on Au(111) surface is reached when the Mn atom is coordinated with three Au atoms, preferentially on fcc sites.32–34 Thus, in this work, we focus our study in the adsorption of Mn atoms on fcc-like sites. Fig. 1(a) shows several possible triangular adsorption sites located on the topmost surface layer supercell. Here, even (odd) numbers represent fcc (hcp)-like sites. The Mn3 trimer can be adsorbed on the surface as a linear chain28 or with a triangular shape.27 In the first case, Mn atoms are adsorbed in adjacent fcc-like positions, i.e. sites 8, 10, and 12 in Fig. 1(a). The Mn triangular trimer can be adsorbed in two ways over the surface if we only consider fcc sites. In the first one, Mn atoms are at 8, 10, and 16 sites, for which the surrounding surface atoms form a delta (Δ configuration), with three atoms on the vertex (v) and three atoms on edge (e), see Fig. 1(e). In the second one, the Mn atoms are at 10, 16, and 18 sites forming a hexagon (H configuration) with six atoms in the vertex (v) and one atom at the center (c) of the hexagon, see Fig. 1(f). We can see that in the Δ (H) configuration, Mn3 has six (seven) surface neighbor atoms, while in the linear chain, it has seven.The linear chain adsorbed on Au(111) surface was previously studied using the LMTO-ASA approximation, with and without structural relaxation.28 In the relaxed structures, only a 4% of variation (inward) was considered in the Mn distance to Au. These calculations placed the Mn atoms in the fcc sites above the Au(111) surface. Then, the interatomic dMn–Mn distance was 2.949 Å if we consider a lattice parameter a = 4.08 Å.44 The same procedure was performed for Mn3 adsorbed on Cu(111) and Ag(111) surfaces. So that, the Mn–Mn interatomic distances and the magnetic states were fixed and determined by the lattice parameter of the bulk transition metal. However, as was reported, the optimized dMn–Mn distance has a determining role in the lowest energy magnetic state of Mn clusters.12 Even with the limited relaxation, some authors 28 have observed important differences in the exchange coupling J of the Mn atoms, leading to different energy magnetic states depending on relaxation.
In our case, as was already mentioned, the relaxation was considered in the FM and AF (the central atom has a negative magnetic moment) configurations within the collinear magnetism. In the case of Au(111) surface, the linear chain's distortions are almost null since the two Mn–Mn bonds form an angle of almost 180° (∼179°) for both AF and FM configurations, see Fig. 2(a). The difference in adsorption energy (Ead) between the FM and AF states is 81 meV per atom, with a magnetic moment 4.76 μB and 14.13 μB for AF and FM, respectively. The main results are listed in Table 1. We can also notice that the AF interactions promote a smaller interatomic bond distance dMn–Mn than in the FM one, while the distances dMn–Au are slightly smaller for the FM configuration. As we can see, relaxation plays an important role in the geometry and the values for adsorption energy of the ground state.
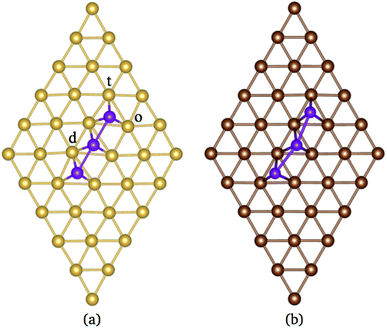 | ||
| Fig. 2 Manganese distorted linear trimer adsorbed on the topmost layer of (a) Au(111) and (b) Cu(111) surfaces. | ||
| Eads | μtotal | dMn–Mn | dMn–Au | |
|---|---|---|---|---|
| Linear chain | ||||
| AF | −6.162 | 4.76 | 2.848(2) | 2.560(2), 2.562, 2.606(2) |
| 2.625(2), 2.641(2), | ||||
| FM | −6.081 | 13.74 | 3.104(2) | 2.548(2), 2.559, 2.560(2) |
| 2.592(2), 2.610(2) | ||||
![[thin space (1/6-em)]](https://www.rsc.org/images/entities/char_2009.gif) |
||||
| Triangular trimer | ||||
| AFΔ | −6.535 | 4.35 | 2.690(2), 2.871 | 2.608(2), 2.648(2), 2.632(2) |
| 2.623(2), 2.672 | ||||
| AFH | −6.208 | 4.32 | 2.683(2), 2.853 | 2.610(2), 2.691(2), 2.635(2) |
| 2.718, 2.652(2) | ||||
| NCΔ | −6.492 | 0 | 2.761(3) | 2.643(6), 2.618(3) |
| NCH | −6.195 | 0 | 2.731(3) | 2.642(6), 2.666(3) |
| FMΔ | −6.482 | 13.72 | 2.846(3) | 2.605(6), 2.636(3) |
| FMH | −6.177 | 13.67 | 2.873(3) | 2.618(6), 2.628(3) |
It is important to note that the adsorption of Mn3 on Au(111) surface, in the triangular configuration, has not been reported previously. Thus, to see the importance of the supercell size, we calculated the adsorption energy Ead using both, a 4 × 4 × 1, and 5 × 5 × 1 supercells. We found that the lowest state in both cases is the antiferromagnetic Δ triangular configuration. Fig. 3 shows the adsorption energy difference of the various states compared to the AFΔ configuration for both supercells. As we can observe, the NCΔ is less bonded than the FMΔ when using a 4 × 4 × 1 supercell, in contrast to the results for the larger supercell. The lowest energy sequence obtained in the last case is the AFΔ, followed by the NCΔ and the FMΔ one. The same trend appears for Mn in the H arrangement. As we can see, if we compare a specific magnetic state, there is an energy difference of at least 300 meV between the Δ and H configurations. We also made some calculations, including the spin–orbit coupling, and found no important effect on the different magnetic states nor their relative energy. Similar behavior has been found in several Au nanostructures.50 Note that the Mn trimer in the triangular shape is more stable than the linear chain, see Table 1.
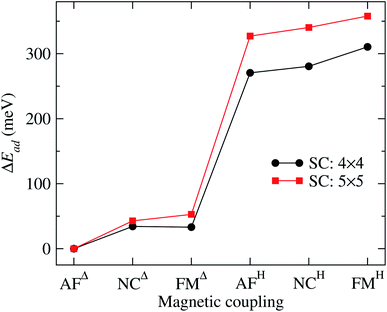 | ||
| Fig. 3 Adsorption energy difference (ΔEad) of the various Au(111)/Mn3 cases, with respect to the value of the Mn3 in the AFΔ configuration. The curve obtained with a 5 × 5 supercell corresponds to the data from Table 1. We also show the results using a 4 × 4 supercell for comparison. | ||
It is observed that the Mn–Mn interatomic distances (dMn–Mn) are equal in the FM and NC configurations (equilateral triangles). In contrast, an isosceles triangle shape is found in the AF state of the Mn trimer. This configuration was also observed when Mn3 is on Cu(111).35 Here, the longest dMn–Mn bond corresponds to the triangle base, and their magnetic moments are ferromagnetically coupled. In the AFΔ triangle, the base consists of Mn atoms in sites 8 and 10. While, for AFH triangle, the base Mn atoms are located in sites 10 and 16. Also, the value of dMn–Mn in the FMH state is the longest when compared with the NC and AF cases. It is worth mentioning that this value is also larger than those reported in free clusters.22
Furthermore, the dMn–Au values are pretty similar among each other. Besides, the distortion of Au(111) surface due to Mn3 adsorption is reduced to the topmost layer, mainly in the xy plane; the Au atoms in the triangles below the Mn atoms undergo a small expansion. We found an average perpendicular Mn–Au distance (zMn3–Au) between the surface and Mn trimer of 1.910, 1.929, and 1.859 Å for AF, NC, and FM, respectively, in the H arrangement. In contrast, in Δ configurations, the values are 1.883, 1.887, and 1.862 Å, respectively. It is important to mention that the interlayer distance in the bulk of Au is dbulk = 2.405 Å, while the distance between the topmost two layers is d1–2 = 2.450 Å. So, the distance zMn3–Au is smaller than d1–2; the lattice parameter of Au allows that the Mn atoms to be adsorbed in the Au triangles closer to the plane of the topmost layer.
3.2 Mn trimer adsorption on Cu(111)
There are reports, based on the LMTO-ASA theory,23,27 on the absorption of Mn3 over the Cu(111) surface. These calculations do not consider the structural relaxations and fix the Mn atoms to the fcc positions. The authors reported that AF exchange interactions between Mn nearest neighbors cause either collinear AF or NC order. The NC ordering occurs when the cluster geometry is such that an AF arrangement becomes frustrated, as in the triangular trimer.27 For their part, Ke-Hua et al.35 studied the adsorption of Mn3 on Cu(111) surface with a 4 × 4 × 1 supercell considering atomic relaxation. Unfortunately, this cell is not large enough to prevent Mn3–Mn3 interactions and leads to ground state energies that do not correspond to the isolated trimer. Here, we present results using a 5 × 5 × 1 supercell, including full atomic relaxation.The physical properties of Mn3 adsorbed as the linear chain on the Cu(111) surface are listed in Table 2. The lowest energy for the linear chain on the Cu(111) surface corresponds to the AF state, with an energy difference of 42.333 meV per Mn atom, with respect to the FM solution, and a magnetic moment of 4.50 μB. Bergman et al. found the same configuration in their no-relaxed LMTO-ASA calculations.23
| Ead | μtotal | dMn–Mn | dMn–Cu | |
|---|---|---|---|---|
| Linear chain | ||||
| AF | −5.497 | 4.50 | 2.697(2) | 2.534(2), 2.555(2), 2.456(2) |
| 2.566(2), 2.459 | ||||
| FM | −5.371 | 13.58 | 2.775(2) | 2.439(2), 2.492(2), 2.455(2) |
| 2.546(2), 2.557 | ||||
![[thin space (1/6-em)]](https://www.rsc.org/images/entities/char_2009.gif) |
||||
| Triangular trimer | ||||
| AFΔ | −5.864 | 4.37 | 2.635(2), 2.790 | 2.492(2), 2.533(2), 2.551(2) |
| 2.538(2), 2.513 | ||||
| AFH | −5.673 | 4.33 | 2.642(2), 2.791 | 2.476(2), 2.551(2), 2.571(2) |
| 2.571(2), 2.476 | ||||
| NCΔ | −5.797 | 0 | 2.677(3) | 2.540(3), 2.539(3), 2.497(3) |
| NCH | −5.671 | 0 | 2.654(3) | 2.588(3), 2.518(6) |
| FMΔ | −5.785 | −13.49 | 2.769(3) | 2.489(3), 2.533(6) |
| FMH | −5.603 | 13.76 | 2.783(3) | 2.579(3), 2.502(6) |
Under relaxation, the linear chain undergoes a distortion that changes the Mn–Mn–Mn angle from 180 to 165° see Fig. 2(b). The Mn–Mn bond distance is 2.697 (2.775) Å for the AF (FM) configuration. These distances are larger than those reported for Mn2 on the same surface.34 As we can see, the interatomic distances dMn–Mn and dMn–Cu are smaller than those in the linear chains on the Au(111) surface (see Table 1). The significative contrast in the interatomic distances between both surfaces is due to the lattice parameter difference. A larger lattice parameter imposes a larger interatomic distance. At the same time, the Mn atoms bind stronger to the surface. This shows how the surface geometry modifies the structure of Mn3 linear chain, mainly in the Mn–Mn–Mn angle and interatomic distances.
The adsorption of Mn3 triangular isomer on Cu(111) shows similar behavior to the Mn3 adsorption on Au(111). The Mn3 molecule adsorbs stronger in a Δ geometry (see Table 2). Bergman et al.23,27 found a similar result, although they do not mention the location of Mn atoms on the Cu(111) surface. They just reported that the lowest energy configuration for triangular trimer on Cu(111) surface is reached when Mn atoms are in an NC arrangement with an angle of 120° between the magnetic moment. Since the positions of the Mn atoms were artificially fixed to the surface sites, the dMn–Mn distances are 2.5385 Å (for an experimental lattice parameter a = 3.59 Å (ref. 44)), a value that is smaller than the one obtained in this work for the different configurations, see Table 2. Furthermore, it was reported that a lower adsorption energy for Mn3/Cu(111) system is achieved when the three Mn atoms are on bridge sites in an AF configuration.35 We found that this configuration is higher in energy than the Δ geometry. Ke-Hua et al.35 found a similar AF solution with Mn–Mn interatomic bond distances of 1.92, 1.91, and 2.37 Å. As shown in the Table 2, our results are 2.577, 2.567, and 2.738 Å. We believe that this difference might be due to the smaller energy cut-off of 300 eV considered in the work of Ke-Hua et al.35
Similar to the Au results, Mn atoms form an equilateral triangle in the NC and FM configurations. In contrast, in the AF one, the atoms form an isosceles triangle, as observed previously 35. The longest side corresponds to the triangle base, which occupies sites 8 and 10 (10 and 16) in the Δ (H) configuration. According to Tables 1 and 2, dMn–Cu distances are smaller than in the Mn3/Au(111) system, but the opposite occurs for the average distance between the atoms from the topmost layer of Cu(111) surface and the Mn3 trimer, zMn–Cu. The values obtained for zMn–Cu in the H arrangement are 2.032, 2.036, and 2.024 Å for the AF, NC, and FM state, respectively, whereas in the Δ configuration the values are 2.006, 2.0, and 2.0 Å. We found that the interlayer distance in the bulk of Cu is dbulk = 2.073 Å, while the average distance between the topmost two Cu layers when Mn3 is adsorbed on the surface is d1–2 ≈ 2.11 Å. Thus, we can see that zMn–Cu is closer to the distance d1–2 than in the Mn3/Au(111) system.
3.3 Electronic structure of Mn3/Au(111)
The analysis of the electronic structure is fundamental to understand the adsorption of molecules on surfaces. Here, we focus our research on the spin-polarized electronic density of states (DOS) produced when the Mn trimer is adsorbed in the AF configurations forming a linear chain and the triangular Mn3 (both Δ and H) on the Au(111) surface. Fig. 4 shows the partial DOS for the AF Mn linear chain. The spin-up DOS are plotted in the upper panel, while the lower part draws the spin-down states. The black curves correspond to the sum of the three atoms. The discontinuous red (green) one corresponds to one of the Mn atoms with magnetic moment in the up (down) direction. In this arrangement, the two extreme Mn atoms are aligned with the magnetic moment pointing in the plus z-axis. The middle atoms have a magnetic moment pointing in the opposite direction. We have included only d orbital results since there are no significant contributions close to the Fermi level due to the s states. Since the two Mn atoms at the end of the liner chain have the same environment, the DOS are equal. The electronic states show the characteristic half-filled spin-up d orbital below the Fermi level (at zero energy). The spin-up states are just below the Fermi level, with significant contributions from the spin-down states. In comparison, the Mn atom with a negative magnetic moment presents DOS that are not entirely antisymmetric to those of the Mn+ atoms. Fig. 4(b) shows that the electronic states corresponding to the two-fold coordinated Au surface atoms (denoted by “d”) contain more low energy states than that of the mono-coordinated “t” and “o” atoms, mostly below −4 eV. We can also see no significant differences in the partial DOS between “t” and “o” atoms. In this figure, the DOS characteristic of the clean surface is denoted by “C.”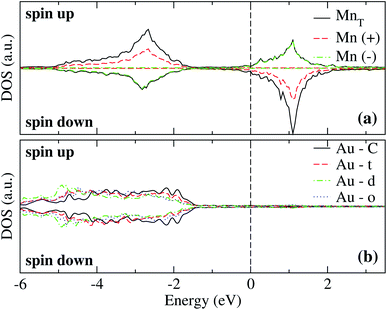 | ||
| Fig. 4 Spin-polarized partial electronic density of states (DOS) per atom for the Mn linear chain adsorbed on the Au(111) surface. (a) The total and partial contributions from the Mn atoms with positive (2 atoms) and negative (one atom) magnetic moments. (b) The partial DOS in the Au(111) surface atoms in the neighborhood of the Mn trimer. The label C refers to the Au atoms corresponding to the topmost layer when the surface is clean, while “t,” “d”, and “o” correspond to the Au DOS in the positions labeled with those letters in Fig. 2(a). The energy is referred to the Fermi energy. | ||
By taking the difference of the total spin-up and down electrons, we obtained the data shown in Table 1. We see that the FM and AF Mn arrangements' total magnetic moments yield a magnetic moment of 13.74 and 4.76 μB, respectively. Furthermore, the magnetic moment induced in the neighbor Cu atoms is negligible.
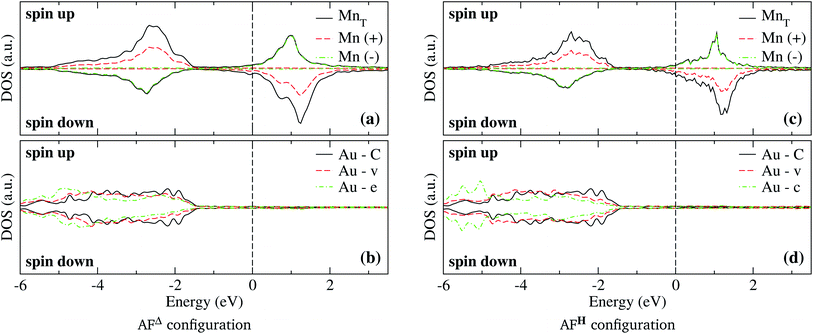
In the case of the isosceles triangular trimer, we show in Fig. 5 the partial DOS for the Mn3 adsorbed on Au(111) in (a) AFΔ, and (c) AFH, configurations. The upper panels of Fig. 5, (a), and (c) show the contributions arising from the Mn atoms, two with positive and one with negative magnetic moment values. The atoms with magnetic moments in the same orientation are those on the triangle base. We present the partial DOS in the Au neighbor atoms in the lower panels. The labels (C), (v), and (e) mean clean surface and atoms in the vertex and the edge sites. Furthermore, in the AFH, the label (c) corresponds to the atom in the center of the hexagon, see Fig. 1(e) and (f). From those figures, one observes that all the Mn atoms are three-fold coordinated (in contrast to the linear chain). Furthermore, we notice that the bands in the AFΔ state are wider than those of the AFH, but the DOS belonging to the hexagonal case, the DOS shows more structure. The sum of the spin-polarized partial DOS gives a total magnetic moment of 4.35 μB and 4.32 μB, in the Δ and H, respectively.
As seen in Fig. 1(e) and (f), the Au surface atoms bonded to the trimer are single (v) and two-fold (e) coordinated in the Δ configuration, and two- and three-fold (c) coordinated in the H case. One can notice, in Fig. 5(b) and (d), that depending on the number of bonds, the modification to the deep states (−7 to −4 eV) is more noticeable. In these figures, we show with black lines the DOS of Au atoms on the clean surface. The most considerable interaction occurs for the central atom in the hexagonal case.
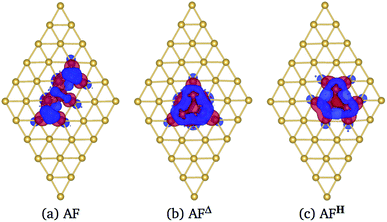
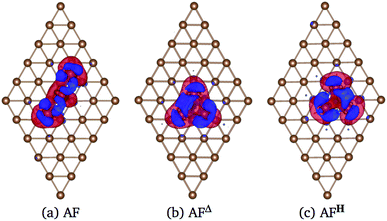
In Fig. 6 we show the charge density difference Δρ(r) for the Mn3/Au(111) system in the (a) AF linear chain, (b) AFΔ, and (c) AFH configurations. This figure shows that the redistribution of the charge density occurs mainly between the Mn and the bonded Au atoms to the linear chain (seven), delta (six), and the hexagon (seven) trimer, with a minimal redistribution of electrons of atoms beyond the first neighbors. The asymmetries in the lobes are due to the Mn trimer's surface deformation and the differences in the Mn–Mn bond distances in the AF arrangements; see Fig. 6. But we observed a symmetry along the middle of the base and the apex triangle in the Δ and hexagonal arrangements. Furthermore, no significant differences were observed in charge redistribution Δρ(r) for the second and the deeper Au layers.
3.4 Electronic structure of Mn3/Cu(111)
The spin-polarized electronic DOS for the Mn3/Cu(111) systems are presented in Fig. 7 and 8. Since the d electronic states of Mn and Cu are close in energy, the interaction between both kinds of chemical elements is stronger. The partial DOS from Mn3 in the AF linear chain configuration shows that the states of Mn atoms with a positive magnetic moment, at the end positions, differ from the central one, mainly in the higher position peaks. A difference with the Au substrate is that, in this case, the partial DOS below the Fermi level spreads in two main peaks around −2.5 and −3.5 eV that coincide with the DOS of the clean Cu(111) surface. Unlike the adsorption of Mn3 on Au(111), there is a strong hybridization between Mn3 and the Cu neighbor atoms (t, d, and o) below −3 eV.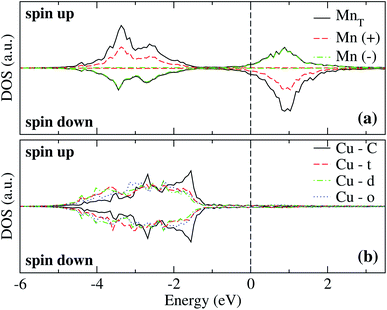 | ||
| Fig. 7 Spin-polarized partial electronic density of states (DOS) per atom for the Mn linear chain adsorbed on Cu(111) surface. (a) The total and partial contributions from the Mn atoms with positive (2 atoms) and negative (one atom) magnetic moments. (b) The partial DOS in the Cu(111) surface atoms in the neighborhood of the Mn trimer. C refers to the Cu atoms corresponding to the topmost layer when the surface is clean, while “t”, “d”, and “o” correspond to the Au DOS in the positions labeled in Fig. 2(a). The energy is referred to the Fermi energy. | ||
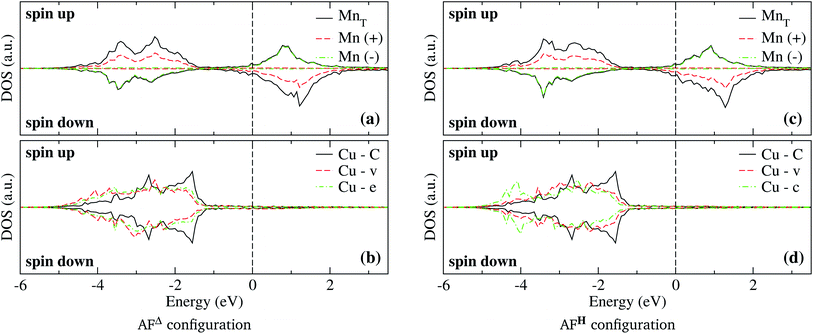
As can be seen in Fig. 8(b), the partial DOS from the Cu(111) surface and Mn3 in the AFΔ configuration is wider than the DOS of AF linear chain from Fig. 7, as a consequence of the higher coordination number. The main difference is a higher peak around −3.5 eV, and that in the AFΔ case, a second peak around −2.5 eV is as important as the −3.5 eV peak.
Regarding the AFH configuration of Mn3/Cu(111) system, the partial DOS from Mn atoms is similar to the AFΔ one, with the main difference that the peak at −3.5 eV from the Mn atom with negative magnetic moment (spin-down states) has a more intensive peak than in the Δ case. This is coupled with a lowering of the spin-up states of Mn atoms at the same energy. It was observed that the Cu atom from the center “c” has a wider partial DOS than the vertex “v.” Similar to what happens in the same configuration of the Mn3/Au(111) system. Although, the partial DOS from Mn3/Au(111) is deeper in energy than in the Mn3/Cu(111) system.
Fig. 9 shows the charge density difference Δρ(r) of Mn3 on Cu(111) surface. The linear chain presents a major charge deficiency around the Mn atoms than in the Au(111) surface; see Fig. 6(a). We noticed again that the Δρ(r) and H configurations have a two-fold symmetry with respect to the line that joins the apex with the central part of the base of the isosceles triangles. Also, the charge excess on the topmost layer around Mn atoms is more noticeable in the Au(111) than in the Cu(111) surface because the Mn atoms are adsorbed stronger in the Au surface. This is an effect produced by the surface lattice parameter. The charge redistribution on the manganese atoms is more significant for the Mn3/Cu(111) system. Also, we can see that the Δρ has some effects on the second layer. But the isovalue selected is pretty small (0.002 eV Å−3), which means that the second layer's redistribution is almost negligible. This was verified by comparing the partial DOS of the first and second layers when the Mn atoms are adsorbed on Cu(111) surface.
3.5 Energy barriers to transform the linear to the delta trimer
This section describes the main results on the computed energy barriers required to overcome to transform the linear Mn3 trimer adsorbed on noble metal surfaces to the triangular Δ configuration. The initial state is the linear chain in the AF configuration, and the final state is the AFΔ; we study both substrates, Au and Cu. According to our results (see Tables 1 and 2), there is an energy difference of 373 meV between the initial and final state in Au(111)/Mn3, while in Cu(111)/Mn3 the difference is 367 meV. Therefore, the presence of energy barriers is expected in order to reach the state of minimum energy.According to the literature, when Mn2 is adsorbed on Au(111) surface, it is required to overcome an energy barrier of ≈120 meV to move one Mn atoms to a near equivalent site,34 whereas, the energy required to dissociate the molecule is around 200 meV.32,34 In the case of Mn2/Cu(111), this migration requires overcoming an energy barrier of ≈30 and 290 meV to dissociate the molecule.34 In this work, we study the trajectory along which one of the end Mn atoms in the linear AF arrangement moves to form the triangle AF Δ configuration, following a minimum energy path.
We performed a search of stable intermediate states between the linear chain and the triangular trimer without success on both surfaces. Thus, the energy barrier calculations were performed using the linear and the triangular trimer configurations as initial and final states, respectively, calculating four images in between. The trajectories of the minimum energy paths for the Mn3 trimer transformation over Au(111) and Cu (111) surfaces are illustrated in Fig. 10; the transition state (TS) points are shown for each surface. As we can see, the trajectory for Mn3 over the Au(111) surface is accompanied by a substantial reconstruction of the neighbor surface geometry, with a metastable state in image 3. On the other hand, the minimum energy path for the Cu(111) surface is straightforward without a significant deformation in the surface geometry. The difference in the degree of surface deformation is related to the bulk lattice parameters. The Mn atoms in the Δ configuration are adsorbed more deeply in the gold surface (zMn3–Au(111) = 1.883 Å) than in the copper one (zMn3–Cu(111) = 2.006 Å). Thus, the reconstruction of the gold surface favors the appearance of the local minimum in image 3. The manganese atoms are located close to the elongated bridge positions, similar to that reported in ref. 35.
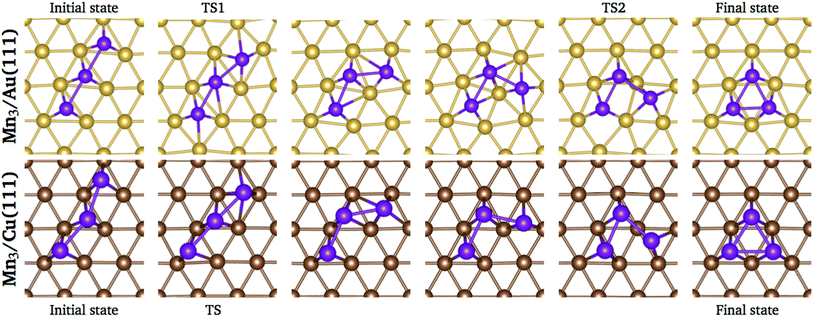 | ||
| Fig. 10 Positions of the atoms in the minimum energy path when Mn3 transforms from linear chain to delta configuration. | ||
According to Fig. 11, two transition states are observed with energy barriers of 68 meV between the initial state and image 1 and 104 meV between images 3 and 4. Note that the reference energy corresponds to the adsorption energy of the respective AF linear chain. The energy barrier for TS2 (image 4) is very close to the value of 122 meV observed when one of the Mn atoms forming the Mn2 molecule moves from a fcc site to the nearest hcp site on the Au(111) surface.32
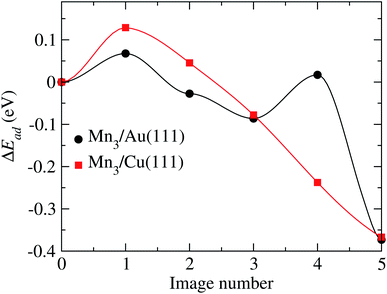 | ||
| Fig. 11 Minimum energy path obtained to go from the initial to final configurations shown in Fig. 10, for the Au and Cu substrates. | ||
For the Mn3/Cu(111) system, the atom coordinates in the transition state (TS) are very similar to the initial one. Once the top of the energy barrier is reached, the atoms move directly to the overall minimum energy state configuration in a monotonic way. This behavior is depicted in the minimum energy path illustrated in Fig. 11. The observed energy barrier of 129 meV, between the initial state and image 1, is lower than the energy required to dissociate the manganese dimer on the Cu(111) surface of 290 meV.34
4 Conclusions
A manganese trimer adsorption on noble metal surfaces Au(111) and Cu(111) was studied using first-principles methods within the collinear and non-collinear models of magnetism. The calculations were performed using a 5 × 5 × 1 supercell and a slab made of five surface layers in order to avoid spurious interactions between trimers located in the neighbor unit cells. The manganese trimer was adsorbed as a linear chain and triangular arrangements in the Δ and H configurations. The difference between Δ and H is the coordination of the surface atoms bonded to the Mn3 molecule. It was found, in both substrates, that the triangular arrangements are more strongly bound than the linear one. The sequence energy in both triangular arrangements is: the linear antiferromagnetic, followed by the non-collinear and the ferromagnetic, been the AFΔ one the most stable state. Our results showed that the relaxation of the atomic coordinates of the atoms in the trimer neighborhood has important effects on the manganese trimer magnetic state, an effect that was not considered in previous reports.23,27,28 Also, we demonstrated that the lowest energy configuration for the manganese trimer, adsorbed on Cu(111) surface, is the Δ configuration and not the geometric configuration with one atom in the bridge position, as was reported in the literature.35One of the primary outcomes is that the adsorption of Mn3 modifies the position of the surface atoms in the neighborhood, stronger in Au(111) than in Cu(111). The redistribution of the electronic charge density between the surface neighbor atoms and the molecule is more significant in Mn3/Au(111) than in the Mn3/Cu(111). The Mn3 trimer is adsorbed more strongly on Au(111) than on Cu(111) surface.
We presented the local spin-polarized electronic density of states of the Mn trimer and surface atoms in the various nearest neighbor non-equivalent sites. The differences, arising mainly from the different coordination numbers as well as the chemical characteristics of the substrate, were discussed at length. Furthermore, by integrating the difference of spin-up and down electronic states, we calculated the total magnetic moment of the Mn trimer. The values obtained for the μtotal, in the AFΔ, is 4.37 and 4.35 μB, for gold and copper, respectively. We also analyzed the electron redistribution of the adsorbed atoms and those on the substrate. This gives a direct representation of the electrons participating in the trimer bonding.
Finally, we studied the energy barriers needed to overcome in order to transform the Mn linear arrangement to the triangular Δ state. We calculated the lowest energy path for both noble metal surfaces. The results clearly show a substantial reconstruction of the Au(111) surface in this process, while on the Cu surface, we only observe slight changes. Consequently, only one transition state appeared on the Cu(111) and two on the Au(111) surface. In the last case, we found a metastable state where the Mn atoms occupy bridge positions which were mistaken as the ground state by other authors.35 The energy barriers obtained are below 130 meV, which are similar to the values reported for Mn atomic migration in the dimer on TM surfaces.32,34
Conflicts of interest
There are no conflicts to declare.Acknowledgements
E. E. H.-V. acknowledges a fellowship from CONACYT scholarship as SNI assistant, contract 18611 (Mexico). S. L.-M. thanks CONACYT (Mexico) for financial support through the program “Cátedras para jóvenes Investigadores” project 519. The authors gratefully acknowledge the computing time granted by LANCAD and CONACYT on the supercomputer Miztli at LSVP DGTIC UNAM. Also, the IPICYT Supercomputing National Center for Education & Research, grant TKII-R2021-EEHV/SLM, and the “Laboratorio Nacional de Supercómputo del Sureste de México” (LNS), project No. 201701004n, are acknowledged. F. M. was supported by FONDECYT Grant No. 1191353, CONICYT PIA/Anillo ACT192023, and Center for the Development of Nanoscience and Nanotechnology CEDENNA AFB180001. This research was partially supported by the supercomputing infrastructure of the NLHPC (ECM-02).References
- X. Han, R. Zhou, G. Lai, B. Yue and X. Zheng, J. Mol. Catal. A: Chem., 2004, 209, 83–87 CrossRef CAS.
- R. Subbaraman, D. Tripkovic and K. Chang, et al, Nat. Mater., 2012, 11, 550–557 CrossRef CAS PubMed.
- J. Coey, J. Magn. Magn. Mater., 1995, 140–144, 1041–1044 CrossRef CAS.
- N. L. A. Rodin, M. R. Sahar and F. Mohd-Noor, J. Magn. Magn. Mater., 2020, 496, 165931 CrossRef.
- H. M. Duan, X. G. Gong, Q. Q. Zheng and H. Q. Lin, J. Appl. Phys., 2001, 89, 7308–7310 CrossRef CAS.
- S. Bornemann, O. Šipr, S. Mankovsky, S. Polesya, J. B. Staunton, W. Wurth, H. Ebert and J. Minár, Phys. Rev. B: Condens. Matter Mater. Phys., 2012, 86, 104436 CrossRef.
- G. L. Gutsev, M. D. Mochena and C. W. Bauschlicher, J. Phys. Chem. A, 2006, 110, 9758–9766 CrossRef CAS PubMed.
- Q.-M. Ma, Z. Xie, J. Wang, Y. Liu and Y.-C. Li, Phys. Lett. A, 2006, 358, 289–296 CrossRef CAS.
- Q.-M. Ma, Z. Xie, J. Wang, Y. Liu and Y.-C. Li, Solid State Commun., 2007, 142, 114–119 CrossRef CAS.
- P. Bobadova-Parvanova, K. A. Jackson, S. Srinivas and M. Horoi, J. Chem. Phys., 2005, 122, 014310 CrossRef CAS PubMed.
- D. Tzeli, U. Miranda, I. G. Kaplan and A. Mavridis, J. Chem. Phys., 2008, 129, 154310 CrossRef PubMed.
- J. Mejía-López, A. H. Romero, M. E. Garcia and J. L. Morán-López, Phys. Rev. B: Condens. Matter Mater. Phys., 2006, 74, 140405 CrossRef.
- N. Desmarais, F. A. Reuse and S. N. Khanna, J. Chem. Phys., 2000, 112, 5576–5584 CrossRef CAS.
- K. D. Bier, T. L. Haslett, A. D. Kirkwood and M. Moskovits, J. Chem. Phys., 1988, 89, 6–12 CrossRef CAS.
- R. J. Van Zee, C. A. Baumann and W. Weltner, J. Chem. Phys., 1981, 74, 6977–6978 CrossRef CAS.
- M. D. Morse, Chem. Rev., 1986, 86, 1049–1109 CrossRef CAS.
- K. A. Gingerich, Faraday Symp. Chem. Soc., 1980, 14, 109–125 RSC.
- C. Demangeat and J. C. Parlebas, Rep. Prog. Phys., 2002, 65, 1679–1739 CrossRef CAS.
- S. K. Nayak, B. K. Rao and P. Jena, J. Phys.: Condens. Matter, 1998, 10, 10863–10877 CrossRef CAS.
- M. R. Pederson, F. Reuse and S. N. Khanna, Phys. Rev. B: Condens. Matter Mater. Phys., 1998, 58, 5632–5636 CrossRef CAS.
- P. Bobadova-Parvanova, K. A. Jackson, S. Srinivas and M. Horoi, Phys. Rev. A: At., Mol., Opt. Phys., 2003, 67, 061202 CrossRef.
- M. Kabir, A. Mookerjee and D. G. Kanhere, Phys. Rev. B: Condens. Matter Mater. Phys., 2006, 73, 224439 CrossRef.
- A. Bergman, L. Nordström, A. Burlamaqui Klautau, S. Frota-Pessôa and O. Eriksson, Phys. Rev. B: Condens. Matter Mater. Phys., 2006, 73, 174434 CrossRef.
- J. Kliewer, R. Berndt, J. Minár and H. Ebert, Appl. Phys. A: Mater. Sci. Process., 2006, 82, 63–66 CrossRef CAS.
- T. Jamneala, V. Madhavan and M. F. Crommie, Phys. Rev. Lett., 2001, 87, 256804 CrossRef CAS PubMed.
- C. F. Hirjibehedin, C. P. Lutz and A. J. Heinrich, Science, 2006, 312, 1021–1024 CrossRef CAS PubMed.
- A. Bergman, L. Nordström, A. Burlamaqui Klautau, S. Frota-Pessôa and O. Eriksson, Phys. Rev. B: Condens. Matter Mater. Phys., 2007, 75, 224425 CrossRef.
- R. Cardias, M. M. Bezerra-Neto, M. S. Ribeiro, A. Bergman, A. Szilva, O. Eriksson and A. B. Klautau, Phys. Rev. B, 2016, 93, 014438 CrossRef.
- Š. Pick, V. S. Stepanyuk, A. N. Baranov, W. Hergert and P. Bruno, Phys. Rev. B: Condens. Matter Mater. Phys., 2003, 68, 104410 CrossRef.
- S. Brinker, M. dos Santos Dias and S. Lounis, Phys. Rev. Mater., 2020, 4, 024404 CrossRef CAS.
- S. López-Moreno and A. H. Romero, J. Chem. Phys., 2015, 142, 154702 CrossRef PubMed.
- S. López-Moreno, J. Mejía-López, F. Munoz, A. Calles and J. Morán-López, J. Magn. Magn. Mater., 2016, 403, 172–180 CrossRef.
- F. Muñoz, A. H. Romero, J. Mejía-López and J. L. Morán-López, Phys. Rev. B: Condens. Matter Mater. Phys., 2011, 83, 205423 CrossRef.
- F. Muñoz, A. H. Romero, J. Mejía-López and J. L. Morán-López, Phys. Rev. B: Condens. Matter Mater. Phys., 2012, 85, 115417 CrossRef.
- Z. Ke-Hua, W. Zhen-Zhen, F. Qian, W. Yan-Min and H. Zhi-Gao, Chin. Phys. Lett., 2011, 28, 057501 CrossRef.
- P. E. Blöchl, Phys. Rev. B: Condens. Matter Mater. Phys., 1994, 50, 17953–17979 CrossRef PubMed.
- G. Kresse and D. Joubert, Phys. Rev. B: Condens. Matter Mater. Phys., 1999, 59, 1758–1775 CrossRef CAS.
- G. Kresse and J. Hafner, Phys. Rev. B: Condens. Matter Mater. Phys., 1993, 47, 558–561 CrossRef CAS PubMed.
- G. Kresse and J. Hafner, Phys. Rev. B: Condens. Matter Mater. Phys., 1994, 49, 14251–14269 CrossRef CAS PubMed.
- G. Kresse and J. Furthmüller, Comput. Mater. Sci., 1996, 6, 15 CrossRef CAS.
- G. Kresse and J. Furthmüller, Phys. Rev. B: Condens. Matter Mater. Phys., 1996, 54, 11169–11186 CrossRef CAS PubMed.
- J. P. Perdew, K. Burke and M. Ernzerhof, Phys. Rev. Lett., 1996, 77, 3865 CrossRef CAS PubMed.
- H. J. Monkhorst and J. D. Pack, Phys. Rev. B: Solid State, 1976, 13, 5188–5192 CrossRef.
- C. Kittel, Introduction to Solid State Physics, Wiley, 2004 Search PubMed.
- H. Jónsson, G. Mills and K. W. Jacobsen, in Nudged elastic band method for finding minimum energy paths of transitions, ed. G. C. B. J. Berne and D. F. Cocker, World Scientific, Singapore, 1998, ch. 16, pp. 385–404 Search PubMed.
- G. Henkelman, G. Jóhannesson and H. Jónsson, in Methods for Finding Saddle Points and Minimum Energy Paths, ed. S. D. Schwartz, Springer Netherlands, Dordrecht, 2002, pp. 269–302 Search PubMed.
- G. Henkelman, B. P. Uberuaga and H. Jónsson, J. Chem. Phys., 2000, 113, 9901–9904 CrossRef CAS.
- G. Henkelman and H. Jónsson, J. Chem. Phys., 2000, 113, 9978–9985 CrossRef CAS.
- E. E. Hernández-Vázquez, F. Munoz, S. López-Moreno and J. L. Morán-López, RSC Adv., 2019, 9, 18823–18834 RSC.
- X. Yang, J. Zhou, H. Weng and J. Dong, Appl. Phys. Lett., 2008, 92, 023115 CrossRef.
| This journal is © The Royal Society of Chemistry 2021 |

