 Open Access Article
Supported Pt–Cu bimetallic catalysts: preparation and synergic effects in their catalytic oxidative degradation of aniline†
Qiuyue Ding‡
a,
Wumin Zhang‡a,
Yuanyuan Zhub,
Lu Wang b,
Xinyuan Fengb,
Yanyan Xibc and
Xufeng Lin
 *ac
*ac
aDepartment of Chemistry, College of Science, China University of Petroleum (East China), Qingdao, 266580, P. R. China. E-mail: hatrick2009@upc.edu.cn
bCollege of Chemical Engineering, China University of Petroleum (East China), Qingdao, 266580, P. R. China
cState Key Laboratory of Heavy Oil, China University of Petroleum (East China), Qingdao, 266580, P. R. China
First published on 22nd October 2021
Abstract
Catalytic Fenton oxidation is an effective way to remove organic pollutants in water, and the performance of the catalyst is a key issue for the competiveness of this method. In this work, various supported bimetallic Pt–Cu catalysts were prepared by different impregnation methods and their performances for catalytic Fenton oxidation of aniline in water were investigated. In the different impregnation methods employed, factors including the reduction method of the metal precursor, type of catalytic support, and loading of metal were investigated. The effect of different reduction methods on actual loadings of the active components on the supported Pt–Cu catalysts showed the order of (i) H2 reduction > (ii) liquid phase methanal reduction. Meanwhile, compared with the monometallic catalysts, the Pt–Cu alloy phase (mainly in the form of PtCu3) was generated and the specific surface area was significantly reduced for the bimetallic catalysts. In the process of Fenton catalytic oxidation of aniline, it was found that most of the prepared catalysts had a certain catalytic activity for H2O2 accompanied with aniline degradation. It was found that Pt0.5Cu1.5/AC (where AC denotes activated carbon) exhibited superb catalytic activity compared with all other prepared catalysts. In particular, aniline was almost completely mineralized in a neutral solution (500 mg L−1 aniline, 0.098 mol L−1 H2O2) after 60 min at 50 °C using Pt–Cu/AC (Pt: 0.5%, Cu: 1.5%). The characterization results showed that the Pt and Cu components were rather evenly distributed on the AC support for this catalyst. More importantly, there was an obvious synergic effect on the supported bimetallic catalyst between the Pt and Cu components for the catalytic oxidation of aniline.
1. Introduction
In recent years, environmental accidents caused by aniline pollution1 have frequently occurred, and thus the treatment of aniline wastewater has become a hot topic in the research field of water treatment.2,3 The development of economical, environmentally friendly and efficient treatment technologies are undoubtedly always desirable for disposal of waste water in general and of that containing aniline in particular.4 In general, the treatment technologies for wastewater containing organic pollutants have a long history of research and practice, and they can be roughly classified into physical, chemical and biochemical methods.5,6 The traditional physical and biochemical treatment methods always require a rather long time to degrade organic compounds in wastewater. Owing to its fast speed and ability to achieve rather complete degradation of organic pollutants, chemical treatment method casts more and more attentions,7 like incineration,8 chemical oxidation,9 advanced oxidation processes (AOPs).10 AOPs including Fenton oxidation, catalytic-ozone oxidation and photocatalytic oxidation,11–14 share a general principle that highly-active oxygenated intermediate like ˙OH radicals are generated to oxidize the organic pollutants efficiently and thoroughly.15–17 In particular, Fenton oxidation method is suitable for degrading a variety of non-biodegradable organic substances.18,19 However, the traditional Fenton oxidation method suffers from the following problems, such as requiring a low aqueous pH value (typically around 3), the presence of a large amount of metal ions in the treated solution leading to a second-time contamination, insufficient amount of ˙OH produced, and poor catalytic activity, etc.20–22To overcome the above-mentioned problems, various types of new supported metal catalysts were developed, in particular, transition metals components like Fe and Cu immobilized on porous catalytic supports. For example, Stair et al.23 loaded Cu onto carbon microspheres using a spray-drying method, and the obtained catalysts presented excellent performance for the Fenton oxidative degradation of methyl orange, methyl blue, and rhodamine B in aqueous solutions. Yao et al.24 reported that FeOx/SiO2 catalyst could degrade aniline to a low concentration (1 mmol L−1). In addition, the conversion of aniline was 79% at pH = 3 and at the temperature of 30 °C after 160 min of reaction. In whole, novel supported metal catalysts have good potentials for degradation as well as mineralization of refractory organic pollutants. Researches on supported bimetallic Fenton-like systems are being carried out by using one metal catalyst after another, and currently there are only a few researches focusing on bi-transition metallic catalysts. For example, Choi et al.25 used Fe/Al as a heterogeneous Fenton catalyst for the oxidation of acetone, achieving an acetone conversion rate of up to 78.5%. The reason for the high conversion is that different metal ions may show a synergic catalytic effect in the bimetallic multi-type Fenton system.26 At the same time, it has a certain effect on suppressing the dissolution of catalytic metal ions.27 However, the researches focusing on the supported catalysts containing one noble metal component and another transition metal component are sparse. As is known, supported bimetallic catalysts containing precious metals often show good synergistic effects for reactions other than Fenton oxidation even though the metal loadings were extremely low.28 For instance, synergy between Pt and Re was found in carbon-supported Pt, Re, and Pt–Re catalysts, which were used in aqueous phase reforming (APR) of glycerol and water gas shift (WGS) reactions.29
In order to degrade high concentration of aniline in water, various strategies have been adopted to improve the activity of heterogeneous Fenton catalysts. For example, Liu et al.30 reported that Ni–Fe oxalic acid complex catalyst (the total loadings of Ni + Fe being about 31%) was used for the degradation of 20 mg L−1 aniline. The removal efficiency of aniline was ∼100% at pH = 5.4 after a 35 minute reaction, and the total organic carbon (TOC) removal rate was 88%. According to report in the literature,31–34 other metal components can be added to modify the supported precious metal catalysts. For example, Xie et al. found that the interaction of Pt and other metals was beneficial for improving the exposure rate of Pt nanoparticles on catalytic supports. The low-temperature reduction method could also prevent the high-temperature agglomeration of Pt particles.34
This work aims at providing new supported bimetallic catalyst for improved efficiency for Fenton oxidation of high-concentration aniline in water. Since both of Pt and Cu are often used in catalytic oxidation of organic compounds,35–38 these two metal elements were selected in this work to prepared supported bimetallic catalysts, partly for understanding whether they can present a synergic effect for Fenton oxidation of aniline. From the aspect of catalyst preparation method, the equal volume impregnation method39,40 under different conditions (including different types of catalytic support, amounts of metal loading and reduction methods) were examined. By developing new reduction method other than hydrogen reduction, highly dispersed metal components can be obtained on the catalyst surface, which can be beneficial to aniline oxidation. To the best of our knowledge, the preparation of supported Pt catalyst using imidazolidinyl urea as reductant, and the Pt-based supported bimetallic catalyst used for the oxidative degradation of aniline were both reported for the first time. The catalytic results reported in this work provide a potentially hopeful method for efficient removal of aniline pollutant in water.
2. Experimental section
2.1 Materials
Chloroplatinic acid (H2PtCl6·6H2O, AR, Pt > 37.5%), copper nitrate (Cu(NO3)2·3H2O, AR, 99%), iron nitrate (Fe(NO3)3·9H2O, AR), methanal (CH2O, AR), potassium permanganate (KMnO4, ≥99.5%), sodium hydroxide (NaOH, ≥96%), and aqueous hydrogen peroxide solution (H2O2, AR, H2O2 being 30 wt%) were provided by Sinopharm Chemical Reagent Co, Ltd. Imidazolidinyl urea (C11H16N8O8, AR, 98%) was provided by Aladdin Reagent (Shanghai) Co, Ltd. Alumina (Al2O3) particles were provided by Yantai Henghui Chemical Co, Ltd. SiO2 (20–40 mesh) particles were provided by Qingdao Ocean Chemical. Activated carbon (20–40 mesh) was provided by FuJian Xinsen Carbon Co, Ltd. All chemicals were of analytical purity and used without further treatment. Deionized (DI) water was applied for the whole experiment.2.2 Catalyst preparation
Supported Pt–Cu catalysts were synthesized using an equal volume impregnation method with the following steps, and the routine procedures can be found elsewhere in the literature.35 As a typical example, the preparation procedure of a Pt1.5Cu0.5/Al2O3 (the subscripts of 1.5 and 0.5 representing roughly the weight percents of Pt and Cu, respectively) catalyst containing 5 steps is described as follows.First, 4.0 g Al2O3 (being 20–40 mesh particles) was placed in a crucible, transferred into a muffle furnace and heated to 500 °C in air for 4 h to remove moisture and organic impurities. The calcined Al2O3 particles were placed in a clean plastic ziplock bag after cooling down. This step can be named as a pre-calcination step.
The second step was to impregnate the Cu component into Al2O3. For each gram of precalcined Al2O3, Cu(NO3)2·3H2O of 0.0193 g was dissolved in 0.90 g DI water, and the obtained Cu(II) solution was mixed with the Al2O3 particles. It should be noted that the volume of water in above the Cu(II) solution was equal to the water absorbed by amount of the calcined Al2O3 (0.90 g water can be absorbed by per gram of Al2O3).
In the third step of metal component reduction, Al2O3 particles impregnated with the Cu components were kept at room temperature for 12 hours and then were treated in a H2 flow at 300 °C for 4 h in order to reduce the Cu components. At this stage, the obtained sample can be named as Cu0.5/Al2O3.
The fourth step was to impregnate the Pt component to Cu0.5/Al2O3, which was similar to the second step, with the only differences in that 0.0406 g H2PtCl6·6H2O took the place of 0.0193 g Cu(NO3)2·3H2O.
The fifth step was to reduce the Pt component, and the treatment process was almost the same to the third step of Cu-component reduction. Finally, the catalyst obtained by these steps was represented as Pt1.5Cu0.5/Al2O3, where the percentages, indicated in the subscripts in the catalyst notation, were calculated from the mass of the Pt or Cu element relative to that of the Al2O3 support.
Different from the above-mentioned procedure (called standard preparation procedure), one or more of the preparation conditions including impregnation amount, bimetallic type, impregnation ratio of two metals, reduction temperature, reduction method, and type of catalytic support were changed to obtain different catalysts. These preparation methods are described as follows by comparing with the above-described standard preparation procedures.
For PtnCum/Al2O3 catalyst: change the amount of Cu and Pt sources in steps 2 and 4, respectively, to obtain the target weight percent of n% and m%, where (n + m) was always kept at 2.0. The detailed n and n value will be specified in the text hereafter.
For PtnCum/Al2O3-600 catalysts: compared to the case of PtnCum/Al2O3, the H2 treatment temperature was 600 °C instead of 300 °C in steps 3 & 5.
For PtnCum/SiO2 catalysts: use SiO2 instead of Al2O3 particle as catalytic support.
For PtnFem/Al2O3 catalysts: use Fe(NO3)3·9H2O instead of Cu(NO3)3·3H2O in the second step in order to impregnate the Fe component into the catalytic support.
For PtnCum/AC catalysts: use activated carbon instead of Al2O3 particle as the catalytic support, and the pre-calcination temperature was 300 °C in step 1.
For PtnCum/AC-MR catalysts: compared to the case of PtnCum/AC, in the fifth step, methanal reduction (MR) method was developed in this work. The Pt component impregnated AC particles was reduced at 80 °C in a solution containing imidazolidinyl urea having the same number of mole as the Pt source, excess amount of methanal, and having a pH value of 11. Then the particles were washed with a large amount of water and then dried at 120 °C over night. The reduction method will be named as methanal reduction method hereafter.
2.3 Catalyst characterization
The crystal phase structure of supported metal catalysts was measured by a powder X-ray diffractometer (XRD, D8 Advance, Germany) using a Cu Kα radiation (λ = 0.15418 nm) having a power of 2.2 kW with a scanning step of 0.02° and a 2θ range of 2–75°.In a temperature-programmed reduction by H2 (H2-TPR) measurement of a certain catalyst, the H2 signal was monitored by a thermal conductivity detector (TCD). First, the catalyst was pre-treated for a period of time (∼30 min) in an Ar flow, then switched to a 20 sccm flow of 10% H2–He for 20 min after cooling down to room temperature, and then heated up to 800 °C at a rate of 10 °C min−1. The TCD pool was kept at 60 °C & 30 mA.
Scanning electron microscope (SEM) and energy spectrometer (SEM-EDX) were used to analyze the morphology of the sample, and the element distribution by mapping. The working voltage of the instrument was 10.0 kV, the solid sample was more than 10 mg and needed to be dried and processed. Transmission electron microscopy (TEM) projected an accelerated and concentrated electron beam onto a very thin sample to collide, resulting in solid angle scattering, and get an image of light and dark. It was used to observe the morphology and dispersion of nanoparticles and measure the particle size of nanoparticles.
The N2 adsorption–desorption curves of samples were obtained by specific surface area and microporous physical adsorption analysis. Brunauer–Emmett–Teller (BET), Barret–Joyner–Halenda (BJH) were used to calculate the specific surface area and pore size distribution.
Thermogravimetric (TG) analyzed the decomposition temperature of samples. TG experiments were carried out in N2 flow (60 mL min−1), and heated from 40 °C to 800 °C at a heating rate of 10 °C min−1.
The prepared catalysts were ground to >200 mesh particles and then X-ray fluorescence (XRF, PANalytical, Netherlands) spectroscopy was used to measure the Si, Al, Pt or Cu contents of the catalysts.
2.4 Catalytic Fenton oxidation of aniline
The Fenton oxidation of aniline was performed in a 250 mL flask equipped with a water bath thermostat as the reactor. In a typical oxidation experiment, a 200 mL aniline aqueous solution (500 mg L−1) was added to the reactor. The temperature of the reaction system was heated to 50 °C by a water bath, and then a 2.0 mL H2O2 solution (30 wt%) was added to the above aniline solution (thus the concentration of H2O2 being 0.087 mol L−1 at the beginning of the reaction). At the absence of a catalyst, it was confirmed that there was no observable reaction between H2O2 and aniline at the reaction temperature. Then 1.0 g selected catalyst (or 5.0 gcat Lwater−1) was added to the reactor in order to initiate the catalytic oxidation reaction.A 2.0 mL liquid was sampled from the reaction mixture at certain time intervals, and then centrifuged to separate solid residue. The liquid sample was then analyzed by a HACH DR 1010 chemical oxygen demand (COD) analyzer or a TOC-LCPH/CPN total organic carbon content (TOC) analyzer. The catalytic performance of a certain catalyst was evaluated by calculating the COD or TOC removal rate of the reaction mixture where the catalyst was used.
2.5 Catalytic decomposition of H2O2
The catalytic H2O2 decomposition was performed with the same reaction conditions mentioned above (Section 2.4), with the only difference in that the 500 mg L−1 aniline solution was replaced by DI water of a same volume.At a certain reaction time, a 2 mL sampled solution was mixed with a 2 mL 3 mol L−1 sulfuric acid. The concentration of H2O2 was determined by acidic KMnO4 (5 mol L−1) titration, according to the volume of KMnO4 solution consumed. The titration reaction principle41 can be expressed as follows:
| 2MnO4− + 5H2O2 + 6H+ → 2Mn2+ + 5O2 + 8H2O |
3. Results and discussion
3.1 Results about the novel preparation method of the Pt–Cu/AC bimetal catalysts
It is noticeable that the impregnation and metal component reduction methods for preparing the Pt–Cu/AC catalysts (see Section 2.2 for detail) is reported for the first time. The main motivation for us to develop a new liquid phase reduction method came from the case that the activated carbon (AC) support may tend to be damaged at high temperatures. In addition, treatment with imidazolium urea solution before reduction can decrease the risk of agglomeration of metal nanoparticles at high temperatures, which could make the Pt and Cu active components more uniformly dispersed on the catalytic supports. This hypothesis was further verified by the TEM images of catalyst as shown later in this paper.Table 1 shows that the metal content losses of the Pt–Cu/AC catalysts prepared with the methanal reduction (MR) method were higher than those prepared with the H2 reduction method. The Pt and Cu loading rates (loading rate = actual loading/theoretical loading calculated from the experimental conditions) in the former case were about 88% and 77%, respectively, which are close to 100% for the latter case. Possible reasons accounted for this phenomenon could be as follows. (i) The times for ultrasonication during impregnation and liquid phase reduction were insufficient. (ii) The pores of catalytic supports became narrower after the first impregnation and reduction steps, which hindered the loading of the second metal component.
| Catalyst | Pt wt% | Cu wt% |
|---|---|---|
| Pt1.5Cu0.5/AC-MR | 1.329 | 0.386 |
| Pt1.0Cu1.0/AC-MR | 0.894 | 0.775 |
| Pt0.5Cu1.5/AC-MR | 0.445 | 1.275 |
| Pt1.5Cu0.5/AC | 1.529 | 0.446 |
| Pt1.0Cu1.0/AC | 0.994 | 0.965 |
| Pt0.5Cu1.5/AC | 0.505 | 1.475 |
3.2 Catalyst characterization results for physiochemical properties of catalysts
The H2-TPR profiles presented in Fig. 1a shows that the reduction temperature of the unreduced Cu2.0/Al2O3 catalyst started from ∼380 °C with the peak around ∼600 °C. The curves in Fig. 1b and c indicate that the metal components on the prepared supported Cu and Pt/Al2O3 catalysts was reduced to their metallic states. Xi et al. had reported that the reduction conditions of the 2% Pt/Al2O3 catalyst35 reduced in presence of H2 at 300 °C for 4 h, which is consistent in the results in Fig. 1c.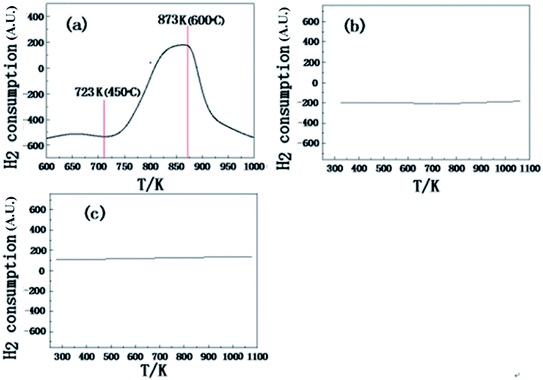 | ||
| Fig. 1 The H2-TPR profiles of the (a) Cu2.0/Al2O3 (before H2 reduction) (b) Cu2.0/Al2O3 (after H2 reduction) and (c) Pt2.0/Al2O3 (after H2 reduction) catalysts. | ||
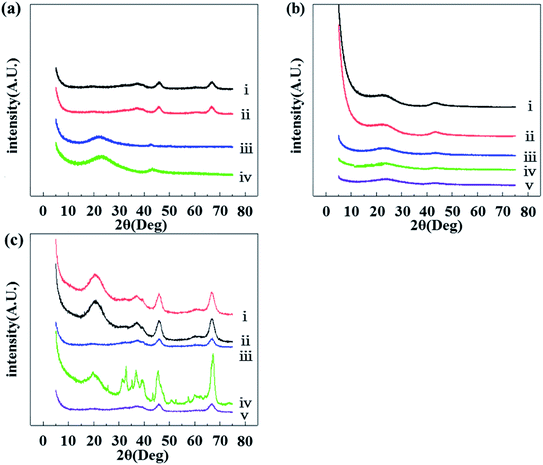
Fig. 2 shows the XRD patterns of some selected catalysts. Inspection of Fig. 2a shows that, compared with the data of the reported standard XRD pattern in Table 2,42–47 both curves (i) and (ii) were correspond to the characteristic peaks of γ-Al2O3. Therefore the main crystal phase of the catalytic supports after calcination was γ-Al2O3. Compared with Fig. 2c, it was found that the peaks of catalyst were changed from sharp to broad, showing that Al2O3 in the catalyst was amorphous alumina. Comparing between pictorial panels Fig. 2a and b, it can be seen that the catalysts with different reduction temperatures had different peak area and width, but the other characteristic peak positions were basically the same. Combined with the H2-TPR results in Fig. 1, it can be further illustrated that the reduction temperature had an effect on the complete reduction of Cu. For curves (ii), (iii), and (iv) in Fig. 2a, the matching characteristic diffraction peaks of Pt and Cu were not obvious. It also indirectly reflects that these components had low crystallinity. In combination with Table 2 which contains the standard peak positions of selected materials, a peak of the Pt–Cu compound indicating that a Pt–Cu alloy was formed, indicating that there was an interaction between the Pt and Cu components. Although the overall metal loadings for the cases of (ii), (iii) and (iv) in Fig. 2a were the same, the catalytic supports were different. Thus the width and area of the PtCu alloy peaks were different. This shows that the degree of the interactions between the Pt and Cu components were different, following the order of Pt–Cu/AC > Pt–Cu/SiO2 > Pt–Cu/Al2O3. Fig. 2b shows that the peak width and intensity of the AC supports in the cases curve (i) and (ii) were basically unchanged before and after pre-calcination, indicating that the AC crystal phase did not have a noticeable change during calcination.
| Peak position | 1 | 2 | 3 | 4 | |
|---|---|---|---|---|---|
| γ-Al2O3 | 2θ/(°) | 37.71 | 39.45 | 45.87 | 66.89 |
| AC | 2θ/(°) | 43.92 | 51.28 | ||
| Pt | 2θ/(°) | 39.79 | 46.28 | 67.53 | |
| Pt1Cu3 | 2θ/(°) | 42.24 | |||
| Pt1Cu1 | 2θ/(°) | 41.01 | |||
| Cu | 2θ/(°) | 43.30 | |||
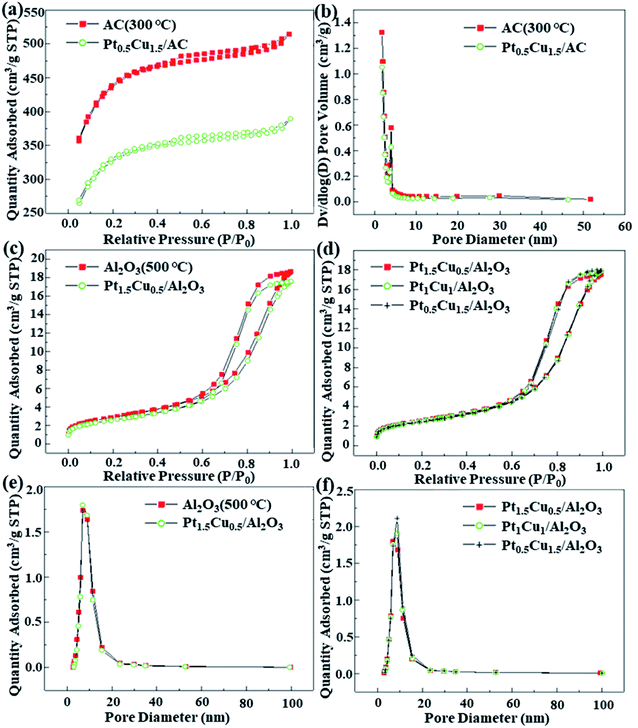
The N2 adsorption–desorption isotherms, calculated BET surface area, average pore diameter and pore volumes of the prepared catalysts are shown in Fig. 3 and in Table 3. It can be noticed that the specific surface area of supports become larger after calcination, indicating that it was necessary to be pre-calcinated for the catalytic supports. As shown in Fig. 3, the nitrogen adsorption/desorption isotherms of the Pt–Cu catalysts on AC/Al2O3 and the calcined AC/Al2O3 supports belonged to the IUPAC IV and H1 type hysteresis loops, respectively. This shows that the catalytic materials were mainly mesoporous in structure and the pore size range was uniformly narrow.48,49 The N2 adsorption of the material becomes smaller after impregnation and metal reduction. The pore size of Pt–Cu/AC obtained from MR and the calcined supports was mainly between 2-4 nm, while the pore size of Pt–Cu/Al2O3 obtained from the H2 reduction and the calcined Al2O3 was between 7–10 nm, as shown in Panels b, e and f in Fig. 3. This was due to AC has a greater specific surface area. The higher loading of Cu the catalyst had, the larger maximum pore diameter of the catalysts was, which may be related to the difference of particle size caused by incomplete reduction of Cu.
| Sample | Specific surface area SBET (m2 g−1) | Total pore volume (cm3 g−1) | Average pore size (nm) |
|---|---|---|---|
| AC (uncalcined) | 1137 | 0.29 | 2.74 |
| AC (calcined at 300 °C, 4 h) | 1415 | 0.30 | 2.71 |
| Pt1.5Cu0.5/AC-MR | 1030 | 0.25 | 2.72 |
| Pt1.0Cu1.0/AC-MR | 1029 | 0.24 | 2.74 |
| Pt0.5Cu1.5/AC-MR | 1028 | 0.23 | 2.76 |
| Pt0.5Cu1.5/Al2O3 | 192 | 0.60 | 8.26 |
| Pt0.5Cu1.5/SiO2 | 437 | 0.14 | 2.56 |
| Al2O3 (uncalcined) | 195 | 0.57 | 7.50 |
| Al2O3 (calcined at 500 °C, 4 h) | 228 | 0.64 | 7.76 |
| Pt2.0/Al2O3 | 216 | 0.62 | 7.85 |
| Pt1.5Cu0.5/Al2O3 | 205 | 0.62 | 7.83 |
| Pt1.0Cu1.0/Al2O3 | 202 | 0.62 | 7.99 |
| Pt0.5Cu1.5/Al2O3 | 202 | 0.61 | 8.05 |
In general, the specific surface area of AC was increased from 1137 m2 g−1 to 1415 m2 g−1 after calcination at 300 °C for 4 h, while the pore volume and average diameter were unchanged. However the specific surface area of Al2O3 increased from 195 m2 g−1 to 228 m2 g−1 after calcination at 500 °C for 4 h, and both of the pore volume and average diameter had a mild increase.
The pore volume and pore diameter of the catalysts with different supports obtained by the two-stage reduction had mild changes, reflecting that the platinum and copper entered the surface and the interior of the catalyst and changed the pore structure and specific surface area of the catalyst. While the difference between the specific surface area of the AC and Pt–Cu/AC was larger than the Al2O3 cases, indicating that AC was somehow destroyed at high temperatures. The specific surface area, pore volume and diameter of the supported Pt and Cu catalysts obtained from the methanal reduction changed little. The reason was that the specific surface area of AC was much larger than that of Al2O3 and SiO2, and the pore volume and pore size are smaller than those of Al2O3 and this reduction method done little damage to the structural. Therefore, the Pt and Cu components were dispersed uniformly. For these catalysts, the order of specific surface area was: AC ≫ SiO2 > Al2O3, and pore volume and pore size was: Al2O3 > AC > SiO2. For Pt–Cu/Al2O3, when reduced at 300 °C and 600 °C in the H2 atmosphere, the specific surface area was reduced from 202 m2 g−1 to 192 m2 g−1. The pore volume was basically unchanged, but the pore diameter was increased. This may be related to the reduction at high temperatures.
The TEM images of the selected catalysts are shown in Fig. 4. For the catalyst obtained from MR, the Pt particle size follows the order of Pt1.0Cu1.0/AC-MR > Pt0.5Cu1.5/AC-MR > Pt1.5Cu0.5/AC-MR > Pt2.0/AC-MR. In all four cases the Pt or PtCu particles were small and uniformly dispersed. The particle size of the Pt particles was in the range of 1–4 nm. In particular, the metal particle size of catalyst Pt2.0/AC-MR mainly distributed in the 1–2 nm range, while those of Pt–Cu/AC catalysts presented a larger range of particle size mainly within 1–4 nm. This may be related to the formation of the Pt–Cu alloy, which made the metal particle size larger. In addition, the amount of Pt–Cu alloy with different loadings could be different, making the Pt particle size different.
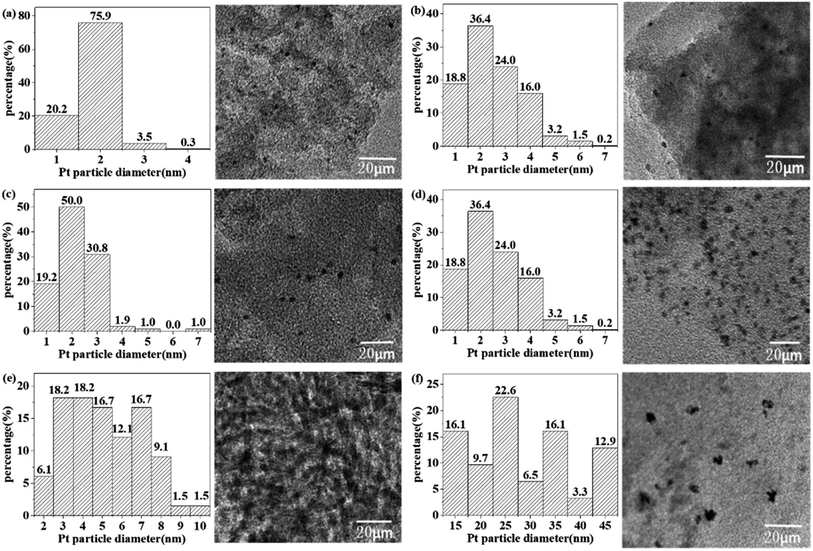 | ||
| Fig. 4 The particle size charts and TEM images of (a) Pt2.0/AC-MR, (b) Pt0.5Cu1.5/AC-MR, (c) Pt1.0Cu1.0/AC-MR, (d) Pt1.5Cu0.5/AC-MR, (e) Pt0.5Cu1.5/SiO2 and (f) Pt0.5Cu1.5/Al2O3. | ||
The choice of catalytic support had a significant influence on the particle size of the active metal component for the catalysts with a same loading. The Pt particle sizes were in the range of 10–50 nm for Pt0.5Cu1.5/Al2O3, being much larger than those for the Pt0.5Cu1.5/SiO2 case (2–8 nm). The Pt particle sizes were uneven for both cases, which was dramatically different to the Pt–Cu/AC cases. The Pt particle size distribution for the Al2O3 and SiO2 cases was wide, which may be related to the nature of the support as well as the reduction method.
As can be seen in the following section about the results of catalytic reaction test, the Pt0.5Cu1.5/AC-MR catalyst presented desirably good catalytic performance. So, more characterization results focusing on the Pt0.5Cu1.5 catalysts were performed, with the results shown in the ESI† including the TG-DSC curves, SEM images and TEM-EDX elemental mappings.
3.3 Catalytic Fenton oxidation of aniline by H2O2
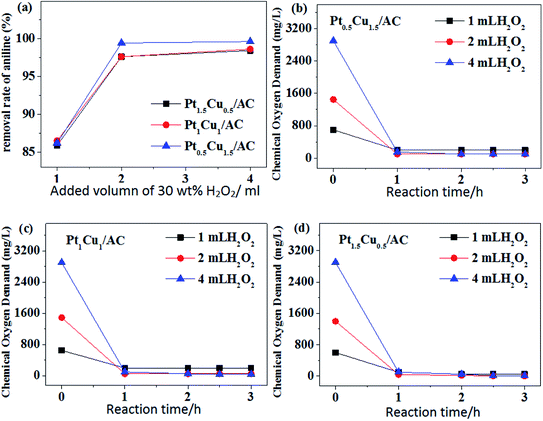
When the amount of H2O2 was small, the amount of ˙OH generated would be also small. On the other hand, the catalyst catalyzed the pure decomposition of H2O2 (see in Fig. 6), making the amount of ˙OH effective for the catalytic oxidation of aniline further smaller. However, when the H2O2 concentration was too high, it also inhibited the production of ˙OH.51 Therefore, there should be a most suitable H2O2 concentration for aniline degradation reaction system, which was 0.098 mol L−1 in this work.
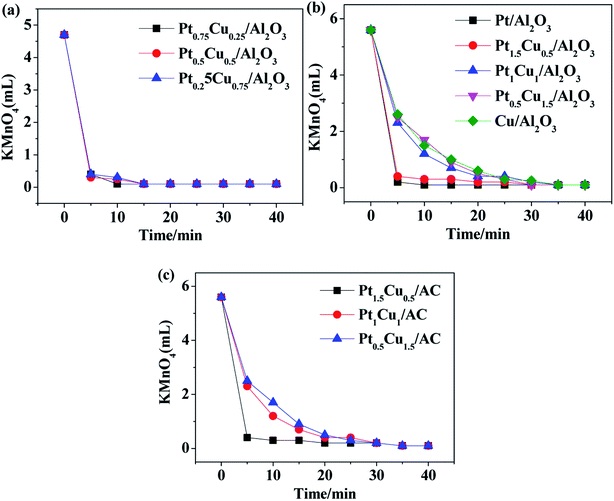
The concentration of H2O2 had a great influence on the COD value, especially in the initial stage of reaction, and thus it also affected the apparent COD removal rate. It can be anticipated that H2O2 will also be decomposed catalytically in the presence of Pt–Cu catalysts, which intrigued us to test the performance of our prepared catalysts for pure decomposition of H2O2 at the absence of aniline in water.
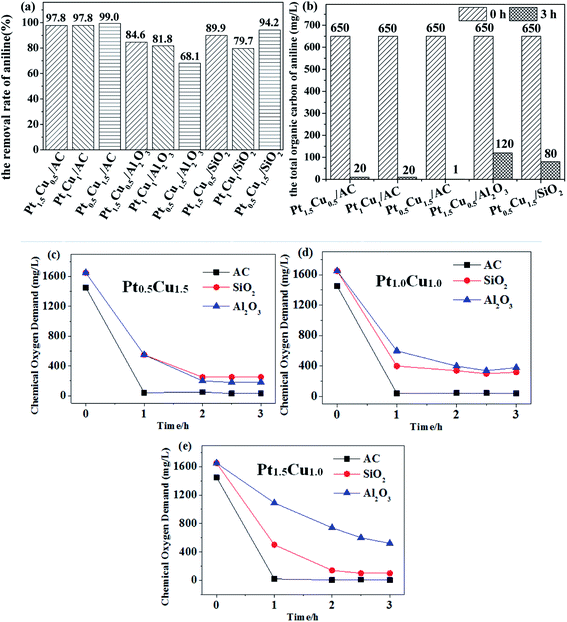
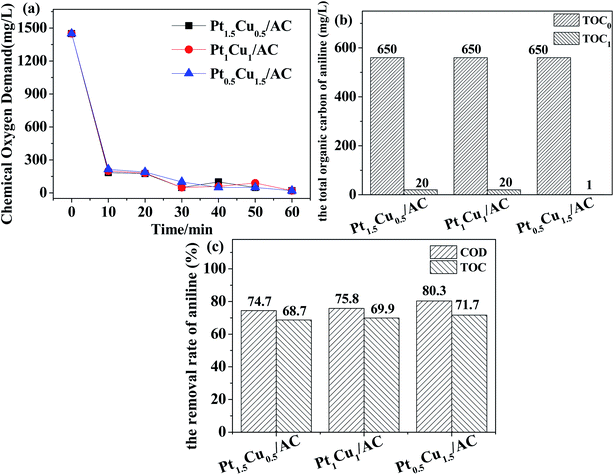
It can be seen from Fig. 6 that for the Pt–Cu/Al2O3 catalysts the influence of the loading amounts of Pt and Cu components prepared under a same reduction method on the catalytic degradation of H2O2 was huge (panel a vs. b). When the loadings of Pt and Cu were fixed, the Pt–Cu bimetal catalysts with different supports carriers also had a great influence on the catalytic degradation of H2O2 (panel b vs. c). For all the Pt–Cu catalysts, the rate of catalytic decomposition of H2O2 always increased with the content of Pt. The decomposition rate of H2O2 was quite slow and basically unchanged after 30 minutes of reaction for all cases. This may be related to the rapid catalytic reaction caused by the high activity of Pt, which may also explain the rapid decrease of COD value during the degradation of aniline for 1 h in Fig. 5.
In general, the results shown in Fig. 7 shows that the performance of the Pt–Cu/AC-MR catalysts for aniline degradation was the best one among three cases of catalytic support. The good TOC removal ability was the same as good capability of mineralization rate of aniline (the efficiency of complete degradation to H2O and COx) for the Pt–Cu/AC-MR catalysts. In contrast, the degradation of aniline by using the Pt–Cu/SiO2 and Pt–Cu/Al2O3 catalysts was often not complete, and aniline may be degraded into other organic molecules which stayed in water. This is further supported by an interesting phenomenon described below.
As can be observed with naked eyes, the aniline solution was transparent almost during the entire degradation process when AC-supported catalysts were used. While SiO2 was used as the catalytic support, the solution became brown quickly. Suspended black materials can be observed in the solution when Al2O3 was used. According to ref. 52, the oxidative degradation of aniline affords compounds in brown at the first stage, and then affords compounds in black, until it was completely degraded. This phenomenon further demonstrated that the choice of catalytic support was important, and the performances for degradation of aniline showed the order of AC > Al2O3 > SiO2. This may be associable with different pore structures in different supports (Table 3), and the reduction method (see in Section 2.2) used affecting the dispersion of Pt and Cu components and generation of Pt, Cu and their alloys (see in Section 3.2).
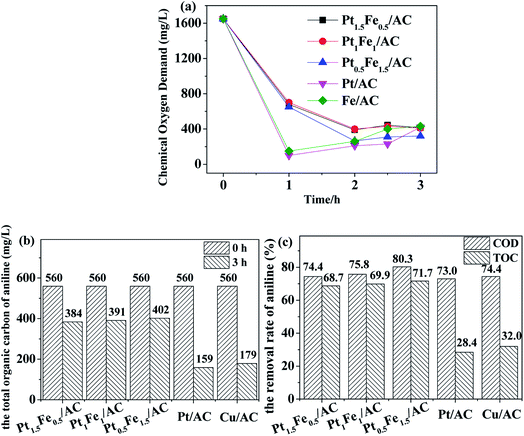
The TOC removal rate was lower than the COD case, indicating that the degradation of aniline was incomplete and some other organic molecules were produced. For the supported monometallic catalysts, COD and TOC removal rate of the Cu/AC catalyst was higher than Pt/AC (Fig. 8b and c). First, the aniline molecules ma be physically adsorbed (vide infra) onto the outer surface of the catalyst and part of them may enter the inner pores, and then were degraded by the catalysis of the active metal components, so the COD value decreased within 1 h. Then, the partly degraded products from aniline returned to the solution after a long time of stirring, leading to the COD value increased slightly again (Fig. 8). Comparison of the results shown in Fig. 8 with those in Fig. 7, it can be seen that the bimetallic Pt–Cu/AC-MR catalysts had a better performance for the catalytic removal of aniline than the monometallic Pt or Cu catalysts, although the overall metal loading were the same.
According to the definition of synergy effect in catalytic chemistry, the formula of synergy index (SI) can be expressed as follows.
 | ||
| Scheme 1 Possible reaction mechanism of the reaction between aniline and H2O2 at the presence of supported bimetallic Pt–Cu catalysts. | ||
The pathways indicted with k1–k3 shown in Scheme 1 result in the oxidative degradation of aniline by reacting with H2O2. However, not all aniline molecules can be directly oxidized to mineralized product of gaseous CO/CO2, and part of the aniline intermediates remained in water, which is accounted for the difference of COD and TOC removal rates. From the catalytic test results shown in Fig. 7 and 8, it can be seen that the catalysts using AC as the support favors k2 and/or k3 over k1 compared to the ones using Al2O3 or SiO2 as supports. The contribution of the physical adsorption processes (k5) should be further noted during the catalytic degradation of aniline with the involvement of AC, as reflected by the results shown in Fig. 8a. Competing with pathways k1–k3, pure catalytic decomposition of H2O2 also occurred. As is known, decomposition of H2O2 to produce reactive intermediate of HO˙radical is key to oxidize aniline, however, not all reactive intermediate can attack aniline or its intermediate, leading to a pure decomposition process. An increasing amount of Pt was advantageous to the H2O2 decomposition (Fig. 6), however, too much Pt component may lead to a larger portion of H2O2 decomposition. A good catalyst should be able to give large k4 and at the same time give large (k1 + k3)/k4. From this point of view, the significant synergic effect of the Pt0.5Cu1.5/AC-MR catalyst may be accounted for its ability to accelerate the rate of H2O2 decomposition (k4), and the rate of aniline oxidation (k1–k3, in particular, k1 and k3) at the same time, with the preference of the latter pathways. A detailed mechanism study of the related catalytic systems are undergoing in our group.
| Catalyst | TOC or COD removal | Conditions | References |
|---|---|---|---|
| Pt0.5Cu1.5/AC-MR | Up to 99% TOC removal | 50 °C, 5 g L−1 catalyst, 500 mg L−1 aniline, 0.098 mol L−1 H2O2, 60 min | This work |
| 5% Ru/SiO2 | 90% COD | 200–220 °C, 0.69 MPa O2, 1.33 g L−1 catalyst, 500 ppm aniline, 120 min | 53 |
| Ru/Ti0.9Zr0.1O2 | 84.6% COD | 180 °C, 1.5 MPa O2, 4 g L−1 catalyst, 2 g L−1 aniline, 300 min | 54 |
| PAC@FeIIFe2IIIO4 | 71.2% aniline | 25 °C, pH = 6, UV + 5 mmol L−1H2O2, 0.3 g L−1 catalyst, 120 mg L−1 aniline, 180 min | 55 |
| 10 mg L−1 Fe2+ | 78% COD | 25 °C, pH = 8, 2.08 mg min−1 L−1O3, 10 mg L−1 catalyst, 75 mg L−1 AAF, 180 min | 56 |
Co/Fe(3![[thin space (1/6-em)]](https://www.rsc.org/images/entities/char_2009.gif) : :![[thin space (1/6-em)]](https://www.rsc.org/images/entities/char_2009.gif) 1)-LDH 1)-LDH |
88% COD | 70 °C, pH = 12, 400 mL min− 1 O3, 12.5 g L−1 catalyst, 960 mg L−1 initial COD, 180 min | 57 |
4. Conclusion
This paper reports a systematic investigation of the supported Pt–Cu bimetallic catalysts prepared with various impregnation methods, and their performances for catalytic Fenton oxidation of aniline in water as well. Various preparation conditions including impregnation amount, bimetallic type, impregnation ratio of two metals, reduction temperature, reduction method, and types of catalytic support were changed to obtain different supported catalysts. In particular, the methanal reduction (MR) method developed in this work was reported for the first time to the best of our knowledge.The XRF analysis results revealed that the MR method led to more metal lost on Pt–Cu/AC than the H2 reduction method, but the particle diameter was rather small (concentrated in the <3 nm range, by TEM) for the former case. The XRD analysis results disclosed that Pt–Cu alloy can be formed in the bimetallic catalysts. However, the crystal phase of AC was destroyed the specific surface area and was decreased significantly, and the pore volume was slightly increased. The results of BET show that the specific surface area of the catalyst supported on AC was significantly larger than that of Al2O3 and SiO2.
Pt0.5Cu1.5/AC-MR presented the highest activity for catalytic degradation of aniline (500 mg L−1) in the neutral aqueous solution among all catalysts examined. The catalytic test results showed that the liquid pollutant was almost completely degraded within 60 minutes at the presence of 0.098 mol L−1 H2O2 using this catalyst. The performance of Pt0.5Cu1.5/AC-MR was much better than Pt/AC and Cu/AC under the same preparation and reaction conditions, which showed that there was a significant synergic effect between the Pt and Cu components. The synergic effect may lead to an improvement of catalytic efficiency by 212% in this case in terms of TOC removal rate. This effect could play a pivotal role for the degradation of aniline and also provide potential hopefulness for future industrial application.
Author contributions
Qiuyue Ding: catalyst preparation, characterization, reaction test, writing. Wumin Zhang: catalyst preparation, reaction test, analysis, writing. Yuanyuan Zhu: catalyst preparation, characterization. Lu Wang: catalyst preparation, reaction test. Yanyan Xi: catalyst preparation, characterization, discussion. Xufeng Lin: idea development, research funding provision, writing and organization. Xiyuan Feng: catalyst preparation, reaction setup construction.Conflicts of interest
There are no conflicts to declare.Acknowledgements
Support from the National Natural Science Foundation of China (21576291), and Shandong Province Natural Science Foundation (ZR2014BM002) is gratefully acknowledged.References
- S. Shi, J. Cao, L. Feng, W. Liang and L. Zhang, Chin. J. Environ. Eng., 2015, 9, 4871–4876 Search PubMed.
- S. Jiang, J. Zhu, S. Bai, Y. Guan and J. Yao, Desalin. Water Treat., 2016, 57, 791–798 CrossRef CAS.
- J. Xiang, Z. Zhang, H. Fan and S. Lv, Environ. Sci. Technol., 2010, 33, 81–85 CAS.
- S. Vimalnath, H. Ravishankar, C. Schwandt, R. V. Kumar and S. Subramanian, Water Sci. Technol., 2018, 78, 290–300 CrossRef CAS PubMed.
- W. W. Eckenfelder, Stud. Environ. Sci., 1986, 29, 43–50 CAS.
- B. Wang, X. Wu, Y. Luo and Y. Liu, Ind. Water Treat., 2015, 35, 93–95 CAS.
- M. Kiel, D. Dobslaw and K. H. Engesser, Water Res., 2014, 66, 1–11 CrossRef CAS PubMed.
- C. Comninellis, Electrochim. Acta, 1994, 39, 1857–1862 CrossRef CAS.
- X. Nie, T. Huang, J. Zhang, S. Zhang, H. Chen, L. Ding and L. Liu, Huanjing Kexue, 2012, 32, 274–278 CAS.
- J. Yoon, Y. Lee and S. Kim, Water Sci. Technol., 2001, 44, 15–21 CrossRef CAS PubMed.
- W. Z. Tang and C. P. Huang, Environ. Technol., 1996, 17, 1371–1378 CrossRef CAS.
- W. Y. Zhao, X. F. Zheng, L. W. Xu and G. Y. Yang, Adv. Mat. Res., 2013, 726, 1710–1714 Search PubMed.
- Z. Y. Li, W. Song and L. Zhang, Adv. Mat. Res., 2013, 781, 2184–2188 Search PubMed.
- Y. H. Huang, Y. F. Huang, P. S. Chang and C. Y. Chen, J. Hazard. Mater., 2008, 154, 655–662 CrossRef CAS PubMed.
- Y. Jing and B. P. Chaplin, Environ. Sci. Technol., 2017, 51, 2355–2365 CrossRef CAS PubMed.
- C. Lee, J. Yoon and U. V. Gunten, Water Res., 2007, 41, 581–590 CrossRef CAS PubMed.
- N. A. Landsman, K. L. Swancutt, C. N. Bradford, C. R. Cox, J. J. Kiddle and S. P. Mezyk, Environ. Sci. Technol., 2007, 41, 5818–5823 CrossRef CAS PubMed.
- S. A. Wang, Dyes Pigm., 2008, 76, 714–720 CrossRef CAS.
- F. Velichkova, H. Delmas, C. Julcour and B. Koumanova, AIChE J., 2017, 63, 669–679 CrossRef CAS.
- J. J. Pignatello, Environ. Sci. Technol., 1992, 26, 944–951 CrossRef CAS.
- J. Sun, X. Li, J. Feng and X. Tian, Water Res., 2009, 43, 4363–4369 CrossRef CAS PubMed.
- S. T. Yang, W. Zhang, J. Xie, R. Liao, X. Zhang, B. Yu, R. Wu, X. Liu, H. Li and Z. Guo, RSC Adv., 2015, 5, 5458–5463 RSC.
- S. T. Christensen, H. Feng, J. L. Libera, N. Guo, J. T. Miller, P. C. Stair and J. W. Elam, Nano Lett., 2010, 10, 3047–3051 CrossRef CAS PubMed.
- Y. H. Huang, C. C. Su, Y. P. Yang and M. C. Lu, Environ. Prog. Sustain. Energy, 2013, 32, 187–192 CrossRef CAS.
- J. Choi, J. H. Jeong and J. Chung, Chem. Eng. J., 2013, 218, 260–266 CrossRef CAS.
- Z. Huang, Z. Chen, Y. Chen and Y. Hu, Chemosphere, 2018, 203, 442–449 CrossRef CAS PubMed.
- Z. Han, Y. Dong and S. Dong, J. Hazard. Mater., 2011, 189, 241–248 CrossRef CAS PubMed.
- I. Yamanaka and Y. Nabae, Adv. Sci. Technol., 2006, 45, 2067–2076 CAS.
- A. Ciftci, M. D. A. J. Ligthart, O. A. Sen, V. A. J. F. Hoof, H. Friedrich and E. J. M. Hensen, J. Catal., 2014, 311, 88–101 CrossRef CAS.
- Y. Liu, G. Zhang, S. Fang, S. Chong and J. Zhu, J. Environ. Manage., 2016, 182, 367–373 CrossRef CAS PubMed.
- C. Vidya, C. Manjunatha, M. N. Chandraprabha, M. Rajshekar and M. A. L. A. Raj, J. Environ. Chem. Eng., 2017, 5, 3172–3180 CrossRef CAS.
- Y. S. González, C. Costa, M. C. Márquez and P. Ramos, J. Hazard. Mater., 2011, 187, 101–112 CrossRef PubMed.
- J. D. Zeeuw, D. R. C. M. Nijs and L. T. Henrich, J. Chromatogr. Sci., 1987, 25, 71–83 Search PubMed.
- Y. Xie, Y. Zhu, B. Zhao and Y. Tang, Stud. Surf. Sci. Catal., 1998, 118, 441–449 CrossRef CAS.
- M. Ciobanu, G. Petcu, E. M. Anghel, F. Papa, N. G. Apostol, D. C. Culita, I. Atkinson, S. Todorova, M. Shopska, A. Naydenov, R. Velinova and V. Parvulescu, Appl. Catal., A, 2021, 619, 118123 CrossRef CAS.
- M. Zhang, S. Cai, J. Li, E. A. Elimian, J. Chen and H. Jia, J. Hazard. Mater., 2021, 412, 125266 CrossRef CAS PubMed.
- Y. Zhou, D. Liu, W. Qiao, Z. Liu, J. Yang and L. Feng, Materials Today Physics, 2021, 17, 100357 CrossRef CAS.
- Z. Lan, Y. Yu, H. Li, L. Zhang and Y. Cao, Mater. Sci. Semicond. Process., 2021, 123, 105547 CrossRef CAS.
- Y. Xi, J. Xiao, X. Lin, W. Yan, C. Wang and C. Liu, Ind. Eng. Chem. Res., 2018, 57, 10137–10147 CrossRef CAS.
- X. Li, X. You, P. Ying, J. Xiao and C. Li, Top. Catal., 2003, 25, 63–70 CrossRef CAS.
- C. E. Huckaba and F. G. Keyes, J. Am. Chem. Soc., 1948, 70, 1640–1644 CrossRef CAS PubMed.
- P. Shafiee, S. M. Alavi and M. Rezaei, J. Energy Inst., 2021, 96, 1–10 CrossRef CAS.
- N. Ji, Z. Liu, X. Diao, J. Bao, Z. Yu, C. Song, Q. Liu, D. Ma and X. Lu, Mol. Catal., 2020, 495, 111155–111163 CrossRef CAS.
- A. H. Valekar, K. R. Oh, S. K. Lee and Y. K. Hwang, J. Ind. Eng. Chem., 2021, 101, 66–77 CrossRef CAS.
- H. Lee, W. I. Kim, K. D. Jung and H. L. Koh, Korean J. Chem. Eng., 2017, 34, 1337–1345 CrossRef CAS.
- X. Zhang, N. He, C. Liu and H. Guo, Catal. Letters, 2019, 149, 974–984 CrossRef CAS.
- W. Wang, K. Nakagawa, T. Yoshikawa, T. Masuda, E. Fumoto, Y. Koyama, T. Tago and H. Fujitsuka, Appl. Catal. A Gen., 2021, 619, 118152–118160 CrossRef CAS.
- M. H. Stacey, Stud. Surf. Sci. Catal., 1988, 39, 55–65 CrossRef.
- A. V. Neimark, Stud. Surf. Sci. Catal., 1991, 62, 67–74 CrossRef.
- S. S. Lin and M. D. Gurol, Water Sci. Technol., 1996, 34, 57–64 CrossRef CAS.
- G. T. Chi and K. D. Huddersman, J. Adv. Oxid. Technol., 2011, 14, 235–243 CAS.
- M. Martinez, A. Irabien, A. R. Arnaiz and C. Santiago, J. Therm. Anal. Calorim., 1984, 29, 251–255 CrossRef CAS.
- G. R. Reddy and V. V. Mahajani, Ind. Eng. Chem. Res., 2005, 44, 7320–7328 CrossRef CAS.
- M. Song, Y. Wang, Y. Guo, L. Wang, W. Zhan, Y. Guo and G. Lu, Chin. J. Catal., 2017, 38, 1155–1165 CrossRef CAS.
- M. Ahmadi, B. Kakavandi, S. Jorfi and M. Azizi, J. Photochem. Photobiol., 2017, 336, 42–53 CrossRef CAS.
- P. Fu, L. Wang, G. Li, Z. Hou and Y. Ma, J. Environ. Chem. Eng., 2020, 8, 103714–103721 CrossRef CAS.
- Y. Qi, C. Guo, X. Xu, B. Gao, Q. Yue, B. Jiang, Z. Qian, C. Wang and Y. Zhang, Sci. Total Environ., 2020, 715, 136982–136994 CrossRef CAS PubMed.
Footnotes |
| † Electronic supplementary information (ESI) available. See DOI: 10.1039/d1ra05762f |
| ‡ These authors contributed equally to this paper. |
| This journal is © The Royal Society of Chemistry 2021 |

