 Open Access Article
g-C3N4/ZnCdS heterojunction for efficient visible light-driven photocatalytic hydrogen production†
Tianyu Bai‡
a,
Xiaofan Shi‡a,
Ming Liua,
Hui Huanga,
Jijie Zhang *ab and
Xian-He Bu
 abc
abc
aSchool of Materials Science and Engineering, National Institute for Advanced Materials, Nankai University, Tianjin 300350, P. R. China. E-mail: zhangjijie@nankai.edu.cn; buxh@nankai.edu.cn
bFrontiers Science Center for New Organic Matter, Nankai University, Tianjin 300350, P. R. China
cState Key Laboratory of Elemento-Organic Chemistry, College of Chemistry, Nankai University, Tianjin 300071, P. R. China
First published on 26th November 2021
Abstract
To suppress the aggregation behavior caused by the high surface energy of quantum dots (QDs), ZnCdS QDs were grown in situ on a g-C3N4 support. During the growth process, the QDs tightly adhered to the support surface. The ZnCdS QDs were prepared by low-temperature sulfurization and cation exchange with a zeolitic imidazolate framework precursor under mild conditions. The heterojunction of g-C3N4/ZnCdS-2 (CN/ZCS-2, with a g-C3N4 to ZIF-8 ratio of 2.0) not only showed excellent optical absorption performance, abundant reactive sites, and a close contact interface but also effectively separated the photogenerated electrons and holes, which greatly improved its photocatalytic hydrogen production performance. Under visible light irradiation (wavelength > 420 nm) without a noble metal cocatalyst, the hydrogen evolution rate of the CN/ZCS-2 heterojunction reached 1467.23 μmol g−1 h−1, and the durability and chemical stability were extraordinarily high.
With the continuous advancement of global industrialization and rapid development of the global economy, fossil energy is being consumed at an increasingly steep rate. This uncontrolled usage has caused many irreversible environmental problems, including global warming, ozone layer destruction, and acid rain.1 To promote the green and sustainable development of the society, various clean renewable energy sources such as solar energy, tidal energy, wind energy, biomass energy, and hydrogen energy have been developed in succession. Solar energy is a universal, sustainable, abundant, and environmentally friendly renewable energy.2 Hydrogen is another clean energy source (combustion product = water) with a high energy density (122 kJ g−1). Therefore, hydrogen is considered as a great alternative to fossil fuels,3 and photocatalytic hydrogen production technology is among the most effective solutions to the above problems. Photocatalytic water splitting based on TiO2 and Pt electrodes was first reported by Fujishima and Honda in 1972,4 sparking great interest in photocatalytic hydrogen production from semiconductor materials. Many remarkable achievements have been made in the past decades.
Among various photocatalysts, Zn1−xCdxS solid solution is widely used in photocatalytic hydrogen production because it strongly responds to visible light and has an adjustable band gap. However, when used alone, this common semiconductor is prone to photo-corrosion and photogenerated carrier recombination.5 Moreover, the low specific surface area of Zn1−xCdxS synthesized by conventional methods impedes the photocatalytic process. A material's photocatalytic activity notably depends on its size or morphology, and the rational design and preparation of ideal nanostructured transition metal sulfides are of practical significance.
Quantum dots (QDs) are zero-dimensional semiconductor nanomaterials, which possess high visible light absorption coefficients, large specific surface area, a size quantization property, and high stability.6 The size quantization property of QDs means that the optical band gap is tunable with respect to size, shape, and composition.7 In kinetic studies, the electron transfer rate constant is higher in smaller QDs than in larger QDs, indicating that electrons can be transported more quickly in small QDs.7 Most of the current QDs preparation methods require complex reaction devices, harsh reaction conditions, or a long reaction time. They may also generate toxic by-products. Against this background, an environmentally friendly and convenient method for Zn1−xCdxS QDs fabrication is urgently sought.8,9
At present, QDs are prepared from metal–organic frameworks (MOFs) precursors.10–12 MOFs are inorganic–organic hybrid materials bridged by metal clusters and organic ligands.13 Many studies have found that MOF templates or precursors largely retain the characteristics of the original MOFs; moreover, they can be converted into carbon/metal-based porous materials with higher stability and conductivity than pristine MOF materials.14 The MOF-derived porous materials achieve a larger specific surface area, higher porosity, and more uniform heteroatom doping than traditional catalysts.15 Therefore, many MOF-derived porous materials provide better photocatalytic performance than their original MOFs. Unlike most MOF materials, zeolite imidazolate framework (ZIF-8) can be simply synthesized at a high yield under mild conditions. With a metal center of Zn2+,16 ZIF-8 is used as the precursor in the preparation of Zn1−xCdxS QDs. However, the QDs inevitably aggregate owing to their high surface energy, which reduces the specific surface area and adversely affects the photocatalytic performance.17 To prevent QDs' agglomeration, this work proposes the in situ growth of ZIF-8 on a graphitic-phase carbon nitride (g-C3N4) substrate.
g-C3N4 is a polymer semiconductor with a band gap of approximately 2.7 eV, which absorbs visible light. As g-C3N4 contains only C and N elements, it can be prepared at a low cost; moreover, its aromatic C–N heterocyclic structure and strong interlayer van der Waals forces confer high thermal and chemical stability and the flexible structure to load various nanoparticles.18 Therefore, porous g-C3N4 with large specific surface area was selected as the compounding substrate. Like many single-component photocatalysts, ZnCdS undergoes rapid recombination of its photogenerated charge carriers, which greatly reduces the photocatalytic hydrogen production activity.19 Besides preventing QD agglomeration, the g-C3N4/Zn1−xCdxS heterojunction can effectively prolong the charge lifetime.
To prevent QDs' aggregation and effectively separate the photoexcited electron–hole pairs, ZIF-8 was grown in situ in the presence of a g-C3N4 carrier, and a g-C3N4/ZnCdS heterojunction nanocomposite was synthesized through low-temperature sulfurization and cation exchange strategies. The optimized sample achieved the highest photocatalytic hydrogen yield and superior chemical stability under visible light irradiation (wavelength > 420 nm) without any noble metal catalyst.
Scheme 1 describes the preparation process of g-C3N4/ZnCdS. First, g-C3N4 was synthesized from urea by a facile template-free method with two pyrolysis steps. As is well known, g-C3N4 can be simply synthesized by pyrolysis polymerization of some nitrogen-rich precursors. The precursors and reaction parameters of the preparation process largely influence the crystallinity and energy band structure of g-C3N4. Recently, g-C3N4 from urea precursor has been shown to form a porous morphology, which provides a high specific surface area and abundant reactive sites.20,21 Exploiting the affinity of g-C3N4 for Zn2+, the proposed method grew ZIF-8 nanocrystals in situ on porous g-C3N4. During this process, an appropriate amount of triethylamine was added to regulate the ZIF-8 crystal size. When the ZIF-8 size is constrained, the small MOF particles are more evenly distributed on the porous g-C3N4. To optimize the ratio of g-C3N4 and ZIF-8, the g-C3N4/ZIF-8 samples were prepared at different ratios. The g-C3N4/ZnS nanocomposite was then prepared by low-temperature vulcanization. When the ZIF-8 framework collapsed, the obtained ZnS QDs grew uniformly on the g-C3N4 surface. Because ZnS and CdS have similar lattice structures and coordination modes, a Cd source was added for cation exchange to form the g-C3N4/ZnCdS heterostructure. The band structure of ZnCdS can be precisely controlled by adjusting the molar ratio of Zn to Cd.
The crystal phase of the obtained g-C3N4 was monitored by powder X-ray diffraction (PXRD) (Fig. 1). The low-angle reflection peak at 12.89° originated from the crystal plane parallel to the c-axis; meanwhile, in bulk g-C3N4, the strongest peak at 27.53° reflected the characteristic interlayer stacking of the aromatic system.22 The SEM pictures demonstrated the porous structure of g-C3N4 (Fig. S1†). When ZIF-8 was synthesized on the g-C3N4 surface, obvious MOF diffraction peaks were observed at low angles. When the ZIF-8 loading increased, the diffraction peaks of g-C3N4 became inconspicuous. The vulcanized ZIF-8 presented three obvious diffraction peaks at 27.84°, 47.73°, and 56.91° corresponding to the (111), (220), and (311) crystal planes of ZnS, respectively. After the cation exchange process, the corresponding diffraction peaks in the PXRD pattern intensified as the ZnCdS loading increased. The PXRD results implied that g-C3N4 and ZnCdS maintained their own phases in the g-C3N4/ZnCdS composites. The specific composition of samples were shown in Table S1.†
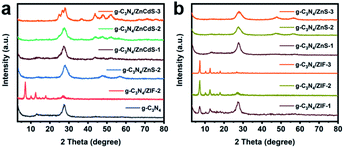 | ||
| Fig. 1 (a) PXRD patterns of g-C3N4, g-C3N4/ZIF-8-2, g-C3N4/ZnS-2 and g-C3N4/ZnCdS; (b) PXRD patterns of g-C3N4/ZIF-8 and g-C3N4/ZnS. | ||
To characterize their microscopic morphology and lattice parameters, the samples were examined under a transmission electron microscope (TEM) (Fig. 2 and S2†). As shown in Fig. S2(a),† g-C3N4 formed a porous morphology and displayed a structure similar to thin nanosheets. After in situ loading on g-C3N4 nanoparticles, the ZIF-8 particles were approximately 20 nm wide, much smaller than ZIF-8 nanoparticles synthesized alone (without trimethylamine) (Fig. S2(b)†). The TEM images also suggested a close connection between ZIF-8 and porous g-C3N4 and the uniform loading of ZIF-8 crystals on the porous g-C3N4 surfaces. From the TEM and high-resolution TEM (HRTEM) images of g-C3N4/ZnS, the lattice spacing of ZnS was determined as 0.311 nm, and the ZnS as uniformly distributed (Fig. S2(c) and (d)†). Moreover, from increasing the amount of Zn source precursor obviously increased the ZnCdS content on g-C3N4 (Fig. 2(a)–(c)). When the load capacity was excessive, the porous g-C3N4 nanoparticles tended to bend. As shown in Fig. 2(d), the lattice fringes of ZnCdS was 0.320 nm which corresponding to the (111) facet of cubic ZnCdS. In the TEM and HRTEM images of ZnCdS QDs (Fig. S3†), the nanoparticles were sized approximately 5 nm and seriously aggregated. When the ZnCdS QDs were directly vulcanized with ZIF-8 at low temperature, the ZnCdS QDs grown on the g-C3N4 surface were notably more separated. TEM mapping results proved that all elements distribute evenly in the samples (Fig. S4–S6†).
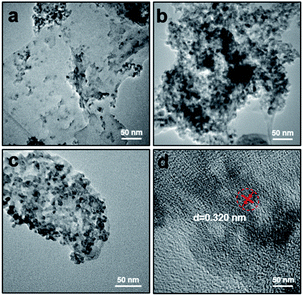 | ||
| Fig. 2 TEM images of (a) g-C3N4/ZnCdS-1, (b) g-C3N4/ZnCdS-3, (c) g-C3N4/ZnCdS-2; (d) high-resolution TEM (HRTEM) image of g-C3N4/ZnCdS-2. | ||
The optical and physical properties of the samples were measured using solid ultraviolet-visible (UV-vis) diffuse reflectance spectroscopy (Fig. 3(a)). The spectral absorptions of the three samples (g-C3N4, g-C3N4/ZIF-8-2, and g-C3N4/ZnS-2) at λ = 430 nm were very similar and corresponded to a band gap of 2.88 eV. However, the spectrum of Cd-doped g-C3N4/ZnS presented two absorption peaks in the visible region corresponding to the absorptions of g-C3N4 and ZnCdS. These absorption peaks were red-shifted with increasing loading of ZnCdS QDs on the porous g-C3N4 surface.
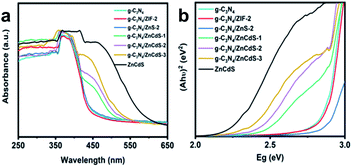 | ||
| Fig. 3 (a) UV-vis spectra and (b) Tauc plots of g-C3N4, g-C3N4/ZIF-8-2, g-C3N4/ZnS-2, g-C3N4/ZnCdS, and ZnCdS. | ||
Applying the Kubelka–Munk formula, the Tauc plots of the samples were calculated from the UV-vis data and are plotted in Fig. 3(b). As the loading capacity of ZnCdS increased, the band gap of g-C3N4/ZnCdS (CN/ZCS) was significantly narrowed from 2.45 eV to 2.35 eV.
The surface chemical states of g-C3N4 and CN/ZCS were investigated with X-ray photoelectron (XPS) spectroscopy (Fig. 4). In the XPS full survey spectrum, the main elements in the composites were C, N, Zn, Cd, and S, as expected (Fig. 4(a)). In XPS measurements of the g-C3N4 and CN/ZCS-2 samples (g-C3N4 to ZIF-8 ratio = 2.0), the binding energies of C 1s, N 1s, Zn 2p, Cd 3d, and S 2p were slightly shifted, suggesting that charge transfer occurred between porous g-C3N4 and ZnCdS QDs. The C 1s signal (284.6 eV) was used as the reference peak for charge correction on the fine spectra of the other elements. In the C 1s spectrum (Fig. 4(b)) of g-C3N4 presented peaks at 284.6 and 288.1 eV, which were ascribed to sp2 C![[double bond, length as m-dash]](https://www.rsc.org/images/entities/char_e001.gif) C bonds and to sp2-bonded carbon in the N-containing aromatic rings (N–C
C bonds and to sp2-bonded carbon in the N-containing aromatic rings (N–C![[double bond, length as m-dash]](https://www.rsc.org/images/entities/char_e001.gif) N), respectively. In the C 1s spectrum of CN/ZCS, the peak ascribed to the sp2 C
N), respectively. In the C 1s spectrum of CN/ZCS, the peak ascribed to the sp2 C![[double bond, length as m-dash]](https://www.rsc.org/images/entities/char_e001.gif) C bonds decreased due to the electron-withdrawing effect of ZnCdS QDs on g-C3N4.23 The N 1s XPS spectrum of g-C3N4 contained three components at 398.5, 399.8, and 401.1 eV, corresponding to the bi-coordinated sp2-hybridized nitrogen C–N
C bonds decreased due to the electron-withdrawing effect of ZnCdS QDs on g-C3N4.23 The N 1s XPS spectrum of g-C3N4 contained three components at 398.5, 399.8, and 401.1 eV, corresponding to the bi-coordinated sp2-hybridized nitrogen C–N![[double bond, length as m-dash]](https://www.rsc.org/images/entities/char_e001.gif) C groups of triazine rings, tertiary nitrogen groups (N3C nitrogen atoms), and nitrogen bonded with hydrogen atoms in N–Hx functional groups, respectively (Fig. 4(c)).24 In the fine spectrum of Zn 2p, the two peaks at binding energies of 1044.3 and 1021.3 eV were the characteristic peaks of the oxidation state of Zn2+ (Fig. 4(d)).25 The normalized high-resolution Cd 3d spectra presented two characteristic peaks at 411.7 and 404.9 eV, which were attributed to Cd2+ 3d3/2 and Cd2+ 3d5/2, respectively (Fig. 4(e)).26 The binding energies of S2− 2p1/2 and S2− 2p3/2 in ZnCdS were 162.6 and 161.4 eV, respectively.27 These results are consistent with previous reports. Moreover, in the CN/ZCS nanocomposite, the binding energies of C 1s and N 1s were clearly shifted (by approximately 0.1 eV) towards high binding energies, while the binding energies of Zn 2p, Cd 3d, and S 2p were shifted downward (by approximately 0.2 eV) from those of pristine g-C3N4 and ZnCdS. These shifts can be attributed to changes in the surface electron density (partial electron transfer from ZnCdS to g-C3N4). Such results indicate a strong electronic interaction between ZnCdS QDs and g-C3N4, suggesting the successful formation of the heterojunction.28
C groups of triazine rings, tertiary nitrogen groups (N3C nitrogen atoms), and nitrogen bonded with hydrogen atoms in N–Hx functional groups, respectively (Fig. 4(c)).24 In the fine spectrum of Zn 2p, the two peaks at binding energies of 1044.3 and 1021.3 eV were the characteristic peaks of the oxidation state of Zn2+ (Fig. 4(d)).25 The normalized high-resolution Cd 3d spectra presented two characteristic peaks at 411.7 and 404.9 eV, which were attributed to Cd2+ 3d3/2 and Cd2+ 3d5/2, respectively (Fig. 4(e)).26 The binding energies of S2− 2p1/2 and S2− 2p3/2 in ZnCdS were 162.6 and 161.4 eV, respectively.27 These results are consistent with previous reports. Moreover, in the CN/ZCS nanocomposite, the binding energies of C 1s and N 1s were clearly shifted (by approximately 0.1 eV) towards high binding energies, while the binding energies of Zn 2p, Cd 3d, and S 2p were shifted downward (by approximately 0.2 eV) from those of pristine g-C3N4 and ZnCdS. These shifts can be attributed to changes in the surface electron density (partial electron transfer from ZnCdS to g-C3N4). Such results indicate a strong electronic interaction between ZnCdS QDs and g-C3N4, suggesting the successful formation of the heterojunction.28
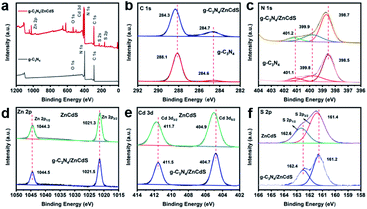 | ||
| Fig. 4 (a) XPS survey spectra of g-C3N4 and g-C3N4/ZnCdS; (b–f) high-resolution XPS of C 1s, N 1s, Zn 2p, Cd 3d, and S 2p, respectively. | ||
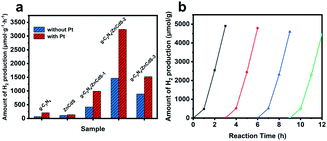
The photocatalytic H2 production performances of the as-synthesized samples were determined in photoactive tests under visible light irradiation (λ > 420 nm) with sacrificial Na2S/Na2SO3. As shown in Fig. 5(a), the H2 production rates of g-C3N4 and ZnCdS were 72.46 and 110.51 μmol g−1 h−1, respectively, in the absence of any noble-metal co-catalyst. After the formation of the CN/ZCS nanocomposites, the H2 evolution from the CN/ZCS heterojunction resembled a volcanic peak as the ZnCdS QDs loading increased. In the CN/ZCS-2 sample with the highest activity, the production rate reached 1467.23 μmol g−1 h−1. The activities of samples loaded with a cocatalyst (Pt nanoparticles introduced by photodeposition) were also evaluated. The cocatalyst significantly improved the performance of all samples, and the activity of CN/ZCS-2/Pt reached 3245.18 μmol g−1 h−1. Next, the cycle stability and durability of CN/ZCS-2 were examined in four consecutive photocatalytic hydrogen production cycle tests under visible light irradiation (total test time = 12 h). The results are shown in Fig. 5(b). After four cycles, the photocatalytic activity of the CN/ZCS-2 heterojunction had only negligibly decreased, indicating the high stability of the photocatalyst. Subsequently, the recycled photocatalyst was re-characterized by PXRD and HRTEM. The CN/ZCS-2 photocatalyst almost retained its original structure and morphology, and its crystallinity was intact (Fig. S7 and S8†). The above experimental results prove the excellent durability and stability of CN/ZCS-2. The apparent quantum yield (AQY) of samples are shown in Table S2.† The g-C3N4/ZCS-2 exhibit the highest AQY value, matching well with the results of photocatalytic hydrogen productions.
To understand the photoactivity enhancement in CN/ZCS-2, the N2 adsorption–desorption isotherm and its corresponding differential curve was acquired. g-C3N4 is usually obtained by the traditional one-step pyrolysis method, but the present g-C3N4 nanoparticles were synthesized by secondary pyrolysis of urea, which boosted their specific surface area to 86.17 m2 g−1 (Fig. S9†).29 However, the specific surface area of CN/ZCS-2 was approximately 77.94 cm2 g−1 (Brunauer–Emmett–Teller test), lower than that of pristine g-C3N4 nanoparticles. These data suggest that the change in the active surface area did not dominantly promote photocatalytic performance.
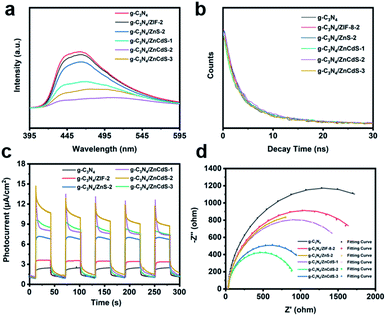
To explore the separation and transfer efficiency of the photogenerated electrons and holes in CN/ZCS-2, the influence of the photogenerated carrier behavior at the resulting heterojunction structure was investigated by photoluminescence (PL) spectroscopy. The semiconductor generated carriers when excited by light. Electrons and holes in their conduction band (CB) and valence band (VB) reach the quasi-equilibrium state through a relaxation process. During recombination, the electrons and holes emit light of different wavelengths. A strong PL peak denotes a high recombination rate of electron–hole pairs, meaning a low separation efficiency.30 As the loading content of ZnCdS increases, the PL intensity of the CN/ZCS heterojunction first decreases and then increased (Fig. 6(a)). The fluorescence intensity was relatively strong in pure g-C3N4, g-C3N4/ZIF-2, and g-C3N4/ZnS, but weak in CN/ZCS-2. This result shows that the CN/ZCS-2 sample promoted the separation of photoinduced charge carriers to effectively utilize the sunlight. To further clarify the merits of the CN/ZCS heterojunction, the fluorescence lifetimes of the samples were measured by time-resolved fluorescence spectroscopy. The fitting results are shown in Fig. 6(b) and Table S3.† In general, a longer emission lifetime implies a longer carrier migration distance and slower annihilation of the charge carriers, thereby promoting the photocatalytic performance. The CN/ZCS-2 showed the slowest fluorescence emission decay among the samples, suggesting that the lifetime of its photogenerated electrons and holes was longer than that of in the other samples. The emission lifetimes of the samples were obtained by fitting their attenuation curves. The carrier lifetime was longest in the CN/ZCS-2 sample (τA = 7.91 ns), consistent with expectations. These data prove that the charge separation efficiency of the photocatalytic reaction process was higher in CN/ZCS-2 than in the other samples.
The charge separation efficiencies of the samples under working conditions were explored in photoelectrochemical tests (photocurrent–time (I–T) test and electrochemical impedance spectroscopy (EIS)). The I–T test curve was recorded under irradiation by a 300 W Xe lamp (λ > 420 nm). When the light irradiated the working electrode, the photogenerated electrons migrated along the external circuit to the other electrode and generated a current. A large photocurrent implies a high separation efficiency. As presented in Fig. 6(c), the photocurrent intensity of CN/ZCS was significantly enhanced from that of C3N4, and the CN/ZCS-2 heterojunction exhibited the strongest photocurrent response, consistent with the PL results. That is, the photoexcited charge carriers of CN/ZCS-2 were effectively separated and transferred at the interface between the sample and the electrolyte. These conclusions were also verified in the EIS test. Fig. 6(d) shows the Nyquist plots and simulated equivalent circuit plots of the samples obtained under an external bias of 1.11 V vs. RHE. The reaction resistance Rt was determined from the radius of the semicircle in the Nyquist diagram, which is proportional to charge transfer resistance.31 Among the samples, CN/ZCS-2 exhibited the smallest semicircle on the Nyquist plot and hence the lowest charge transfer resistance (Rt = 926 Ω, see Table S4†). The results mirrored the photocurrent response data, again supporting that the CN/ZCS-2 heterojunction achieved the fastest charge dynamics and excellent photocatalytic activity.
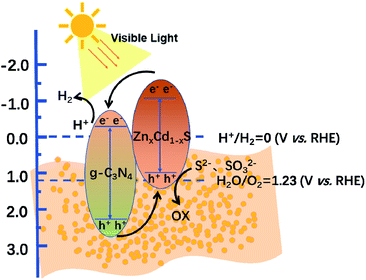
Finally, the XPS VB and steady-state surface photovoltage (SPV) spectra of the ZnCdS and g-C3N4 samples were investigated (Fig. 7). After the image processing and a correlation calculation, the VB positions of ZnCdS and g-C3N4 were obtained as 0.85 and 2.31 eV, respectively. Based on this result and the band gap calculated from the Tauc plots, the CB positions of ZnCdS and g-C3N4 were determined as −1.42 and −0.54 eV, respectively. Scheme 2 describes the charge transfer and separation mechanism of the CN/ZCS-2 heterojunction during the photocatalytic reaction, deduced from the experimental results. When CN/ZCS-2 is irradiated by visible light, the photogenerated electrons in the VB of ZnCdS are excited to the CB, and then migrate to g-C3N4 for the water reduction reaction; simultaneously, the photogenerated holes in the VB of g-C3N4 migrate to ZnCdS, where they react with the hole sacrificing agents. In the SPV spectra (Fig. 7(b)), the SPV value of g-C3N4 was very weak and fluctuated owing to the poor conductivity of this material. The SPV value of CN/ZCS-2 was significantly improved over that of g-C3N4, indicating that more photogenerated electron–hole pairs were transferred to the surface of CN/ZCS-2 when forming the heterojunction.
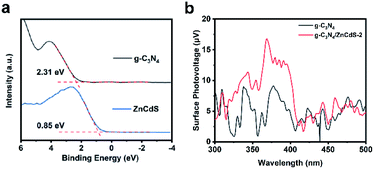 | ||
| Fig. 7 (a) X-ray photoelectron spectroscopy valence band spectrum of ZnCdS and g-C3N4; (b) steady-state surface photovoltage spectra of g-C3N4 and CN/ZCS-2. | ||
In summary, we successfully prepared a CN/ZCS heterojunction by a mild hydrothermal method. Through a series of physical and chemical characterizations, we confirmed that the porous g-C3N4 nanoparticles alleviated the aggregation of ZnCdS QDs and optimized the separation and migration efficiency of the photogenerated carriers. The porous g-C3N4 sample also enlarged the specific surface area for hydrogen production, thus enhancing the photocatalytic efficiency. The ZnCdS QDs were synthesized with ZIF-8 precursors, which retains the high specific surface area of the original MOF. The photocatalytic activity of CN/ZCS-2 reached 1467.23 μmol g−1 h−1, 20 and 13 times higher than that of pristine g-C3N4 and ZnCdS, respectively. The CN/ZCS-2 also exhibited the longest fluorescence lifetime (7.91 ns) among the samples. This mild and simple synthesis method provides a reference for the development and preparation of other energy or environmentally related metal sulfide QDs heterojunction photocatalysts with efficient and stable operation.
Conflicts of interest
There are no conflicts to declare.Acknowledgements
We acknowledge the National Natural Science Foundation of China (21908113, 22035003, 22005153, and 91856124), Frontiers Science Center for New Organic Matter (63181206), and the China Postdoctoral Science Foundation (2019M660979).References
- S. Li, J. Sun and J. Guan, Chin. J. Catal., 2021, 42, 511–556 CrossRef CAS.
- Z. Wang, C. Li and K. Domen, Chem. Soc. Rev., 2019, 48, 2109–2125 RSC.
- B.-J. Ng, L. K. Putri, X. Y. Kong, Y. W. Teh, P. Pasbakhsh and S.-P. Chai, Adv. Sci., 2020, 7, 1903171 CrossRef CAS PubMed.
- A. Fujishima and K. Honda, Nature, 1972, 238, 37–38 CrossRef CAS PubMed.
- Q. Li, H. Meng, J. Yu, W. Xiao, Y. Zheng and J. Wang, Chem.–Eur. J., 2014, 20, 1176–1185 CrossRef CAS PubMed.
- B. Bajorowicz, M. P. Kobylański, A. Gołąbiewska, J. Nadolna, A. Zaleska-Medynska and A. Malankowska, Adv. Colloid Interface Sci., 2018, 256, 352–372 CrossRef CAS PubMed.
- S. Rajaambal, K. Sivaranjani and C. S. Gopinath, J. Chem. Sci., 2015, 127, 33–47 CrossRef CAS.
- M. Roushani, M. Mavaei and H. R. Rajabi, J. Mol. Catal. A: Chem., 2015, 409, 102–109 CrossRef CAS.
- Q. Li, H. Meng, P. Zhou, Y. Zheng, J. Wang, J. Yu and J. Gong, ACS Catal., 2013, 3, 882–889 CrossRef CAS.
- X. Zhao, J. Feng, J. Liu, J. Lu, W. Shi, G. Yang, G. Wang, P. Feng and P. Cheng, Adv. Sci., 2018, 5, 1700590 CrossRef PubMed.
- J. Chen, S. Lv, Z. Shen, P. Tian, J. Chen and Y. Li, ACS Sustainable Chem. Eng., 2019, 7, 13805–13814 CrossRef CAS.
- T. Bai, X. Shi, M. Liu, H. Huang, M. H. Yu, J. Zhang and X. H. Bu, Dalton Trans., 2021, 50, 6064–6070 RSC.
- G. Férey, Chem. Soc. Rev., 2008, 37, 191–214 RSC.
- M. H. Yap, K. L. Fow and G. Z. Chen, Green Energy Environ., 2017, 2, 218–245 CrossRef.
- H. B. Wu and X. W. Lou, Sci. Adv., 2017, 3, eaap9252 CrossRef PubMed.
- Y. Pan, Y. Liu, G. Zeng, L. Zhao and Z. Lai, Chem. Commun., 2011, 47, 2071–2073 RSC.
- C. Lv, G. Chen, J. Sun, C. Yan, H. Dong and C. Li, RSC Adv., 2015, 5, 3767–3773 RSC.
- C.-C. Wang, X.-H. Yi and P. Wang, Appl. Catal., B, 2019, 247, 24–48 CrossRef CAS.
- Y. Su, Z. Zhang, H. Liu and Y. Wang, Appl. Catal., B, 2017, 200, 448–457 CrossRef CAS.
- F. Dong, Z. Wang, Y. Sun, W.-K. Ho and H. Zhang, J. Colloid Interface Sci., 2013, 401, 70–79 CrossRef CAS PubMed.
- Y. Zhang, J. Liu, G. Wu and W. Chen, Nanoscale, 2012, 4, 5300–5303 RSC.
- X. Du, G. Zou, Z. Wang and X. Wang, Nanoscale, 2015, 7, 8701–8706 RSC.
- L. Yao, D. Wei, Y. Ni, D. Yan and C. Hu, Nano Energy, 2016, 26, 248–256 CrossRef CAS.
- X. Hao, J. Zhou, Z. Cui, Y. Wang, Y. Wang and Z. Zou, Appl. Catal., B, 2018, 229, 41–51 CrossRef CAS.
- X. Hao, Y. Wang, J. Zhou, Z. Cui, Y. Wang and Z. Zou, Appl. Catal., B, 2018, 221, 302–311 CrossRef CAS.
- M. Dan, A. Prakash, Q. Cai, J. Xiang, Y. Ye, Y. Li, S. Yu, Y. Lin and Y. Zhou, Sol. RRL, 2019, 3, 1800237 CrossRef.
- Y. Zou, J.-W. Shi, L. Sun, D. Ma, S. Mao, Y. Lv and Y. Cheng, Chem. Eng. J., 2019, 378, 122192 CrossRef CAS.
- T. Di, B. Zhu, B. Cheng, J. Yu and J. Xu, J. Catal., 2017, 352, 532–541 CrossRef CAS.
- H. Li, H. Tian, X. Wang, M. Pi, S. Wei, H. Zhu, D. Zhang and S. Chen, ACS Appl. Energy Mater., 2019, 2, 4692–4699 CrossRef CAS.
- L. Shao, D. Jiang, P. Xiao, L. Zhu, S. Meng and M. Chen, Appl. Catal., B, 2016, 198, 200–210 CrossRef CAS.
- A. Prakash, M. Dan, S. Yu, S. Wei, Y. Li, F. Wang and Y. Zhou, Sol. Energy Mater. Sol. Cells, 2018, 180, 205–212 CrossRef CAS.
Footnotes |
| † Electronic supplementary information (ESI) available. See DOI: 10.1039/d1ra05894k |
| ‡ These authors contributed equally. |
| This journal is © The Royal Society of Chemistry 2021 |


