 Open Access Article
Self-assembly of the monohydroxy triterpenoid lupeol yielding nano-fibers, sheets and gel: environmental and drug delivery applications†
Saikat Kumar Panja,
Soumen Patra and
Braja Gopal Bag *
*
Department of Chemistry and Chemical Technology, Vidyasagar University, Midnapore 721102, West Bengal, India
First published on 13th October 2021
Abstract
Lupeol is a medicinally important naturally abundant triterpenoid having a 6–6–6–6–5 fused pentacyclic backbone and one polar secondary “–OH” group at the C3 position of the “A” ring. It was extracted from the dried outer bark of Bombax ceiba and its self-assembly properties were investigated in different neat organic as well as aquous-organic binary liquid mixtures. The triterpenoid having only one polar “–OH” group and a rigid lipophilic backbone self-assembled in neat organic non-polar liquids like n-hexane, n-heptane, n-octane and polar liquids like DMSO, DMF, DMSO–H2O, DMF–H2O, and EtOH–H2O yielding supramolecular gels via formation of nano to micrometre long self-assembled fibrillar networks (SAFINs). Morphological investigation of the self-assemblies was carried out by field emission scanning electron microscopy, high resolution transmission electron microscopy, atomic force microscopy, optical microscopy, concentration dependent FTIR and wide angle X-ray diffraction studies. The mechanical properties of the gels were studied by concentration dependent rheological studies in different solvents. The gels were capable of removing toxic micro-pollutants like rhodamine-B and 5,6-carboxyfluorescein as well as the toxic heavy metal Cr(VI) from contaminated water. Moreover release of the chemotherapeutic drug doxorubicin from a drug loaded gel in PBS buffer at pH 7.2 has also been demonstrated by spectrophotometry.
1 Introduction
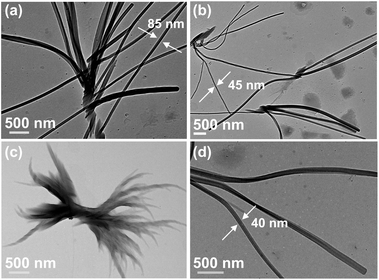
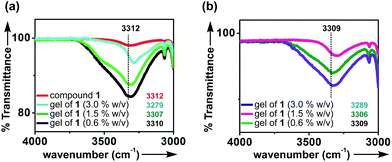
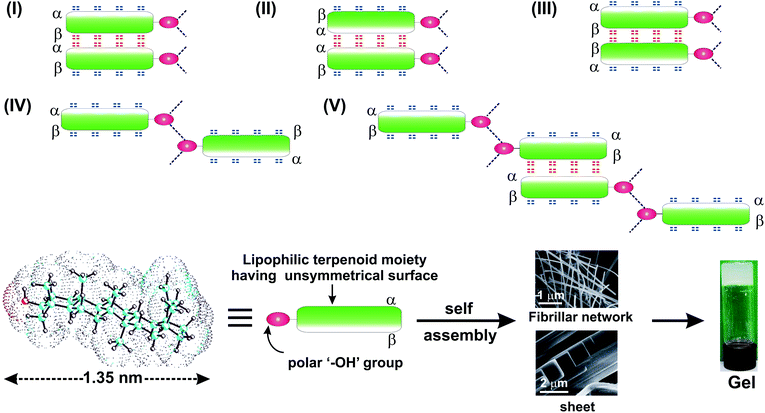
Terpenoids containing multiples of C5 units are a very large group of natural products present in plants as secondary metabolites. These are biosynthesized in plants from acetyl–CoA via a series of complex bio-chemical reactions in the presence of specific enzymes which produce diverse terpenoid structures containing hydroxyl and/or carboxyl groups in common.1,2 The renewable and bio-compatible nature of plant derived terpenoids have made them significant in diversified areas of biological, chemical and materials science research.3–5 Supramolecular terpenoid based gels obtained via hierarchical self-assembly have gained renewed interest in research for generating advanced renewable functional materials over the last two decades.6–15 Gels based upon low molecular weight renewable chemicals have potential and realized applications in various research fields16–19 like liquid crystals,20 electro-conductive scaffolds,21,22 sensing devices,23 chemical catalysis,24 nano-biotechnology, daily life applications,6 advanced materials,25 environmental remediation26,27 etc. Physical as well as chemical gels11,28–31 are typically obtained by self-assembly of low molecular weight components via non-covalent forces like H-bonding, electrostatic forces, dipole–dipole interactions, π–π interactions etc. The self-assembly properties of different types of amphiphilic molecules like long chain fatty acids,32–34 sophorolipids,35,36 peptides,37–39 sugars,40,41 and steroids,42,43 have been explored extensively.Since the first report of spontaneous self-assembly and gel formation of a naturally occurring terpenoid, different types of terpenoids have been explored for studying their self-assembly properties.5,7,44,45 Tremendous biological and medicinal applications of lupeol like antiangiogenic,46 anti-cancer,47,48 antiulcer, hypoglycemic, anti-tumor,49 antioxidant,50 anti-inflammatory,51 anti-bacterial,52 antinociceptive effect,53 hepatoprotective and antimicrobial activities have been reported.54 Lupeol, a nano-sized terpenoid (1.35 nm) having both polar “–OH” group and lipophilic regions is an unique amphiphile for study of its self-assembly properties (Scheme 1). According to our knowledge, detailed self-assembly and gelation properties of lupeol in different liquids and their morphological characterizations have not yet been reported.5–7,55 Herein, we report the self-assembly and gelation property of lupeol in different neat liquids as well as mixed liquids via formation of fibers, sheet having nano-to micro-meter dimensions. The morphology of gels of lupeol were characterized using several microscopic techniques like optical microscopy (OPM), scanning electron microscopy (SEM), transmission electron microscopy (TEM), atomic force microscopy (AFM). Based on molecular modeling studies, X-ray diffraction data and FTIR studies, a model for the self-assembly of lupeol has also been proposed. Rheology of gels in different liquids at different concentrations have been carried out. Utilizations of the gel for toxic dye and heavy metal removal from contaminated water have been demonstrated. Moreover, release of anticancer drug doxorubicin from a drug loaded gel has been demonstrated using UV-visible spectrophotometry at physiological pH (pH = 7.2).
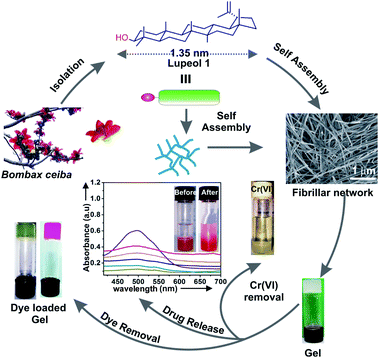 | ||
| Scheme 1 Schematic presentation of isolation of lupeol 1 from Bombax ceiba and its self-assembly in liquids yielding gel via formation of fibrillar network and the various applications of gel. | ||
2 Results and discussion
2.1 Isolation of lupeol
We have isolated lupeol from the dried outer bark of indian flowering plant Bombax ceiba by following standard method developed in our laboratory and characterized by various spectroscopic techniques.55 The purity of the sample used in this study was checked by 1H and 13C NMR, DEPT and HRMS.2.2 Study of self-assembly properties
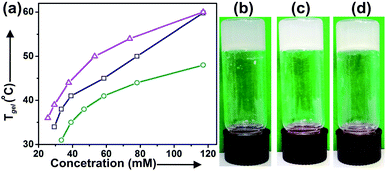
Lupeol 1 has a 6–6–6–6–5 fused pentacyclic lipophilic backbone attached with one hydroxy group at the ‘A’-ring (C3 position). Energy minimization carried out by DFT calculation and by molecular mechanics calculation using Allinger's MMX algorithm revealed the length of the molecule as 1.35 nm (Fig. S1, and S2†). The large lipophilic moiety provided by the rigid pentacyclic backbone with the polar “–OH” group lying at the extreme end makes it an unique nano-sized amphiphile for the study of its self-assembly properties in liquids.For studying the self-assembly property of lupeol, a weighed amount of the sample was dissolved in a liquid by heating (40–50 °C) for 20–25 min with magnetic stirring. The hot solution was kept at 15 °C under sealed condition for 2–8 h. When the vial was turned upside down, no flow of solvents indicated the formation of a gel. Gelation studies were carried out in 20 neat organic and aqueous-organic binary solvent mixtures. Lupeol spontaneously self-assembled to form gel in polar solvents like DMSO, DMF, DMSO–H2O, DMF–H2O and also in nonpolar solvents like n-hexane, n-heptane, n-octane etc. The Tgel values at their minimum gelator concentration were in the range 30–36 °C (Table 1). It was also observed that Tgel increased with increasing concentration of gelator which is reflected in their corresponding Tgel vs. concentration plots (Fig. 1 and S3, ESI†). All the gels obtained by self-assembly of lupeol were thermo-reversible in nature as tested by repetitive heating and cooling experiments the sol-to-gel regained. A plot of ln![[thin space (1/6-em)]](https://www.rsc.org/images/entities/char_2009.gif) K vs. 1/Tgel enabled us to calculate the various thermodynamic parameters (ΔH°, ΔS°, ΔG°) at 298 K (Table 2 and Fig. S4, ESI†). The positive free energy changes (ΔG°) during gel to sol transformations in all the cases indicated the stability of the gels.
K vs. 1/Tgel enabled us to calculate the various thermodynamic parameters (ΔH°, ΔS°, ΔG°) at 298 K (Table 2 and Fig. S4, ESI†). The positive free energy changes (ΔG°) during gel to sol transformations in all the cases indicated the stability of the gels.
| Entry | Solvent | Statea | MGC | Tgelb (°C) |
|---|---|---|---|---|
| a G = gel, VS = viscous suspension, I = insoluble, minimum gelator concentration (MGC) are given in mM unit.b Tgel = gel to sol transition temperatures at MGCs. | ||||
| 1 | DMSO | G | 29.3 | 32 |
| 2 | DMF | G | 33.4 | 31 |
| 3 | DMSO–H2O (2![[thin space (1/6-em)]](https://www.rsc.org/images/entities/char_2009.gif) : :![[thin space (1/6-em)]](https://www.rsc.org/images/entities/char_2009.gif) 1 v/v) 1 v/v) |
G | 25.5 | 36 |
| 4 | DMSO–H2O (3![[thin space (1/6-em)]](https://www.rsc.org/images/entities/char_2009.gif) : :![[thin space (1/6-em)]](https://www.rsc.org/images/entities/char_2009.gif) 2 v/v) 2 v/v) |
G | 28.6 | 34 |
| 5 | DMF–H2O (2![[thin space (1/6-em)]](https://www.rsc.org/images/entities/char_2009.gif) : :![[thin space (1/6-em)]](https://www.rsc.org/images/entities/char_2009.gif) 1 v/v) 1 v/v) |
G | 27.9 | 35 |
| 6 | DMF–H2O (3![[thin space (1/6-em)]](https://www.rsc.org/images/entities/char_2009.gif) : :![[thin space (1/6-em)]](https://www.rsc.org/images/entities/char_2009.gif) 2 v/v) 2 v/v) |
G | 30.4 | 36 |
| 7 | n-Hexane | G | 39.1 | 32 |
| 8 | n-Heptane | G | 39.0 | 31 |
| 9 | n-Octane | G | 39.1 | 30 |
| 10 | THF | VS | — | — |
| 11 | EtOH | VS | — | — |
| 12 | EtOH–H2O (3![[thin space (1/6-em)]](https://www.rsc.org/images/entities/char_2009.gif) : :![[thin space (1/6-em)]](https://www.rsc.org/images/entities/char_2009.gif) 1 v/v) 1 v/v) |
VS | — | — |
| 13 | MeOH | VS | — | — |
| 14 | n-Butanol | VS | — | — |
| 15 | n-Hexanol | VS | — | — |
| 16 | o-Dichlorobenzene | VS | — | — |
| 17 | Mesitylene | VS | — | — |
| 18 | Nitrobenzene | VS | — | — |
| 19 | Cyclohexane | VS | — | — |
| 20 | Water | I | — | — |
| Liquid | ΔH° kJ mol−1 | ΔS° J mol−1 K−1 | ΔG° kJ mol−1 |
|---|---|---|---|
| n-Hexane | 82.0 | 242 | 10.0 |
| n-Heptane | 75.2 | 224 | 8.4 |
| n-Octane | 90.2 | 263 | 11.9 |
| DMSO | 54.6 | 179 | 9.7 |
| DMF | 69.8 | 199 | 10.5 |
DMSO–H2O (2![[thin space (1/6-em)]](https://www.rsc.org/images/entities/char_2009.gif) : :![[thin space (1/6-em)]](https://www.rsc.org/images/entities/char_2009.gif) 1 v/v) 1 v/v) |
54.1 | 144 | 14.8 |
DMSO–H2O (3![[thin space (1/6-em)]](https://www.rsc.org/images/entities/char_2009.gif) : :![[thin space (1/6-em)]](https://www.rsc.org/images/entities/char_2009.gif) 2 v/v) 2 v/v) |
47.1 | 123 | 13.4 |
DMF–H2O (2![[thin space (1/6-em)]](https://www.rsc.org/images/entities/char_2009.gif) : :![[thin space (1/6-em)]](https://www.rsc.org/images/entities/char_2009.gif) 1 v/v) 1 v/v) |
48.4 | 126 | 13.8 |
DMF–H2O (3![[thin space (1/6-em)]](https://www.rsc.org/images/entities/char_2009.gif) : :![[thin space (1/6-em)]](https://www.rsc.org/images/entities/char_2009.gif) 2 v/v) 2 v/v) |
48.0 | 124 | 13.8 |
2.3 Morphological characteristics of the self-assemblies
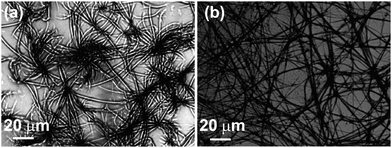
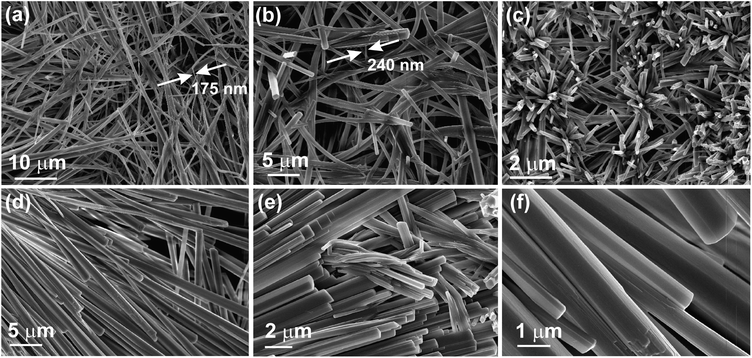
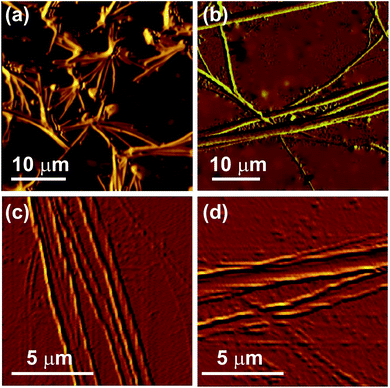
The morphologies of the self-assemblies were studied by optical microscopy (OM), atomic force microscopy (AFM), field emission scanning electron microscopy (FESEM), and high resolution transmission electron microscopy (HRTEM).![[thin space (1/6-em)]](https://www.rsc.org/images/entities/char_2009.gif) :
:![[thin space (1/6-em)]](https://www.rsc.org/images/entities/char_2009.gif) 1 v/v). In all these samples micrometer long fibrillar network were observed (Fig. S5, ESI†). Nano-fibers were not observed in OM due to the limitations of OM.
1 v/v). In all these samples micrometer long fibrillar network were observed (Fig. S5, ESI†). Nano-fibers were not observed in OM due to the limitations of OM.
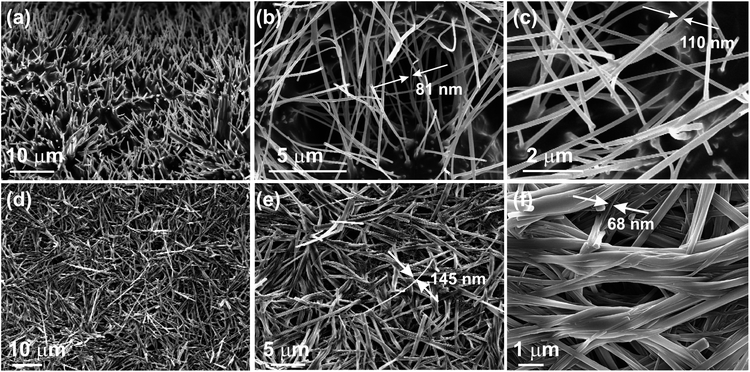 | ||
| Fig. 3 FESEM micrographs of the dried self-assemblies of 1 prepared from (a–c) n-heptane (2% w/v, 46.9 mM), (d–f) DMF (1.5% w/v, 35.2 mM). | ||
![[thin space (1/6-em)]](https://www.rsc.org/images/entities/char_2009.gif) :
:![[thin space (1/6-em)]](https://www.rsc.org/images/entities/char_2009.gif) 1 v/v, 0.12% w/v, 2.8 mM) and AFM was carried out. Nano-to- micrometer thick fibrillar network and having length in micro-meter dimension were observed in all the xerogel samples studied (Fig. 5 and S6, ESI†).
1 v/v, 0.12% w/v, 2.8 mM) and AFM was carried out. Nano-to- micrometer thick fibrillar network and having length in micro-meter dimension were observed in all the xerogel samples studied (Fig. 5 and S6, ESI†).
![[thin space (1/6-em)]](https://www.rsc.org/images/entities/char_2009.gif) :
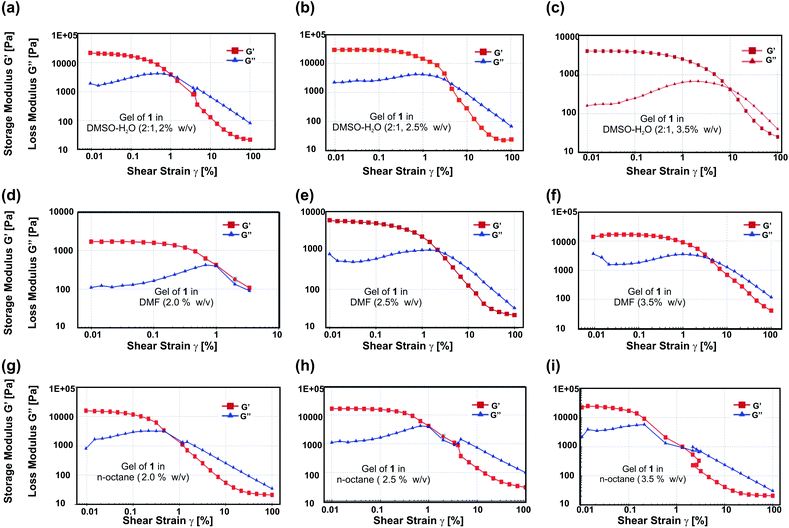
:![[thin space (1/6-em)]](https://www.rsc.org/images/entities/char_2009.gif) 1 v/v) at different concentrations (2.0% w/v (46.8 mM), 2.5% w/v (58.6 mM), 3.5% w/v (82.04 mM)) a cross over between G′ and G′′ occurred at critical strains (γc) 1.0%, 4.95% and 10.0% respectively (Fig. 7a–c). Similarly, for a gel of 1 in DMF at different concentrations (2.0% w/v, 2.5% w/v, 3.5% w/v) a cross over between G′ and G′′ occurred at a critical strain (γc) 1.0%, 3.2% and 4.95% respectively (Fig. 7d–f). For a gel of 1 in n-octane at different concentrations (2.0% w/v, 2.5% w/v, 3.5% w/v), a cross over between G′ and G′′ occurred at critical strains (γc) 0.46%, 1%, 2.1% respectively (Fig. 7g–i). From these experiments it was observed that with increasing the concentration of 1 in all the liquids tested, gel strength increased. This observation is consistent with our previous observations with concentration vs. gel-to-sol transition temperature (Tgel) plots (Fig. 1 and S3, ESI†). It was also observed that at an identical concentration mechanical strength of the gels are in order DMSO–H2O (2
1 v/v) at different concentrations (2.0% w/v (46.8 mM), 2.5% w/v (58.6 mM), 3.5% w/v (82.04 mM)) a cross over between G′ and G′′ occurred at critical strains (γc) 1.0%, 4.95% and 10.0% respectively (Fig. 7a–c). Similarly, for a gel of 1 in DMF at different concentrations (2.0% w/v, 2.5% w/v, 3.5% w/v) a cross over between G′ and G′′ occurred at a critical strain (γc) 1.0%, 3.2% and 4.95% respectively (Fig. 7d–f). For a gel of 1 in n-octane at different concentrations (2.0% w/v, 2.5% w/v, 3.5% w/v), a cross over between G′ and G′′ occurred at critical strains (γc) 0.46%, 1%, 2.1% respectively (Fig. 7g–i). From these experiments it was observed that with increasing the concentration of 1 in all the liquids tested, gel strength increased. This observation is consistent with our previous observations with concentration vs. gel-to-sol transition temperature (Tgel) plots (Fig. 1 and S3, ESI†). It was also observed that at an identical concentration mechanical strength of the gels are in order DMSO–H2O (2![[thin space (1/6-em)]](https://www.rsc.org/images/entities/char_2009.gif) :
:![[thin space (1/6-em)]](https://www.rsc.org/images/entities/char_2009.gif) 1 v/v) > DMF > n-octane. Thus with decreasing dielectric constant of the liquid, a decrease in gel strength was observed.61,62 Moreover, it was also observed that all the gel samples tested were having high mechanical strength as the storage modulus (G′) values for the gel is of the order of 103 to 105 Pa and G′ > G′′. The longer viscoelastic region (LVER) observed for all the gels in DMSO–water (2
1 v/v) > DMF > n-octane. Thus with decreasing dielectric constant of the liquid, a decrease in gel strength was observed.61,62 Moreover, it was also observed that all the gel samples tested were having high mechanical strength as the storage modulus (G′) values for the gel is of the order of 103 to 105 Pa and G′ > G′′. The longer viscoelastic region (LVER) observed for all the gels in DMSO–water (2![[thin space (1/6-em)]](https://www.rsc.org/images/entities/char_2009.gif) :
:![[thin space (1/6-em)]](https://www.rsc.org/images/entities/char_2009.gif) 1 v/v), DMF and n-octane, indicated that all the gels are viscoelastic in nature (Fig. 7, S10 and ESI†).
1 v/v), DMF and n-octane, indicated that all the gels are viscoelastic in nature (Fig. 7, S10 and ESI†).
| Entry | d (nm) |
|---|---|
| Neat powder of 1 | 1.35, 0.87, 0.77, 0.64, 0.57, 0.53, 0.51, 0.46, 0.44, 0.42, 0.39, 0.38, 0.35, 0.34, 0.30, 0.28, 0.27 |
| XRD from single crystal | 1.35, 0.95, 0.85, 0.67, 0.63, 0.60, 0.57, 0.55, 0.53, 0.49, 0.46, 0.43, 0.39, 0.38, 0.37, 0.34, 0.32, 0.31, 0.29 |
| Xerogel in DMF | 1.35, 0.88, 0.77, 0.65, 0.57, 0.55, 0.51, 0.46, 0.43, 0.40, 0.36, 0.33 |
| Xerogel in n-heptane | 1.35, 0.87, 0.77, 0.65, 0.57, 0.53, 0.51, 0.46, 0.45, 0.44, 0.37, 0.35, 0.34, 0.28 |
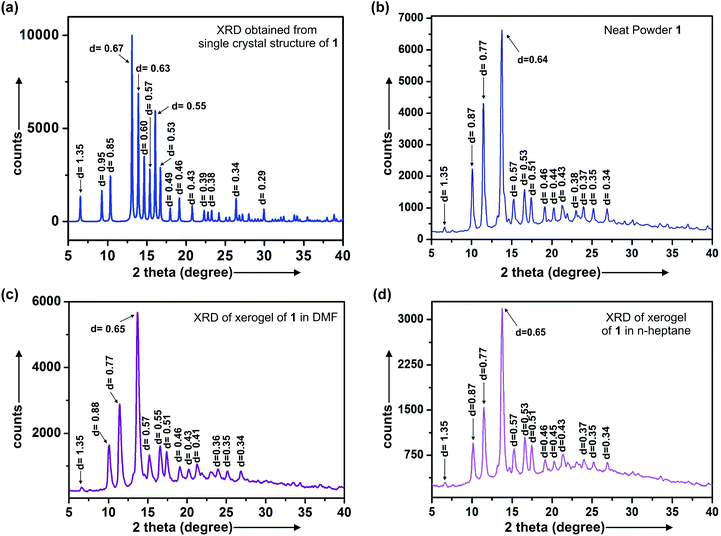
The length of the molecule obtained by energy minimization as well as by X-ray crystallography is 1.35 nm. The 1.35 nm peak was common in all the diffraction data. XRD peaks observed at 1.35, 0.65, 0.46 nm for both the xerogels prepared from the gels in DMF and n-heptane are close to the ratio 1![[thin space (1/6-em)]](https://www.rsc.org/images/entities/char_2009.gif) :
:![[thin space (1/6-em)]](https://www.rsc.org/images/entities/char_2009.gif) 1/2
1/2![[thin space (1/6-em)]](https://www.rsc.org/images/entities/char_2009.gif) :
:![[thin space (1/6-em)]](https://www.rsc.org/images/entities/char_2009.gif) 1/3 indicating a lamellar pattern of self-assembled microstructures like fibrillar network/crystalline fibers, sheets which are consistent with our microscopic observations by SEM, HRTEM, AFM discussed earlier.65–67
1/3 indicating a lamellar pattern of self-assembled microstructures like fibrillar network/crystalline fibers, sheets which are consistent with our microscopic observations by SEM, HRTEM, AFM discussed earlier.65–67
A few peaks at 0.57, 0.46, 0.43, 0.34 nm found in the powder diffraction pattern generated from its single crystal structure were also observed in the xerogels of 1 from n-heptane and DMF as well as the neat powder indicating that ordered arrangement of molecules are also present in the gel morphology. The peaks at 0.95, 0.85, 0.67, 0.63, 0.60, 0.49, 0.39 nm observed in the single crystal did not match with the diffraction pattern from the xerogels of 1 in DMF and n-heptane indicating the uniqueness of the gel morphologies different from the single crystal (Fig. 9a–c and Table 3).
The 0.88, 0.77, 0.51, 0.36 nm peaks observed from DMF xerogel and 0.87, 0.77, 0.51, 0.37 nm peaks observed from the xerogel of 1 in n-heptane had several common or very close peaks with the diffraction pattern of neat powder 0.87, 0.77, 0.51, 0.42, 0.39, 0.30 nm also supports the uniqueness of gel morphology (Fig. 9a–d and Table 3).
3 Utilization of gel
3.1 Removal of toxic dyes from water
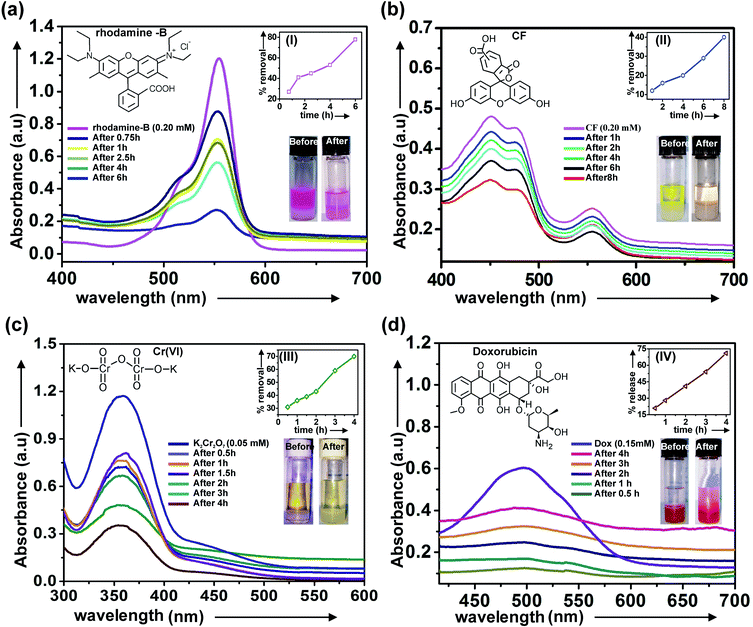
Gels are the semisolid-like materials having three dimensional fibrillar network inside, posses high surface area. The surface of the fibrillar network inside the gel moiety was utilized for studying the removal of toxic pigments such as rhodamine-B, CF from their respective aqueous solutions. For studying the removal of toxic dye rhodamine-B from its aqueous solution by the gel, aqueous solution of rhodamine-B (0.2 mM, 1.5 mL) was prepared. Then the freshly prepared aqueous solution of dye was placed on the gel surface carefully. The removal of dye from its aqueous solution was monitored by UV-visible spectrophotometry. For the removal of anionic 5,6-carboxyfluorescein (CF), aqueous solution of CF (0.2 mM, 1.5 mL) was prepared and similar experiment was carried out. With increasing the time decreasing trend of absorption for both the cases observed, clearly indicated removal of dyes from their respective aqueous solution (Fig. 11a and b). Removal of toxic dyes from water via adsorption by the fibrillar network inside the gels were also confirmed by epifluorescence microscopy images as bright green and red fluorescence lights were observed after the adsorption of fluorophores (Fig. S9, ESI†).3.2 Removal of heavy metal Cr(VI) from contaminated water
For studying the removal of toxic heavy metal Cr(VI), 0.05 mM (1.5 mL) aqueous solution of Cr(VI) was prepared freshly. A gel was prepared by dissolving 8 mg of 1 in DMSO–water (20.8 mM, 2![[thin space (1/6-em)]](https://www.rsc.org/images/entities/char_2009.gif) :
:![[thin space (1/6-em)]](https://www.rsc.org/images/entities/char_2009.gif) 1 v/v). Then the freshly prepared aqueous solution of Cr(VI) was placed on the gel surface carefully. The removal of Cr(VI) from its aqueous solution was monitored by UV spectrophotometry. For this an aliquot of aqueous solution containing Cr(VI) was collected from the gel surface and absorption was measured at different time interval. With the increase in time decreasing trend of absorbance was observed which clearly indicated the removal of heavy metal from contaminated water by the gel (Fig. 11c).
1 v/v). Then the freshly prepared aqueous solution of Cr(VI) was placed on the gel surface carefully. The removal of Cr(VI) from its aqueous solution was monitored by UV spectrophotometry. For this an aliquot of aqueous solution containing Cr(VI) was collected from the gel surface and absorption was measured at different time interval. With the increase in time decreasing trend of absorbance was observed which clearly indicated the removal of heavy metal from contaminated water by the gel (Fig. 11c).
3.3 Application of gel for release of anticancer drug doxorubicin in PBS buffer from loaded gel
A coloured gel of 1 in DMSO–water (3![[thin space (1/6-em)]](https://www.rsc.org/images/entities/char_2009.gif) :
:![[thin space (1/6-em)]](https://www.rsc.org/images/entities/char_2009.gif) 2 v/v) loaded with anticancer drug doxorubicin (0.15 mM) was prepared. For the release of doxorubicin from the drug loaded gel into PBS buffer (pH 7.2), the buffer solution was placed carefully on the gel. Increase of the absorbance values of the buffer layer with time indicated the release of drug in PBS buffer (Fig. 11d). Release of drug molecules into the buffer solution primarily took place via diffusion.26 Spectral shape change observed with time indicated degradation of the gel. Traces of the presence of the anticancer drug doxorubicin still remaining inside the gels after 4 h of release (though less intense) was confirmed by epifluorescence microscopy carried out with the gel sample after the release experiment (Fig. S9, ESI†).
2 v/v) loaded with anticancer drug doxorubicin (0.15 mM) was prepared. For the release of doxorubicin from the drug loaded gel into PBS buffer (pH 7.2), the buffer solution was placed carefully on the gel. Increase of the absorbance values of the buffer layer with time indicated the release of drug in PBS buffer (Fig. 11d). Release of drug molecules into the buffer solution primarily took place via diffusion.26 Spectral shape change observed with time indicated degradation of the gel. Traces of the presence of the anticancer drug doxorubicin still remaining inside the gels after 4 h of release (though less intense) was confirmed by epifluorescence microscopy carried out with the gel sample after the release experiment (Fig. S9, ESI†).
4 Conclusions
In conclusion, spontaneous formation of fibrillar self-assemblies of lupane-type mono-hydroxy terpenoid lupeol has been reported. According to our knowledge, this is the first report of the formation of self-assembled nano-fiber and sheets by naturally abundant 6–6–6–6–5 nano-sized mono-hydroxy terpenoid lupeol. A model for the self-assembly of lupeol have been proposed based on the morphology observed by AFM, optical, FESEM, HRTEM, concentration dependent FTIR studies, rheological studies and wide angle X-ray diffraction studies. The utilization of the gel of lupeol in DMSO–water for the removal of carcinogenic dyes like rho-B, CF including toxic heavy metal Cr(VI) from their respective aqueous solution has been demonstrated by UV-visible spectroscopic technique. Moreover, release of anti-cancer drug doxorubicin from drug loaded gel in PBS buffer at pH 7.2 has also been demonstrated by UV-visible spectroscopic technique.5 Experimental
5.1 Materials
Lupeol was isolated from the dried and powdered outer bark of Bombax ceiba (yield = 0.2%) as a white solid. Solvents like n-heptane (Merck, SB9F690037), n-hexane (Merck, SI9F690620), n-ocatne (SDFCL, K09A/0409/2467/13), DMSO (Fischer Scientific, Lot No. 1910880417), DMF (SRL, 042825), cyclohexane (SRL, 6328103), THF (Merck, SK9SA91045), methanol (Rankem, KR110K17), n-butanol (Merck, SA6S550847), n-hexanol (SRL, 082795), ethanol (Rankem), o-dichlorobenzene (SRL, 04271), mesitylene (Loba Chemie, 0459700600), nitrobenzene (SRL, 75010), rho-B (SDFCL, K102/2210/140271), CF (Merck), Dox (Merck) were used in these studies.5.2 Study of self-assembly and gelation
Lupeol (5 mg) was weighed in clean and dry vial (capacity = 4 mL). The compound was then mixed with a solvent and then heated (40–50 °C) for 20–25 min with magnetic stirring. Then the vial was kept at 15 °C under sealed condition for 2–8 h. Self-assembly was checked under optical microscopy. When the vial was turned upside down, no flow of solvents indicated the formation of a gel.5.3 Preparation of gel for dye removal study
Lupeol (8 mg) was taken in a clean dried vial (capacity = 4 mL) was completely dissolved in distilled DMSO (0.6 mL) under heating condition with magnetic stirring, then distilled water (0.3 mL) was added dropwise to this solution. Thus the solution became cloudy which was redissolved by continuous heating and stirring magnetically. The resulting hot solution then allowed to cool at 15 °C. Opaqueness of the mixture inside the vial was observed for 2 h. No flow of the liquid by inverting the vial indicated the formation of a gel in DMSO–water (20.8 mM, 2![[thin space (1/6-em)]](https://www.rsc.org/images/entities/char_2009.gif) :
:![[thin space (1/6-em)]](https://www.rsc.org/images/entities/char_2009.gif) 1 v/v).
1 v/v).
5.4 Preparation of gel for rheological studies
Lupeol (6 mg) was dissolved in 200 mL of distilled DMSO under hot condition followed by magnetic stirring. Then distilled water (100 μL) was added dropwise into the hot solution and hence a cloudiness appeared which was further re-dissolved under hot condition followed by magnetic stirring and kept at 15 °C for 2–4 h. Thus, a gel of 1 in DMSO–H2O (2![[thin space (1/6-em)]](https://www.rsc.org/images/entities/char_2009.gif) :
:![[thin space (1/6-em)]](https://www.rsc.org/images/entities/char_2009.gif) 1 v/v, 2.0% w/v) was obtained. Similarly, compound 1 (8.5 mg) was dissolved in 225 mL of distilled DMSO under hot condition followed by magnetic stirring. Then distilled water (113 μL) was added dropwise into the hot solution and hence a cloudiness appeared which was further redissolved under hot condition followed by magnetic stirring and kept at 15 °C for 2–4 h. Thus a gel of 1 in DMSO–H2O (2
1 v/v, 2.0% w/v) was obtained. Similarly, compound 1 (8.5 mg) was dissolved in 225 mL of distilled DMSO under hot condition followed by magnetic stirring. Then distilled water (113 μL) was added dropwise into the hot solution and hence a cloudiness appeared which was further redissolved under hot condition followed by magnetic stirring and kept at 15 °C for 2–4 h. Thus a gel of 1 in DMSO–H2O (2![[thin space (1/6-em)]](https://www.rsc.org/images/entities/char_2009.gif) :
:![[thin space (1/6-em)]](https://www.rsc.org/images/entities/char_2009.gif) 1 v/v, 2.5% w/v) was obtained. Similarly another gel in DMSO–H2O (2
1 v/v, 2.5% w/v) was obtained. Similarly another gel in DMSO–H2O (2![[thin space (1/6-em)]](https://www.rsc.org/images/entities/char_2009.gif) :
:![[thin space (1/6-em)]](https://www.rsc.org/images/entities/char_2009.gif) 1 v/v, 3.5% w/v) was also prepared. Following the similar procedure gels of 1 in DMF (at concentrations 2.0% w/v, 2.5% w/v and 3.5% w/v) were prepared. Following the similar procedure, gels of 1 in n-octane (at concentrations 2.0% w/v, 2.5% w/v and 3.5% w/v) were also prepared for rheological studies.
1 v/v, 3.5% w/v) was also prepared. Following the similar procedure gels of 1 in DMF (at concentrations 2.0% w/v, 2.5% w/v and 3.5% w/v) were prepared. Following the similar procedure, gels of 1 in n-octane (at concentrations 2.0% w/v, 2.5% w/v and 3.5% w/v) were also prepared for rheological studies.
5.5 Preparation of doxorubicin loaded gel and study or drug release
Lupeol (8 mg) was dissolved in DMSO–water (2 mL, 3![[thin space (1/6-em)]](https://www.rsc.org/images/entities/char_2009.gif) :
:![[thin space (1/6-em)]](https://www.rsc.org/images/entities/char_2009.gif) 2 v/v) under hot condition. Anticancer drug doxorubicin (0.5 mM, 100 μL) was added to the lupeol solution and heated with stirring to obtain a clear solution. The resulting solution was kept at 15 °C for 2–4 h and formation of a coloured gel loaded with doxorubicin (0.15 mM) was observed. Then 1.5 mL of PBS buffer solution (pH 7.2) was placed carefully on the top of the gel surface. Aliquots buffer layer (1.4 mL) was carefully collected at different time intervals and absorbance was measured at 520 nm. The absorbance values were plotted against time (Fig. 11d). Increase in the absorbance values with time indicated the release of drug in PBS buffer.
2 v/v) under hot condition. Anticancer drug doxorubicin (0.5 mM, 100 μL) was added to the lupeol solution and heated with stirring to obtain a clear solution. The resulting solution was kept at 15 °C for 2–4 h and formation of a coloured gel loaded with doxorubicin (0.15 mM) was observed. Then 1.5 mL of PBS buffer solution (pH 7.2) was placed carefully on the top of the gel surface. Aliquots buffer layer (1.4 mL) was carefully collected at different time intervals and absorbance was measured at 520 nm. The absorbance values were plotted against time (Fig. 11d). Increase in the absorbance values with time indicated the release of drug in PBS buffer.
5.6 UV spectrophotometry
UV-1800 (SHIMADZU) UV-spectrophotometer was used for all the absorbance measurements. keeping wavelength (800–300 nm), scan speed = fast, slit width = 1 nm, scan mode = single. Quartz cuvette (capacity = 4 mL, l = 1 cm) was used for all the experiments. The absorption/release experiments were carried out at λmax = 556 nm (rho-B), λmax = 456 nm (CF), λmax = 372 nm (Cr-VI) and λmax = 520 nm (doxorubicin) respectively.5.7 FTIR
FTIR spectra of all the samples were recorded in PerkinElmer FTIR C98747 Instrument in the range 4000–400 cm−1, resolution = 4 cm−1, data interval = 1 cm−1, accumulation = 4 scans.5.8 Rheology
A modular compact rheometer (Anton Paar model MCR102) with a plate–plate assembly equipped with a temperature control system where the upper plate had a diameter of 25 mm (PP25) was used for all rheological measurements. All the rheology experiments were performed at temperature = 25 °C, at LVER default mode, shear strain (γ, %) = 0.01–100, angular frequency (ω) = constant at 10 (1 s−1), oscillatory stress = 0.001–100 Pa, frequency = 10 S−1, gap (d) = 0.105 mm, sensor force (Fs) = −0.03 to −0.05 N, data point number = 25.5.9 Epifluorescence microscopy
Epifluorescence microscopy was carried out in Carl Zeiss microscope: Axio scope A1 attached with a fluorescence light source. For these experiments the coloured gels after the removal/release experiments were collected carefully and placed on glass slide and covered with cover slip and observed under epifluorescence microscope.Conflicts of interest
The authors declare no conflict of interest.Acknowledgements
BGB thanks Indo Sri Lanka project (DST/INT/SL/P25/2016), CSIR, UGC-SAP and DST-FIST New Delhi and Vidyasagar University for financial support and infrastructural facilities. SKP acknowledge UGC BSR for research fellowships.Notes and references
- K. Ohyamaa, M. Suzukia, J. Kikuchi, K. Saitoa and T. Muranakaa, Proc. Natl. Acad. Sci. U. S. A., 2009, 106, 725 CrossRef PubMed.
- E. J. Corey, S. P. T. Matsuda and B. Bartel, Proc. Natl. Acad. Sci. U. S. A., 1993, 90, 11628 CrossRef CAS PubMed.
- B. Kamm, Angew. Chem., Int. Ed., 2007, 46, 5056 CrossRef CAS PubMed.
- A. Gandini, Green Chem., 2011, 13, 1061 RSC.
- B. G. Bag, A. C. Barai, S. N. Hasan, S. K. Panja, S. Ghorai and S. Patra, Pure Appl. Chem., 2019, 92, 567 Search PubMed.
- M. George and R. G. Weiss, Acc. Chem. Res., 2006, 39, 489 CrossRef CAS PubMed.
- B. G. Bag and R. Majumdar, Chem. Rec., 2017, 17, 841 CrossRef CAS PubMed.
- E. Carretti, M. Bonini, L. Dei, B. H. Berrie, L. V. Angelova, P. Baglioni and R. G. Weiss, Acc. Chem. Res., 2010, 43, 751–760 CrossRef CAS PubMed.
- S. Bhattacharya and S. K. Samanta, Chem. Rev., 2016, 116, 11967 CrossRef CAS PubMed.
- K. Hanabusa, Springer Ser. Mater. Sci., 2004, 78, 118 CAS.
- Molecular Gels: Materials with Self-Assembled Fibrillar Networks, ed. R. G. Weiss and P. Terech, Springer, 2006 Search PubMed.
- E. Carretti, M. Bonini, L. Dei, B. H. Berrie, L. V. Angelova, P. Baglioni and R. G. Weiss, Acc. Chem. Res., 2010, 43, 751 CrossRef CAS PubMed.
- M. de Loos, B. L. Feringa and J. H. van Esch, Eur. J. Org. Chem., 2005, 3615 CrossRef CAS.
- S. K. Panja and B. G. Bag, ACS Omega, 2020, 5, 30488 CrossRef CAS PubMed.
- S. Ghorai and B. G. Bag, ACS Omega, 2021, 6, 20560 CrossRef CAS PubMed.
- A. Vintilou and J. C. Leroux, J. Controlled Release, 2008, 125, 179 CrossRef PubMed.
- J. H. Jung and S. Shinkai, Top. Curr. Chem., 2004, 248, 223 CrossRef.
- R. V. Ulijn and A. M. Smith, Chem. Soc. Rev., 2008, 37, 664 RSC.
- M. O. M. Piepenbrock, G. O. Lloyd, N. Clarke and J. W. Steed, Chem. Rev., 2010, 110, 1960 CrossRef CAS PubMed.
- T. Kato, Science, 2002, 295, 2414 CrossRef CAS PubMed.
- J. P. Luis, V. Laukhin, A. P. del Pino, J. V. Gancedo, C. Rovira, E. Laukhina and D. B. Amabilino, Angew. Chem., Int. Ed., 2007, 46, 238 CrossRef PubMed.
- W. Kubo, S. Kambe, S. Nakade, T. Kitamura, K. Hanabusa, Y. Wada and S. Yanagida, J. Phys. Chem. B, 2003, 107, 4374 CrossRef CAS.
- S. Li, V. T. John, G. C. Irvin, S. H. Bachakonda, G. L. McPherson and C. J. O'Connor, J. Appl. Phys., 1999, 85, 5965 CrossRef CAS.
- D. D. Diaz, D. Kuhbeck and R. J. Koopmans, Chem. Soc. Rev., 2011, 40, 427 RSC.
- B. G. Bag, G. C. Maity and S. K. Dinda, Org. Lett., 2006, 8, 5457 CrossRef CAS PubMed.
- B. Mondal, D. Bairagi, N. Nandi, B. Hansda, K. S. Das, C. J. C. E. Gayle, V. Castelletto, I. W. Hamley and A. Banerjee, Langmuir, 2020, 36, 12942 CrossRef CAS PubMed.
- K. Basu, N. Nandi, B. Mondal, A. Dehsorkhi, I. W. Hamley and A. Banerjee, Interface Focus, 2017, 7, 20160128 CrossRef PubMed.
- L. A. Estroff and A. D. Hamilton, Chem. Rev., 2004, 104, 1201 CrossRef CAS PubMed.
- P. Xie and R. Zhang, J. Mater. Chem., 2005, 15, 2529 RSC.
- A. Ajayaghosh, V. K. Praveen and C. Vijayakumar, Chem. Soc. Rev., 2008, 37, 109 RSC.
- D. K. Smith, Chem. Commun., 2006, 34–44 RSC.
- M. Delample, F. Jerome, J. Barrault and J. P. Douliez, Green Chem., 2011, 13, 64 RSC.
- B. Novales, L. Navailles, M. Axelos, F. Nallet and J. P. Douliez, Langmuir, 2008, 24, 62 CrossRef CAS PubMed.
- J. P. Douliez, J. Am. Chem. Soc., 2005, 127, 15694 CrossRef CAS PubMed.
- N. Baccile, N. Nassif, L. Malfatti, I. N. A. VanBogaert, W. Soetaert, G. P. Arnaudet and F. Babonneau, Green Chem., 2010, 12, 1564 RSC.
- S. Zhou, C. Xu, J. Wang, W. Gao, R. Khverdiyeva, V. Shah and R. Gross, Langmuir, 2004, 20, 7926 CrossRef CAS PubMed.
- Y. Jang and J. A. Champion, Acc. Chem. Res., 2016, 49, 2188 CrossRef CAS PubMed.
- D. Das, T. Kar and P. K. Das, Soft Matter, 2012, 8, 2348 RSC.
- P. Koley and A. Pramanik, Adv. Funct. Mater., 2011, 21, 4126 CrossRef CAS.
- S. Datta and S. Bhattacharya, Chem. Soc. Rev., 2015, 44, 5596 RSC.
- H. Kobayashi, A. Friggeri, K. Koumoto, M. Amaike, S. Shinkai and D. N. Reinhoudt, Org. Lett., 2002, 4, 1423 CrossRef CAS PubMed.
- E. Virtane and E. Kolehmainen, Eur. J. Org. Chem., 2004, 16, 3385 CrossRef.
- N. He, K. Zhi, X. Yang, H. Zhao, H. Zhang, J. Wang and Z. Wang, New J. Chem., 2018, 42, 14170 RSC.
- B. G. Bag and S. S. Dash, Nanoscale, 2011, 3, 4564 RSC.
- B. G. Bag, S. N. Hasan, P. Pongpamorn and N. Thasana, ChemistrySelect, 2017, 2, 6650 CrossRef CAS.
- F. O. deLima, V. Alves, J. M. B. Filho, J. R. G. da Silva Almeida, L. C. Rodrigues, M. B. P. Soares and C. F. Villarreal, Phytother. Res., 2013, 27, 1557–1563 Search PubMed.
- M. Saleem, Cancer Lett., 2009, 285, 109 CrossRef CAS PubMed.
- D. Palanimuthu, N. Baskaran, S. Silvan, D. Rajasekaran and S. Manoharan, Pathol. Oncol. Res., 2012, 18, 1029 CrossRef CAS PubMed.
- R. K. Ambasta, S. K. Jha, D. Kumar, R. Sharma, N. K. Jha and P. Kumar, J. Transl. Med., 2015, 13, 307 CrossRef PubMed.
- T. O. Vieira, A. Said, E. Aboutabl, M. Azzam and T. B. C. Pasa, Redox Rep., 2009, 14, 41 CrossRef PubMed.
- K. Hata, S. Ogawa, M. Makino, T. Mukaiyama, K. Hori, T. Iida and Y. Fujimoto, J. Nat. Med., 2008, 62, 332 CrossRef CAS PubMed.
- H. H. Kwon, J. Y. Yoon, S. Y. Park, S. Min, Y. Kim, J. Y. Park, Y. S. Lee, D. M. Thiboutot and D. H. Suh, J. Invest. Dermatol., 2015, 135, 1491 CrossRef CAS PubMed.
- P. T. Sudharsan, Y. Mythili, E. Selvakumar and P. Varalakshmi, Mol. Cell. Biochem., 2006, 282, 23 CrossRef CAS PubMed.
- S. K. Panja and B. G. Bag, Prayogik Rasayan, 2019, 3 DOI:10.53023/p.rasayan-20191212.
- K. Zhi, H. Zhao, X. Yang, H. Zhang, J. Wang and Z. Wang, ChemPlusChem, 2018, 83, 797 CrossRef CAS PubMed.
- P. Terech, D. Pasquier, V. Bordas and C. Rossat, Langmuir, 2000, 16, 4485 CrossRef CAS.
- J. Brinksma, B. L. Feringa, R. M. Kellogg, R. Vreeker and J. V. Esch, Langmuir, 2000, 16, 9249 CrossRef CAS.
- K. Lalitha, a. Y. Siva Prasad, V. Sridharan, C. U. Maheswari, G. John and S. Nagarajan, RSC Adv., 2015, 5, 77589 RSC.
- B. G. Bag, S. Ghorai, S. K. Panja, S. K. Dinda and K. Paul, RSC Adv., 2018, 8, 29155 RSC.
- A. Dawn and H. Kumari, Chem.–Eur. J., 2018, 24, 762 CrossRef CAS PubMed.
- M. J. Kamlet, J. L. M. Abboud, M. H. Abraham and R. W. Taft, J. Org. Chem., 1983, 48, 2877 CrossRef CAS.
- A. R. Hirst and D. K. Smith, Langmuir, 2004, 20, 10851 CrossRef CAS PubMed.
- J. Fredericks, J. Yang, S. J. Geib and A. D. Hamilton, Proc. - Indian Acad. Sci., Chem. Sci., 1994, 106(5), 923 CAS.
- S. Manchineella and T. Govindaraju, RSC Adv., 2012, 2, 5539 RSC.
- H. Kar, D. Gehrig, F. Laquai and S. Ghosh, Nanoscale, 2015, 7, 6729–6736 RSC.
- X. Cao, N. Zhao, R. Li, H. Lv, Z. Zhang, A. Gao and T. Yi, Chem.–Asian J., 2016, 11, 3196 CrossRef CAS PubMed.
- N. T. Nguyen and J. H. Liu, Sci. Adv. Mater., 2015, 7, 1282 CrossRef CAS.
- R. S. Corre, C. P. Coelho, M. H. D. Santos, J. Ellenaa and A. C. Doriguettoc, Acta Crystallogr., Sect. A: Found. Adv., 2009, 65, 97 Search PubMed.
- B. G. Bag and A. C. Barai, RSC Adv., 2020, 10, 4755 RSC.
Footnote |
| † Electronic supplementary information (ESI) available: Energy minimized structures, details of thermodynamic parameters, FTIR, rheology, mode of self-assembly based on crystal packing, microscopic images. See DOI: 10.1039/d1ra06137b |
| This journal is © The Royal Society of Chemistry 2021 |

