 Open Access Article
Glutaraldehyde cross-linked CDA/HBP-NH2 nanofiber membrane for adsorption of heavy metal ions in wastewater
Zang Chuanfeng†
a,
Han Xiangye†a,
Dong Eryingb,
Shen Feiyua,
Yan Tingting*a,
Wang Runyuea and
Zhang GuangyuYu *a
*a
aNational & Local Joint Engineering Research Center of Technical Fiber Composites for Safety and Protection, Nantong University, Nantong, Jiangsu 226019, P. R. China. E-mail: ytt@ntue.du.cn; zgyu85@ntu.edu.cn
bZhejiang Kingsafe Nonwoven Fabric Group Co., Ltd, Huzhou, Zhejiang 313100, China
First published on 6th December 2021
Abstract
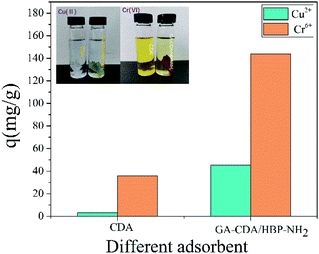
A new type of nanofiber membrane was prepared by mixed electrospinning of cellulose diacetate and amino-terminated hyperbranched polymer (HBP-NH2), and glutaraldehyde (GA) crosslinking was used to improve its water resistance and shape retention. pH, adsorption time, and initial solution concentration on Cu(II) and Cr(VI) ions were studied. Results showed that the prepared GA-CDA/HBP-NH2 nanofiber had good spinning uniformity, hydrophilicity, and adsorption effect on Cu(II) and Cr(VI) ions compared with the pure CDA nanofiber. The maximum adsorption capacity of GA-CDA/HBP-NH2 for Cu(II) and Cr(VI) was 50.2 and 176.6 mg g−1, respectively.
1. Introduction
With the rapid development of industry, considerable wastewater is discharged, resulting in a sharp increase in the content of heavy metal ions such as Cu(II) and Cr(VI) in natural water sources. The heavy metal ions in wastewater are toxic and difficult to remove, and they exist in water for a long time, which is harmful to the environment and human life and health. Even at a trace level in water, these heavy metal ions will have a serious impact on biological health. They may also cause damage to tissues and organs and endanger lives.1–3 At present, the main methods to remove heavy metal ions from waste are chemical precipitation, electrochemical reduction, ion exchange, membrane separation, and adsorption.4–7 Among the methods, the chemical precipitation method requires the addition of a large amount of chemicals, and the sludge produced by the precipitation will increase the processing cost; electrochemical reduction has high cost and low efficiency; ion exchange has high cost, limited scope of application, and high requirements for sewage. In addition, membrane separation primarily includes electrodialysis and reverse osmosis. Although electrodialysis has high filtration efficiency and the membrane of electrodialysis can be recycled, the amount of water treated is small and the cost is high. The reverse osmosis method has high removal rate and simple operation, but the membrane has low strength, short life, and is easy to be blocked. The adsorption method is considered to be an effective means to remove heavy metals due to its simple preparation, low cost, high selectivity, and reusable adsorbents.8–11At present, the combination of nanofiber adsorbent and electrospinning technology has great potential in wastewater treatment.12,13 Electrospinning has the characteristics of simple operation, high efficiency, low cost, and strong versatility. It is a commonly used method for preparing nanofiber membranes.14,15 In addition, the spinning membrane has large specific surface area, high porosity, good permeability, adjustable pore structure, and easy surface functionalization.16,17 Moreover, the composition and structure of electrospun nanofiber films can be modified to obtain satisfactory adsorption properties.18–20
Cellulose is a natural polymer substance with high crystallinity and insolubility in water. It is non-toxic, and it can appear in the form of powder, flake, membrane, and fiber; thus, cellulose is widely used as a matrix material.21 As a cellulose derivative, cellulose diacetate (CDA) is non-toxic and harmless; thus, it is often used as filtering equipment such as glasses frame, handle, packaging film, cigarette filter tip, microporous filter membrane, and electrospinning material.
Hyperbranched polymers (HBP) are highly branched three-dimensional macromolecular materials. Compared with linear and crosslinked analogs, HBP have more branching points; molecular chains cannot be easily entangled; viscosity does not change with the increase of molecular weight, and HBP was rich in terminal functional groups.22 Hyperbranched polymers have been widely used in the fields of coatings, nanotechnology, additives, and biomaterials.23 Given their rich functional groups and good chelating properties, HBP have been considered as an effective way to design and prepare new heavy metal ion adsorbents in recent years. Moreover, HBP can improve the synthesis of a variety of functional materials.24,25 Amino-terminated hyperbranched polymers (HBP-NH2) have rich amino functional groups, which can chelate with a variety of heavy metals to remove heavy metal ions from water.
Zang26 et al. used spun CDA nanofibers as raw materials. After argon plasma treatment, a large number of active free radicals were formed on the surface of CDA nanofibers. Using glutaraldehyde (GA) crosslinking, HBP, which are rich in amino groups, were grafted onto CDA nanofibers to prepare HBP-NH2-modified CDA nanofiber adsorption materials. The adsorption capacity of Cu(II) ion in cationic form and Cr(VI) ion in water primarily in the form of Cr2O72−, CrO42−, and HCrO4− was investigated. Tian27 et al. crosslinked PVA electrospun nanofiber membrane with GA solution. The effects of crosslinking time and concentration of metal ion solution on the adsorption of Cu(II) and Cr(VI) were studied.
In this paper, a new type of nanofiber membrane was prepared by mixed electrospinning of CDA and amino-terminated hyperbranched polymer (HBP-NH2). Glutaraldehyde-crosslinked CDA/HBP-NH2 nanofiber membrane (GA-CDA/HBP-NH2) was prepared by GA vacuum crosslinking to improve its water resistance and shape retention. The formation of GA-CDA/HBP-NH2 and the adsorption effects of different adsorbents, pH, adsorption time, and initial solution concentration on Cu(II) and Cr(VI) ions were investigated.
2. Experimental
2.1. Materials
N,N-Dimethylacetamide(DMAc, AR = 99.0%) and trifluoroacetic acid were purchased from Aladdin Reagent (Shanghai) Co., Ltd. Acetone (CP) was purchased from Shanghai Lingfeng Chemical Reagent Co., Ltd. Cellulose diacetate (CDA) was purchased from Nantong Acetate Fiber Co., Ltd. Hyperbranched polymer (HBP-NH2) was prepared by ourselves. GA (25%) and copper nitrate (Cu(NO3)2·3H2O) were purchased from Sinopharmaceutical Group Chemical Reagent Co., Ltd. Potassium dichromate (K2Cr2O7, GR) was purchased from Tianjin Zhiyuan Chemical Reagent Co., Ltd.2.2. Preparation of CDA/HBP-NH2 electrospun nanofiber membrane
CDA was dissolved in the mixed solution of CP and DMAc (2![[thin space (1/6-em)]](https://www.rsc.org/images/entities/char_2009.gif) :
:![[thin space (1/6-em)]](https://www.rsc.org/images/entities/char_2009.gif) 1) to form a spinning solution of 8%, and then the HBP was dissolved in a certain proportion in the spinning solution. The prepared solution was transferred to a 10 mL syringe using a no. 25 needle, and the voltage was 18 kV. The distance between the needle and the receiving plate was 20 cm, and the speed of the microinjection pump was 0.015 mL min−1. The electrospinning film was removed from the receiving plate and baked in a vacuum drying box at 60 °C for 2 h to remove the residual solvent and sealed for later use.
1) to form a spinning solution of 8%, and then the HBP was dissolved in a certain proportion in the spinning solution. The prepared solution was transferred to a 10 mL syringe using a no. 25 needle, and the voltage was 18 kV. The distance between the needle and the receiving plate was 20 cm, and the speed of the microinjection pump was 0.015 mL min−1. The electrospinning film was removed from the receiving plate and baked in a vacuum drying box at 60 °C for 2 h to remove the residual solvent and sealed for later use.
2.3. Preparation of glutaraldehyde-crosslinked CDA/HBP-NH2 nanofiber membrane (GA-CDA/HBP-NH2)
The nanofiber membrane was separated from the surface of aluminum foil, and then the nanofiber membrane was placed in a vacuum drying dish with 25% GA solution at the bottom of the drying dish, in which trifluoroacetic acid was dripped, and the vacuum was extracted and placed for 72 h. Finally, the crosslinked nanofiber membrane was removed, washed, and dried with deionized water to prepare the GA-crosslinked CDA/HBP-NH2 nanofiber membrane (GA-CDA/HBP-NH2).2.4. Characterization and adsorption experiments
A field-emission scanning electron microscope (Gemini SEM300, Germany) was used to observe the surface micro-morphology and surface element analysis (EDS), and gold was sprayed on the samples before observation. Fourier transform infrared (FT-IR) spectrum was measured in the 400–4000 cm−1 range using a Fourier transform infrared spectrometer (Nicolet, Thermo Scientific, Madison, WI, USA). An X-ray photoelectron spectrometer (XPS, Kratos Axis Ultra DLD, UK) was used to analyze the surface chemical composition of the sample. The contact angle was measured using a contact angle measuring instrument (Dataphysics OCA15EC, Germany).A certain amount of copper nitrate (Cu(NO3)2·3H2O) and potassium dichromate (K2Cr2O7) was dissolved in deionized water to prepare Cu(II) and Cr(VI) solutions of 100 ppm. The remaining concentrations of Cu(II) and Cr(VI) solutions needed in the experiment can be obtained by diluting the prepared 100 ppm solution. The adsorption experiments were conducted on the water bath shaker, and the shaking speed of the water bath shaker was 100 rpm. The experimental conditions were adjusted to test the effects of different adsorbents, pH, contact time, and initial liquid concentration on adsorption. The concentration of heavy metal ion solution was measured using an atomic absorption spectrophotometer (Shimadzu, AA-6880, Japan). The concentration of heavy metal ions was determined as follows:
where qt (mg g−1) and qe (mg g−1) are the adsorption capacity of heavy metal ions at any time t and equilibrium. C0 (mg L−1) is the initial solution concentration; Ct (mg L−1) refers to the concentration at time t; Ce (mg L−1) represents equilibrium concentrations. V (mL) is the volume of heavy metal solution, and m (g) is the adsorbent mass.
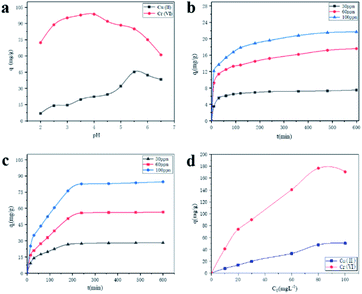
In testing the effect of adsorbent on the adsorption of heavy metal solution under different pH, 0.01 g of GA-CDA/HBP-NH2 was added to a conical bottle of copper nitrate (30 ppm) or potassium dichromate (30 ppm) containing 50 mL, and the pH of the adsorption solution was adjusted to 2.0, 2.5, 3, 3.5, 4, 4.5, 5, 5.5, 6, and 6.5 with 0.1 M HCI and 0.1 M NaOH. The supernatant was diluted after adsorption under constant temperature oscillation for 6 h. The residual amount of metal ion solution was measured.
For the contact time, 0.05 g of the GA-CDA/HBP-NH2 nanofiber membrane was added to the conical bottle. Copper nitrate (30, 60, and 100 ppm) and potassium dichromate (30, 60, and 100 ppm) solutions were added to 50 mL, and their initial pH was 5.5 and 4.0, respectively. Ten parallel experiments were conducted at different contact time (30, 60, 90, 120, 150, 180, 240, 300, 360, and 480 min).
At different initial concentrations (10, 20, 30, 60, and 100 ppm), 0.01 g of GA-CDA/HBP-NH2 was added into a 50 mL solution containing Cu(II) (pH 5.5) and Cr(VI) (pH 4.0). Five parallel experiments were conducted under the contact time of 8 h.
3. Results and discussion
3.1. Characterization of the CDA/HBP-NH2 nanofibers
Given the large amount of amino functional groups, HBP-NH2 can be easily dissolved in water. The CDA/HBP-NH2 nanofiber prepared by electrospinning exhibited poor water resistance. Thus, the nanofiber membrane was crosslinked with GA to address the defect. Fig. 1 shows the configuration and spinning of GA-CDA/HBP-NH2 solution and the whole adsorption process after crosslinking. During the mixed spinning of CDA and HBP-NH2, HBP-NH2 crosslinked to the fiber surface by GA, whereas the surface of HBP-NH2 was rich in amino groups, which will produce electrostatic adsorption with Cu(II) and Cr(VI) in wastewater, thereby providing high adsorption for heavy metal ions.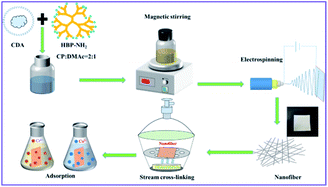 | ||
| Fig. 1 Schematic diagram of the preparation and crosslinking of electrospun membranes and the adsorption of heavy metal ions. | ||
The nanostructure and morphology of nanofibers prepared with different proportions of CDA and HBP-NH2 were first examined under FESEM, and the result is shown in Fig. 2. As shown in Fig. 2(a), the diameter of pure CDA fiber is small, and many beads are found in the fiber netting. These beads are formed by the unevenness of fiber drawing in electrospinning. Fig. 2(b–e) shows that when CDA is added to HBP-NH2, the diameter of the fiber increases, and the beads disappear. Moreover, spinnability is improved at the same CDA concentration, and traces of HBP-NH2 appear on the fiber surface. When the fiber is electrospun, HBP-NH2 will transfer to the surface, and with the increase of HBP-NH2 concentration, the fiber diameter gradually increases. However, with the increase of HBP-NH2 concentration, the fiber morphology changes. The adhesion among the fibers increases, and the surface area of the nanofiber membrane decreases. Therefore, we select CDA![[thin space (1/6-em)]](https://www.rsc.org/images/entities/char_2009.gif) :
:![[thin space (1/6-em)]](https://www.rsc.org/images/entities/char_2009.gif) HBP-NH2 = 1
HBP-NH2 = 1![[thin space (1/6-em)]](https://www.rsc.org/images/entities/char_2009.gif) :
:![[thin space (1/6-em)]](https://www.rsc.org/images/entities/char_2009.gif) 2.5 as the crosslinking object. Fig. 2(f) shows the SEM image of CDA/HBP-NH2 nanofiber membrane with ratio of 1
2.5 as the crosslinking object. Fig. 2(f) shows the SEM image of CDA/HBP-NH2 nanofiber membrane with ratio of 1![[thin space (1/6-em)]](https://www.rsc.org/images/entities/char_2009.gif) :
:![[thin space (1/6-em)]](https://www.rsc.org/images/entities/char_2009.gif) 2.5 after cross-linked with glutaraldehyde. Compared with CDA/HBP-NH2 shown in Fig. 2(d), the surface of the GA-CDA/HBP-NH2 nanofiber is smooth, and the fiber diameter is larger.
2.5 after cross-linked with glutaraldehyde. Compared with CDA/HBP-NH2 shown in Fig. 2(d), the surface of the GA-CDA/HBP-NH2 nanofiber is smooth, and the fiber diameter is larger.
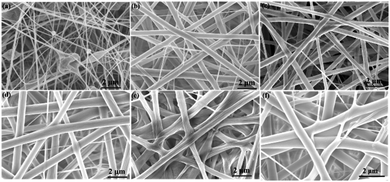 | ||
Fig. 2 SEM images of CDA/HBP-NH2 with different proportions (a) 1![[thin space (1/6-em)]](https://www.rsc.org/images/entities/char_2009.gif) : :![[thin space (1/6-em)]](https://www.rsc.org/images/entities/char_2009.gif) 0, (b) 1 0, (b) 1![[thin space (1/6-em)]](https://www.rsc.org/images/entities/char_2009.gif) : :![[thin space (1/6-em)]](https://www.rsc.org/images/entities/char_2009.gif) 1.5, (c) 1 1.5, (c) 1![[thin space (1/6-em)]](https://www.rsc.org/images/entities/char_2009.gif) : :![[thin space (1/6-em)]](https://www.rsc.org/images/entities/char_2009.gif) 2, (d) 1 2, (d) 1![[thin space (1/6-em)]](https://www.rsc.org/images/entities/char_2009.gif) : :![[thin space (1/6-em)]](https://www.rsc.org/images/entities/char_2009.gif) 2.5, (e) 1 2.5, (e) 1![[thin space (1/6-em)]](https://www.rsc.org/images/entities/char_2009.gif) : :![[thin space (1/6-em)]](https://www.rsc.org/images/entities/char_2009.gif) 3 and (f) 1 3 and (f) 1![[thin space (1/6-em)]](https://www.rsc.org/images/entities/char_2009.gif) : :![[thin space (1/6-em)]](https://www.rsc.org/images/entities/char_2009.gif) 2.5 cross-linked with GA. 2.5 cross-linked with GA. | ||
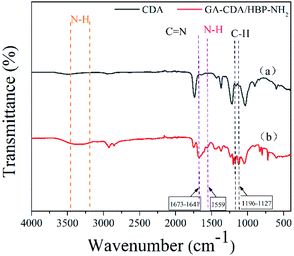
The functional groups on the electrospun membrane were characterized by FT-IR. As shown in Fig. 3, compared with the CDA film, a new peak at 1673 cm−1 belonging to C![[double bond, length as m-dash]](https://www.rsc.org/images/entities/char_e001.gif) N appeared in the GA-CDA/HBP-NH2 nanofiber membranes. In addition, a wide absorption peak was observed between 3100 and 3500 cm−1, which is the stretching vibration absorption peak of N–H formed by the overlap of free-NH2 and –NH and associated-NH2 and NH. The hydrogen bond formed by associating amine weakens the strength of N–H and shifts the absorption peak of N–H stretching vibration to a low wavenumber band.28 The bending vibration absorption peak of N–H appeared at the absorption frequency of 1559 cm−1 for GA-CDA/HBP-NH2, indicating the presence of primary amine in the modified CDA. These results indicated that GA successfully crosslinked CDA/HBP-NH2 nanofibers.
N appeared in the GA-CDA/HBP-NH2 nanofiber membranes. In addition, a wide absorption peak was observed between 3100 and 3500 cm−1, which is the stretching vibration absorption peak of N–H formed by the overlap of free-NH2 and –NH and associated-NH2 and NH. The hydrogen bond formed by associating amine weakens the strength of N–H and shifts the absorption peak of N–H stretching vibration to a low wavenumber band.28 The bending vibration absorption peak of N–H appeared at the absorption frequency of 1559 cm−1 for GA-CDA/HBP-NH2, indicating the presence of primary amine in the modified CDA. These results indicated that GA successfully crosslinked CDA/HBP-NH2 nanofibers.
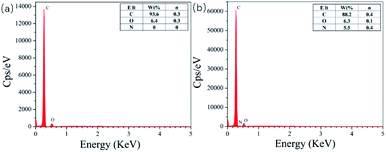
Fig. 4 shows the EDS diagrams of different adsorbents. From Fig. 4(a), we can see that the surface of pure CDA only contains carbon (C) and oxygen (O) elements. The GA-CDA/HBP-NH2 in Fig. 4(b) contains carbon (C) and oxygen (O) as well as nitrogen (N), indicating that it is the result of glutaraldehyde cross-linking HBP-NH2.
X-ray photoelectron spectroscopic analyses of the CDA and GA-CDA/HBP-NH2 nanofiber were conducted to investigate GA crosslinking. Fig. 5 shows the X-ray photoelectron spectroscopy of CDA and GA-CDA/HBP-NH2 nanofiber films and further compares the elemental composition of the modified nanofiber films. As shown in Fig. 5(a), CDA nanofiber films show C 1s and O 1s photoelectron lines at 286.2 and 532.6 eV, respectively, because CDA nanofiber films contain only C and O, whereas GA-CDA/HBP-NH2 nanofiber membranes show evident N 1s photoelectron lines at 398.6 eV, indicating the successful preparation of GA-crosslinked CDA/HBP-NH2. Fig. 5(b) shows the peaks of C 1s in CDA nanofibers. It can be seen from the figure that CDA has chemical bonds corresponding to C–C, C–O and C![[double bond, length as m-dash]](https://www.rsc.org/images/entities/char_e001.gif) O at 284.8 eV, 286.4 eV and 288.7 eV, respectively. Fig. 5(c) shows the peaks of C 1s in GA-CDA/HBP-NH2 nanofibers. GA-CDA/HBP-NH2 has chemical bonds corresponding to C–C and C–N at 284.3 eV and 285.5 eV. The appearance of C–N bonds in GA-CDA/HBP-NH2 nanofibers further confirmed the successful preparation of glutaraldehyde cross-linked CDA/HBP-NH2.
O at 284.8 eV, 286.4 eV and 288.7 eV, respectively. Fig. 5(c) shows the peaks of C 1s in GA-CDA/HBP-NH2 nanofibers. GA-CDA/HBP-NH2 has chemical bonds corresponding to C–C and C–N at 284.3 eV and 285.5 eV. The appearance of C–N bonds in GA-CDA/HBP-NH2 nanofibers further confirmed the successful preparation of glutaraldehyde cross-linked CDA/HBP-NH2.
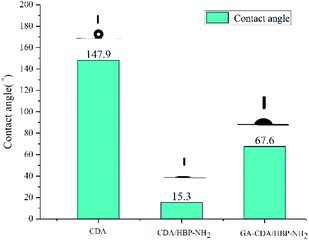
Fig. 6 shows the contact angles of different adsorbents. The contact angle of the adsorbent shows its affinity for heavy metal ion solution adsorption. Materials with high hydrophilicity can make the heavy metal ion solution easier to enter the inside of the fiber membrane. The contact angle of CDA nanofiber membrane is 147.9°, showing super hydrophobicity. The contact angle of CDA/HBP-NH2 is only 15.3°, because the fiber surface contains a lot of amino groups, so it is hydrophilic. The contact angle of GA-CDA/HBP-NH2 is 67.6°. This may be because the cross-linking of glutaraldehyde will cause part of the amino groups on the surface of the nanofibers to be reacted. The decrease in the amount of amino groups reduces the hydrophilicity, so the contact angle get bigger. However, compared with the CDA fiber membrane, the crosslinked nanofiber membrane has increased hydrophilicity, which is beneficial to the adsorption of heavy metal ions.
3.2. Adsorption performance and the effect of pH, adsorption time, and initial liquid concentration on the adsorption performance of GA-CDA/HBP-NH2
The Langmuir adsorption isotherm model is shown in the following equation:
The Freundlich adsorption isotherm model is shown in the following equation:
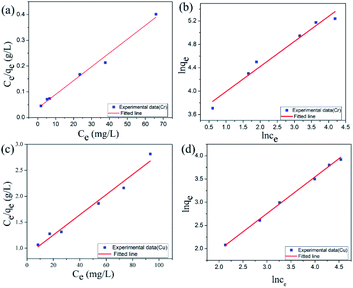
The linear fitting curves of Langmuir and Freundlich isothermal adsorption of Cu(II) ions by GA-CDA/HBP-NH2 adsorbents are shown in Fig. 9(a and b), and the linear fitting parameters are shown in Table 1. Based on the fitted linear correlation coefficient (R2), the fitting curve of the adsorption isotherm of GA-CDA/HBP-NH2 to heavy metal Cu(II) ions has a good correlation with the Freundlich equation, and the linear correlation coefficient (R2) is 0.996, whereas the correlation between the adsorption isotherm and the Langmuir equation is poor. Moreover, the linear correlation coefficient (R2) is only 0.86. As shown in Table 1, the value of 1/n is less than 1, indicating that the adsorption of Cu(II) ions by GA-CDA/HBP-NH2 adsorbents is easy.
| Metal ions | Langmuir model | Freundlich model | ||||
|---|---|---|---|---|---|---|
| KL (L mg−1) | qm (mg g−1) | R2 | 1/n | KF | R2 | |
| Cu(II) | 0.00759 | 122.85 | 0.86486 | 0.78791 | 1.48372 | 0.99471 |
| Cr(VI) | 0.14923 | 186.22 | 0.99075 | 0.42821 | 35.33592 | 0.97244 |
The linear fitting curves of Langmuir and Freundlich isothermal adsorption of Cr(II) ions by GA-CDA/HBP-NH2 adsorbents are shown in Fig. 9(c and d), and the linear fitting parameters are shown in Table 1. Based on the fitted linear correlation coefficient (R2), the fitting curve of the adsorption isotherm of GA-CDA/HBP-NH2 to heavy metal Cr(II) ions has a good correlation with the Langmuir equation, and the linear correlation coefficient (R2) is 0.99. The correlation between the adsorption isotherm and the Freundlich equation is also high, and the linear correlation coefficient (R2) is 0.97. As shown in Table 1, the value of GA-CDA/HBP-NH2 is between 0.1 and 0.5. Therefore, the adsorption of Cr(II) ions by the GA-CDA/HBP-NH2 adsorbent is multi-layer, and the GA-CDA/HBP-NH2 adsorbent has a good adsorption property to Cr(VI) ion.
The Lagergren quasi-first-order kinetic equation was presented as follows:
ln (qe − qt) = ln![[thin space (1/6-em)]](https://www.rsc.org/images/entities/char_2009.gif) qe − K1t qe − K1t |
Lagergren pseudo-second-order kinetic equation was given as follows:
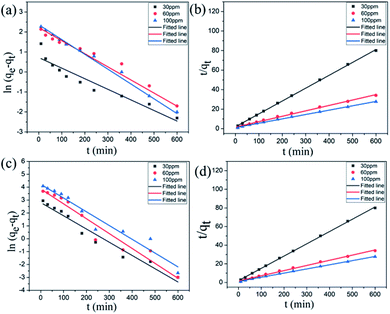
The adsorption data of Cu(II) ions with different concentrations of adsorbents are fitted, and the relevant data are shown in Table 2. As shown in Table 2, R2 obtained by quasi-second-order kinetic equation regression fitting is greater than 0.996, which is better than that obtained by quasi-first-order kinetic equation. In addition, the equilibrium adsorption capacity of Cu(II) ions obtained from heavy metal adsorption experiments is close to the qe value calculated by the quasi-second-order kinetic equation. This result shows that the quasi-second-order kinetic equation of Lagergren can well simulate the adsorption of Cu(II) ions by GA-CDA/HBP-NH2, and the adsorption of Cu(II) ions by GA-CDA/HBP-NH2 belongs to chemical adsorption.
| Concentration | Pseudo-first-order model | Pseudo-second-order model | ||||
|---|---|---|---|---|---|---|
| qe (mg g−1) | K1 (min−1) | R2 | qe (mg g−1) | K2 (min−1) | R2 | |
| 30 ppm | 2.1 | 0.00529 | 0.9033 | 7.59 | 0.00888 | 0.99963 |
| 60 ppm | 8.55 | 0.00592 | 0.97091 | 18.05 | 0.00189 | 0.996 |
| 100 ppm | 10.23 | 0.00709 | 0.99293 | 22.40 | 0.00177 | 0.99837 |
The adsorption data of Cr(VI) ions with different concentrations of adsorbents are fitted, and the relevant data are shown in Table 3. As shown in Table 3, R2 obtained by the quasi-second-order kinetic equation regression fitting is greater than 0.990, which is better than that obtained by quasi-first-order kinetic equation, and the equilibrium adsorption capacity of Cr(VI) ions obtained from heavy metal adsorption experiments is close to the qe value calculated by the quasi-second-order kinetic equation. The quasi-second-order kinetic equation of Lagergren can well simulate the adsorption of Cr(VI) ions by GA-CDA/HBP-NH2, and the adsorption of Cr(VI) ions by GA-CDA/HBP-NH2 belongs to chemical adsorption.
| Concentration | Pseudo-first-order model | Pseudo-second-order model | ||||
|---|---|---|---|---|---|---|
| qe (mg g−1) | K1 (min−1) | R2 | qe (mg g−1) | K2 (min−1) | R2 | |
| 30 ppm | 16.57 | 0.01026 | 0.96007 | 30.3 | 0.001 | 0.99796 |
| 60 ppm | 47.63 | 0.01155 | 0.94371 | 63.01 | 0.00028 | 0.99096 |
| 100 ppm | 68.63 | 0.01068 | 0.9464 | 92.51 | 0.00022 | 0.99446 |
3.3. SEM image and EDS mapping of CDA and GA-CDA/HBP-NH2 after adsorption of heavy metals
The surface morphology of CDA and GA-CDA/HBP-NH2 was imaged by SEM and EDS to confirm the adsorption of Cu(II) and Cr(VI) ions. Fig. 11 shows the SEM diagram of the nanofiber membrane after adsorption of heavy metals. As shown in Fig. 11(a and c), the surface of the CDA fiber is relatively smooth, without metal aggregates of Cu(II) and Cr(VI) ions, indicating that the adsorption effect of CDA is poor. Fig. 9(b and d) shows a large number of metal aggregates on the fiber surface because of the presence of HBP-NH2 on the fiber membrane surface; therefore, the fiber membrane has adsorption properties.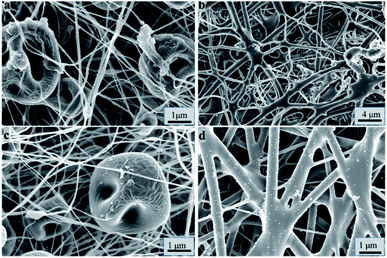 | ||
| Fig. 11 SEM images of CDA and GA-CDA/HBP-NH2 after adsorption of heavy metals: (a and b) adsorption of Cu(II), (c and d) adsorption of Cr(VI), (a and c) CDA, and (b and d) GA-CDA/HBP-NH2 nanofibers. | ||
Fig. 12(a and b) shows the EDS diagram of Cu(II) ion adsorption. Cu is evenly distributed on the surface of the adsorbed GA-CDA/HBP-NH2, indicating that the modified adsorbent has an effect on Cu(II). Ion has a good adsorption effect. Fig. 12(c and d) shows the EDS diagram of adsorbing Cr(VI) ions. The surface of the adsorbed GA-CDA/HBP-NH2 is evenly distributed with Cr. The latter adsorbent has a good adsorption effect on Cr(VI) ions.
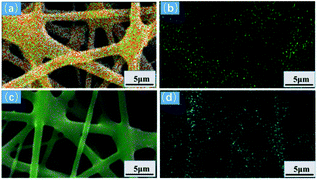 | ||
| Fig. 12 EDS mapping of nanofibers adsorbing heavy metal ions: (a) Cu(II), (b) Cu(II) distribution, (c) Cr(VI), and (d) Cr(VI) distribution. | ||
4. Conclusion
Amino-rich GA-CDA/HBP-NH2 nanofiber membranes were successfully prepared to remove heavy metal ions from water. The GA-CDA/HBP-NH2 nanofiber membrane was characterized by SEM, FT-IR, XPS, EDS, and other testing methods, and these methods confirmed that GA was successfully crosslinked CDA/HBP-NH2. The adsorption behavior of metal ions on the GA-CDA/HBP-NH2 adsorbent was studied by constant temperature oscillation adsorption. The results of adsorption experiments showed that the optimum pH for adsorption of Cu(II) and Cr(VI) was 5.5 and 4.0, and the best adsorption time for Cu(II) and Cr(VI) was 480 and 240 min, respectively. When the amount of adsorbent was 0.01 g, the optimum concentration of Cu(II) and Cr(VI) ions in the initial solution was 80 mg L−1. The adsorption performance of the GA-CDA/HBP-NH2 membrane for Cr(VI) was better than that for Cu(II). The adsorption kinetics analysis showed that the adsorption isotherms of Cu(II) and Cr(VI) ions were in accordance with the Freundlich model, and the adsorption process was in accordance with the Lagergren quasi-second-order kinetic model. Therefore, the GA-CDA/HBP-NH2 nanofiber membrane had great application potential.Conflicts of interest
There are no conflicts to declare.Acknowledgements
The present work was supported financially by the National Key Research and Development Program of China (No. 2016YFB0303100), National Natural Science Foundation of China (No. 51503105).Notes and references
- X. Huang, M. Sillanpaa, B. Duo and E. T. Gjessing, Environ. Pollut., 2008, 156, 270–277 CrossRef CAS PubMed.
- S. Rezania, S. M. Taib, M. F. M. Din, F. A. Dahalan and H. Kamyab, J. Hazard. Mater., 2016, 318, 587–599 CrossRef CAS PubMed.
- P. R. Gogate and A. B. Pandit, Adv. Environ. Res., 2004, 8, 553–597 CrossRef CAS.
- U. S. Toti and T. M. Aminabhavi, J. Membr. Sci., 2004, 228, 199–208 CrossRef CAS.
- M. Al-Shannag, Z. Al-Qodah, K. Bani-Melhem, M. R. Qtaishat and M. Alkasrawi, Chem. Eng. J., 2015, 260, 749–756 CrossRef CAS.
- N. Ghaemi, S. S. Madaeni, P. Daraei, H. Rajabi, S. Zinadini, A. Alizadeh, R. Heydari, M. Beygzadeh and S. Ghouzivand, Chem. Eng. J., 2015, 263, 101–112 CrossRef CAS.
- E. Igberase, P. Osifo and A. Ofomaja, J. Environ. Chem. Eng., 2014, 2, 362–369 CrossRef CAS.
- E. Haque, V. Lo, A. I. Minett, A. T. Harris and T. L. Church, J. Mater. Chem. A, 2014, 2, 193–203 RSC.
- G. Crini, Prog. Polym. Sci., 2005, 30, 38–70 CrossRef CAS.
- N. Wu, H. Wei and L. Zhang, Environ. Sci. Technol., 2012, 46, 419–425 CrossRef CAS PubMed.
- A. Alsbaiee, B. J. Smith, L. Xiao, Y. Ling, D. E. Helbling and W. R. Dichtel, Nature, 2016, 529, 190-U146 CrossRef PubMed.
- D. Qin, W. Lu, X. Wang, N. Li, X. Chen, Z. Zhu and W. Chen, ACS Appl. Mater. Interfaces, 2016, 8, 25962–25970 CrossRef CAS PubMed.
- S. Peng, G. Jin, L. Li, K. Li, M. Srinivasan, S. Ramakrishna and J. Chen, Chem. Soc. Rev., 2016, 45, 1225–1241 RSC.
- X. Lu, C. Wang and Y. Wei, Small, 2009, 5, 2349–2370 CrossRef CAS PubMed.
- X. Lu, C. Wang, F. Favier and N. Pinna, Adv. Energy Mater., 2017, 7, 1601301 CrossRef.
- D. Li and Y. Xia, Nano Lett., 2003, 3, 555–560 CrossRef CAS.
- O. K. Pereao, C. Bode-Aluko, G. Ndayambaje, O. Fatoba and L. F. Petrik, J. Polym. Environ., 2017, 25, 1175–1189 CrossRef CAS.
- S. S. Ray, S.-S. Chen, C.-W. Li, N. Nguyen Cong and N. Hau Thi, RSC Adv., 2016, 6, 85495–85514 RSC.
- Y. Huang, Y.-E. Miao and T. Liu, J. Appl. Polym. Sci., 2014, 131, 40864 Search PubMed.
- F. E. Ahmed, B. S. Lalia and R. Hashaikeh, Desalination, 2015, 356, 15–30 CrossRef CAS.
- X. Chen, G. Chen and P. L. Yue, Environ. Sci. Technol., 2002, 36, 778–783 CrossRef CAS PubMed.
- Y. Chen, L. Wang, H. Yu, Y. Zhao, R. Sun, G. Jing, J. Huang, H. Khalid, N. M. Abbasi and M. Akram, Prog. Polym. Sci., 2015, 45, 23–43 CrossRef CAS.
- Y. Zheng, S. Li, Z. Weng and C. Gao, Chem. Soc. Rev., 2015, 44, 4091–4130 RSC.
- M. B. Camarada, M. Zuniga, J. Alzate-Morales and L. S. Santos, Chem. Phys. Lett., 2014, 616, 171–177 CrossRef.
- Z. Zarghami, A. Akbari, A. M. Latifi and M. A. Amani, Bioresour. Technol., 2016, 205, 230–238 CrossRef CAS PubMed.
- C. Zang, Y. Ren, F. Wang, H. Lin and Y. Chen, J. Eng. Fibers Fabr., 2016, 11, 9–18 CAS.
- H. Tian, L. Yuan, J. Wang, H. Wu, H. Wang, A. Xiang, B. Ashok and A. V. Rajulu, J. Hazard. Mater., 2019, 378, 120751 CrossRef CAS PubMed.
- D. Zhang, L. Chen, C. Zang, Y. Chen and H. Lin, Carbohydr. Polym., 2013, 92, 2088–2094 CrossRef CAS PubMed.
- L. Lv, J. Zhang, S. Yuan, L. Huang, S. Tang, B. Liang and S. O. Pehkonen, RSC Adv., 2016, 6, 78136–78150 RSC.
Footnote |
| † These authors contributed equally to this work. |
| This journal is © The Royal Society of Chemistry 2021 |


